
Key Insights
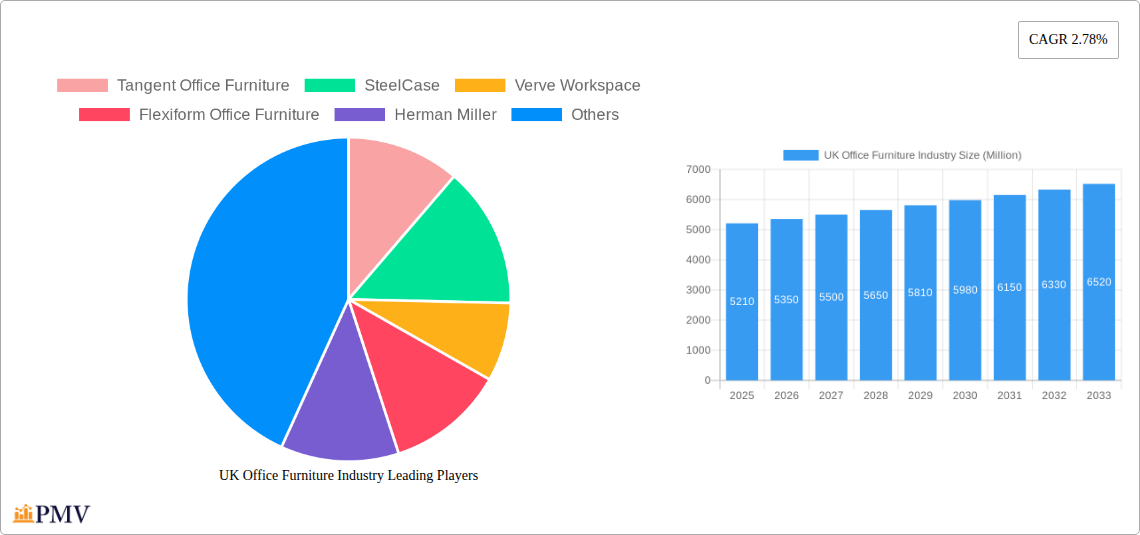
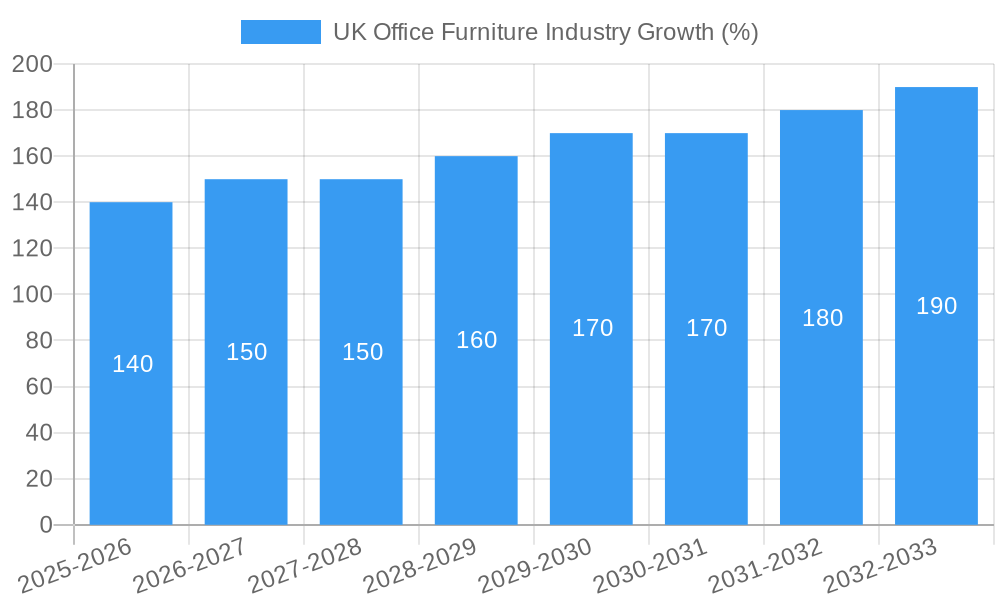
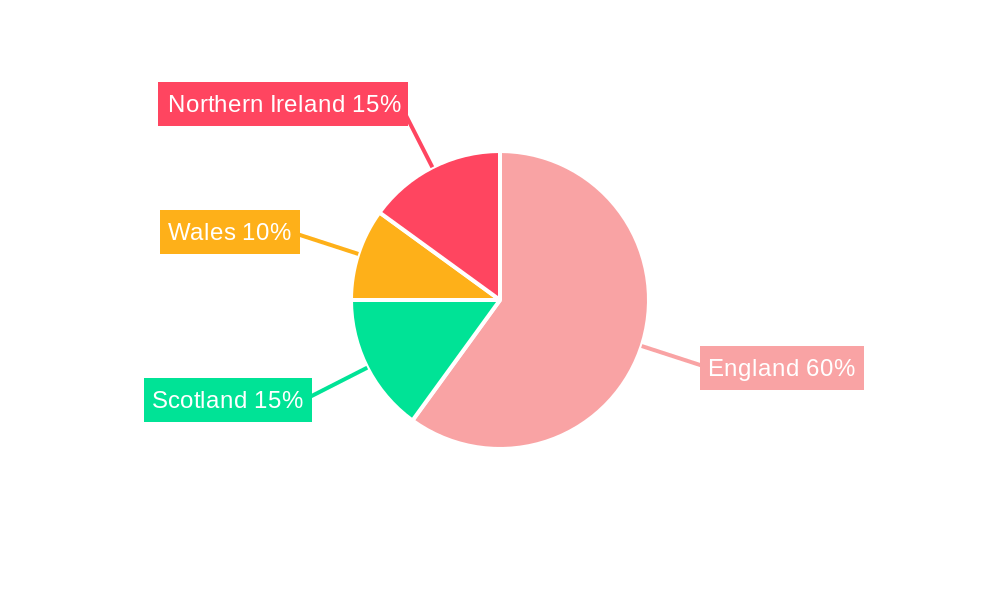
The UK office furniture market, valued at £5.21 billion in 2025, is projected to experience steady growth, exhibiting a Compound Annual Growth Rate (CAGR) of 2.78% from 2025 to 2033. This growth is driven by several key factors. The increasing adoption of hybrid work models necessitates adaptable and ergonomic furniture solutions, boosting demand for adjustable desks, ergonomic chairs, and modular storage systems. Furthermore, a focus on creating productive and aesthetically pleasing workspaces is driving investment in high-quality furniture across various sectors, from traditional offices to co-working spaces. The rise of e-commerce and improved online retail experiences are also contributing to market expansion, with online stores becoming a significant distribution channel alongside traditional channels like home centers and specialty stores. However, economic uncertainty and potential fluctuations in commercial real estate activity could act as restraints, impacting overall market expansion. The market is segmented by furniture type (seating, tables, storage, desks, and others) and distribution channels, reflecting diverse consumer needs and purchasing preferences across the UK regions of England, Wales, Scotland, and Northern Ireland. Competition is intense, with both established international players like Steelcase and Herman Miller and domestic companies like Tangent Office Furniture vying for market share. Future growth will likely be influenced by evolving workplace trends, technological advancements in furniture design, and the overarching economic climate.
The market's segmentation offers significant opportunities for specialized providers. The "others" category, encompassing specialized furniture like collaborative workspaces and break-out areas, is anticipated to see above-average growth due to the increasing focus on employee well-being and fostering collaborative environments. Strategic partnerships between furniture manufacturers and interior design firms are likely to emerge, further driving innovation and tailored solutions for businesses. The market will see an ongoing transition toward sustainable and environmentally friendly materials and manufacturing processes, aligning with growing consumer and corporate sustainability initiatives. Understanding these trends and adapting to the evolving needs of businesses will be crucial for success in the dynamic UK office furniture market.
UK Office Furniture Industry: Market Report 2019-2033
This comprehensive report provides an in-depth analysis of the UK office furniture industry, covering market size, segmentation, competitive landscape, and future growth prospects from 2019 to 2033. The study period spans 2019-2024 (historical period), with 2025 as the base year and the forecast period extending to 2033. This report is crucial for businesses, investors, and stakeholders seeking to understand the dynamics of this £xx billion market.
UK Office Furniture Industry Market Structure & Competitive Dynamics
The UK office furniture market exhibits a moderately concentrated structure, with a handful of major players and numerous smaller, specialized firms. Key players such as Steelcase, Herman Miller, and Knoll compete on factors such as design innovation, brand reputation, and distribution network strength. The market is characterized by ongoing innovation in materials, ergonomics, and smart office technology. The regulatory environment primarily focuses on safety and environmental standards. Product substitutes include refurbished furniture and home-office solutions. End-user trends reflect a shift towards flexible workspaces and agile office designs, influenced by the rise of hybrid working models.
Market Concentration: The top 5 players hold an estimated xx% market share in 2025.
M&A Activity: Significant M&A activity has been observed, including Steelcase Inc.'s acquisition of Halcon for USD 127.5 million in 2022, highlighting the consolidation trend in the sector. Total M&A deal value for the period 2019-2024 is estimated at £xx billion.
- Key Players: Steelcase, Herman Miller, Knoll, etc.
- Market Share (2025): Top 5 players - xx%
- M&A Deal Value (2019-2024): £xx billion
UK Office Furniture Industry Industry Trends & Insights
The UK office furniture market is projected to witness a CAGR of xx% during the forecast period (2025-2033), driven by factors such as increasing office construction, refurbishment projects, and the evolving needs of modern workspaces. Technological disruptions, particularly the adoption of smart office solutions and sustainable materials, are significantly impacting market dynamics. Consumer preferences are shifting towards ergonomic designs, modular furniture, and environmentally friendly products. The competitive landscape is characterized by intense competition, with companies focusing on differentiation through design, functionality, and sustainability. Market penetration of ergonomic chairs, for example, is estimated at xx% in 2025 and is projected to rise to xx% by 2033.
Dominant Markets & Segments in UK Office Furniture Industry
The London region dominates the UK office furniture market, driven by high office density, substantial construction activity, and strong corporate presence. Within the product segments, seating and desks represent the largest market shares, while online stores are experiencing rapid growth as a distribution channel.
Key Drivers:
- London Region: High office density, significant construction activity, strong corporate presence.
- Seating & Desks: High demand driven by large office spaces and individual needs.
- Online Stores: Increasing consumer preference for convenient online shopping.
Dominance Analysis: The London region accounts for approximately xx% of the total market value, while seating and desks account for xx% and xx% respectively, of the total product segment.
UK Office Furniture Industry Product Innovations
Recent innovations include the integration of smart technology into office furniture, promoting enhanced collaboration and productivity. Sustainable materials and manufacturing processes are gaining traction, reflecting growing environmental consciousness. Ergonomic designs, focusing on employee well-being, are becoming increasingly prevalent. These innovations cater to the evolving needs of modern workspaces and competitive pressures.
Report Segmentation & Scope
The report segments the market by product type (Seating, Tables, Storage, Desks, Other Office Furniture) and distribution channels (Home Centers, Flagship Stores, Specialty Stores, Online Stores, Other Distribution Channels). Each segment's growth projections, market sizes, and competitive dynamics are analyzed. For example, the seating segment is expected to register a CAGR of xx% during the forecast period, driven by the increasing preference for ergonomic chairs. Online stores are projected to witness the highest growth among distribution channels.
Key Drivers of UK Office Furniture Industry Growth
Key growth drivers include rising office construction, government initiatives promoting workspace modernization, and increasing adoption of flexible working models. Technological advancements, such as the integration of smart features, are further boosting market growth. Economic factors, such as rising disposable incomes and corporate investments in office upgrades, also play a significant role.
Challenges in the UK Office Furniture Industry Sector
The industry faces challenges including fluctuating raw material prices, supply chain disruptions impacting production timelines and costs, and intense competition from both domestic and international players. Brexit-related complexities also present some degree of uncertainty for businesses. These factors combined can impact profitability and growth.
Leading Players in the UK Office Furniture Industry Market
- Tangent Office Furniture
- SteelCase
- Verve Workspace
- Flexiform Office Furniture
- Herman Miller
- Verco Office Furniture
- Lee & Plumpton
- The Frem Group
- Margolis Furniture
- Knoll
- Metric Office Furniture
- HumanScale
- Urban Office
Key Developments in UK Office Furniture Industry Sector
- May 2022: Steelcase Inc. acquired Halcon for USD 127.5 million.
- 2022: Herman Miller launched the Zeph Chair in collaboration with Studio 7.5.
Strategic UK Office Furniture Industry Market Outlook
The UK office furniture market presents significant growth opportunities, driven by continuous innovation in product design, technological integration, and the increasing adoption of sustainable practices. Companies focusing on ergonomic solutions, flexible workspace designs, and environmentally friendly materials are poised for success. Strategic partnerships, investments in research and development, and expansion into new distribution channels will be crucial for capturing market share and driving future growth.
UK Office Furniture Industry Segmentation
-
1. Type
- 1.1. Seating
- 1.2. Tables
- 1.3. Storage
- 1.4. Other Office Furniture
-
2. Distribution Channel
- 2.1. Home Centers
- 2.2. Flagship Stores
- 2.3. Specialty Stores
- 2.4. Online Stores
- 2.5. Other Distribution Channels
UK Office Furniture Industry Segmentation By Geography
-
1. North America
- 1.1. United States
- 1.2. Canada
- 1.3. Mexico
-
2. South America
- 2.1. Brazil
- 2.2. Argentina
- 2.3. Rest of South America
-
3. Europe
- 3.1. United Kingdom
- 3.2. Germany
- 3.3. France
- 3.4. Italy
- 3.5. Spain
- 3.6. Russia
- 3.7. Benelux
- 3.8. Nordics
- 3.9. Rest of Europe
-
4. Middle East & Africa
- 4.1. Turkey
- 4.2. Israel
- 4.3. GCC
- 4.4. North Africa
- 4.5. South Africa
- 4.6. Rest of Middle East & Africa
-
5. Asia Pacific
- 5.1. China
- 5.2. India
- 5.3. Japan
- 5.4. South Korea
- 5.5. ASEAN
- 5.6. Oceania
- 5.7. Rest of Asia Pacific
UK Office Furniture Industry REPORT HIGHLIGHTS
| Aspects | Details |
|---|---|
| Study Period | 2019-2033 |
| Base Year | 2024 |
| Estimated Year | 2025 |
| Forecast Period | 2025-2033 |
| Historical Period | 2019-2024 |
| Growth Rate | CAGR of 2.78% from 2019-2033 |
| Segmentation |
|
Table of Contents
- 1. Introduction
- 1.1. Research Scope
- 1.2. Market Segmentation
- 1.3. Research Methodology
- 1.4. Definitions and Assumptions
- 2. Executive Summary
- 2.1. Introduction
- 3. Market Dynamics
- 3.1. Introduction
- 3.2. Market Drivers
- 3.2.1. Tech-Integrated Furniture are Helping to Grow the Market
- 3.3. Market Restrains
- 3.3.1. Raw Material Cost Barrier to Growth
- 3.4. Market Trends
- 3.4.1. Growing Flexible Office Spaces in the Country
- 4. Market Factor Analysis
- 4.1. Porters Five Forces
- 4.2. Supply/Value Chain
- 4.3. PESTEL analysis
- 4.4. Market Entropy
- 4.5. Patent/Trademark Analysis
- 5. Global UK Office Furniture Industry Analysis, Insights and Forecast, 2019-2031
- 5.1. Market Analysis, Insights and Forecast - by Type
- 5.1.1. Seating
- 5.1.2. Tables
- 5.1.3. Storage
- 5.1.4. Other Office Furniture
- 5.2. Market Analysis, Insights and Forecast - by Distribution Channel
- 5.2.1. Home Centers
- 5.2.2. Flagship Stores
- 5.2.3. Specialty Stores
- 5.2.4. Online Stores
- 5.2.5. Other Distribution Channels
- 5.3. Market Analysis, Insights and Forecast - by Region
- 5.3.1. North America
- 5.3.2. South America
- 5.3.3. Europe
- 5.3.4. Middle East & Africa
- 5.3.5. Asia Pacific
- 5.1. Market Analysis, Insights and Forecast - by Type
- 6. North America UK Office Furniture Industry Analysis, Insights and Forecast, 2019-2031
- 6.1. Market Analysis, Insights and Forecast - by Type
- 6.1.1. Seating
- 6.1.2. Tables
- 6.1.3. Storage
- 6.1.4. Other Office Furniture
- 6.2. Market Analysis, Insights and Forecast - by Distribution Channel
- 6.2.1. Home Centers
- 6.2.2. Flagship Stores
- 6.2.3. Specialty Stores
- 6.2.4. Online Stores
- 6.2.5. Other Distribution Channels
- 6.1. Market Analysis, Insights and Forecast - by Type
- 7. South America UK Office Furniture Industry Analysis, Insights and Forecast, 2019-2031
- 7.1. Market Analysis, Insights and Forecast - by Type
- 7.1.1. Seating
- 7.1.2. Tables
- 7.1.3. Storage
- 7.1.4. Other Office Furniture
- 7.2. Market Analysis, Insights and Forecast - by Distribution Channel
- 7.2.1. Home Centers
- 7.2.2. Flagship Stores
- 7.2.3. Specialty Stores
- 7.2.4. Online Stores
- 7.2.5. Other Distribution Channels
- 7.1. Market Analysis, Insights and Forecast - by Type
- 8. Europe UK Office Furniture Industry Analysis, Insights and Forecast, 2019-2031
- 8.1. Market Analysis, Insights and Forecast - by Type
- 8.1.1. Seating
- 8.1.2. Tables
- 8.1.3. Storage
- 8.1.4. Other Office Furniture
- 8.2. Market Analysis, Insights and Forecast - by Distribution Channel
- 8.2.1. Home Centers
- 8.2.2. Flagship Stores
- 8.2.3. Specialty Stores
- 8.2.4. Online Stores
- 8.2.5. Other Distribution Channels
- 8.1. Market Analysis, Insights and Forecast - by Type
- 9. Middle East & Africa UK Office Furniture Industry Analysis, Insights and Forecast, 2019-2031
- 9.1. Market Analysis, Insights and Forecast - by Type
- 9.1.1. Seating
- 9.1.2. Tables
- 9.1.3. Storage
- 9.1.4. Other Office Furniture
- 9.2. Market Analysis, Insights and Forecast - by Distribution Channel
- 9.2.1. Home Centers
- 9.2.2. Flagship Stores
- 9.2.3. Specialty Stores
- 9.2.4. Online Stores
- 9.2.5. Other Distribution Channels
- 9.1. Market Analysis, Insights and Forecast - by Type
- 10. Asia Pacific UK Office Furniture Industry Analysis, Insights and Forecast, 2019-2031
- 10.1. Market Analysis, Insights and Forecast - by Type
- 10.1.1. Seating
- 10.1.2. Tables
- 10.1.3. Storage
- 10.1.4. Other Office Furniture
- 10.2. Market Analysis, Insights and Forecast - by Distribution Channel
- 10.2.1. Home Centers
- 10.2.2. Flagship Stores
- 10.2.3. Specialty Stores
- 10.2.4. Online Stores
- 10.2.5. Other Distribution Channels
- 10.1. Market Analysis, Insights and Forecast - by Type
- 11. England UK Office Furniture Industry Analysis, Insights and Forecast, 2019-2031
- 12. Wales UK Office Furniture Industry Analysis, Insights and Forecast, 2019-2031
- 13. Scotland UK Office Furniture Industry Analysis, Insights and Forecast, 2019-2031
- 14. Northern UK Office Furniture Industry Analysis, Insights and Forecast, 2019-2031
- 15. Ireland UK Office Furniture Industry Analysis, Insights and Forecast, 2019-2031
- 16. Competitive Analysis
- 16.1. Global Market Share Analysis 2024
- 16.2. Company Profiles
- 16.2.1 Tangent Office Furniture
- 16.2.1.1. Overview
- 16.2.1.2. Products
- 16.2.1.3. SWOT Analysis
- 16.2.1.4. Recent Developments
- 16.2.1.5. Financials (Based on Availability)
- 16.2.2 SteelCase
- 16.2.2.1. Overview
- 16.2.2.2. Products
- 16.2.2.3. SWOT Analysis
- 16.2.2.4. Recent Developments
- 16.2.2.5. Financials (Based on Availability)
- 16.2.3 Verve Workspace
- 16.2.3.1. Overview
- 16.2.3.2. Products
- 16.2.3.3. SWOT Analysis
- 16.2.3.4. Recent Developments
- 16.2.3.5. Financials (Based on Availability)
- 16.2.4 Flexiform Office Furniture
- 16.2.4.1. Overview
- 16.2.4.2. Products
- 16.2.4.3. SWOT Analysis
- 16.2.4.4. Recent Developments
- 16.2.4.5. Financials (Based on Availability)
- 16.2.5 Herman Miller
- 16.2.5.1. Overview
- 16.2.5.2. Products
- 16.2.5.3. SWOT Analysis
- 16.2.5.4. Recent Developments
- 16.2.5.5. Financials (Based on Availability)
- 16.2.6 Verco Office Furniture
- 16.2.6.1. Overview
- 16.2.6.2. Products
- 16.2.6.3. SWOT Analysis
- 16.2.6.4. Recent Developments
- 16.2.6.5. Financials (Based on Availability)
- 16.2.7 Lee & Plumpton
- 16.2.7.1. Overview
- 16.2.7.2. Products
- 16.2.7.3. SWOT Analysis
- 16.2.7.4. Recent Developments
- 16.2.7.5. Financials (Based on Availability)
- 16.2.8 The Frem Group
- 16.2.8.1. Overview
- 16.2.8.2. Products
- 16.2.8.3. SWOT Analysis
- 16.2.8.4. Recent Developments
- 16.2.8.5. Financials (Based on Availability)
- 16.2.9 Margolis Furniture
- 16.2.9.1. Overview
- 16.2.9.2. Products
- 16.2.9.3. SWOT Analysis
- 16.2.9.4. Recent Developments
- 16.2.9.5. Financials (Based on Availability)
- 16.2.10 Knoll
- 16.2.10.1. Overview
- 16.2.10.2. Products
- 16.2.10.3. SWOT Analysis
- 16.2.10.4. Recent Developments
- 16.2.10.5. Financials (Based on Availability)
- 16.2.11 Metric Office Furniture
- 16.2.11.1. Overview
- 16.2.11.2. Products
- 16.2.11.3. SWOT Analysis
- 16.2.11.4. Recent Developments
- 16.2.11.5. Financials (Based on Availability)
- 16.2.12 HumanScale
- 16.2.12.1. Overview
- 16.2.12.2. Products
- 16.2.12.3. SWOT Analysis
- 16.2.12.4. Recent Developments
- 16.2.12.5. Financials (Based on Availability)
- 16.2.13 Urban Office
- 16.2.13.1. Overview
- 16.2.13.2. Products
- 16.2.13.3. SWOT Analysis
- 16.2.13.4. Recent Developments
- 16.2.13.5. Financials (Based on Availability)
- 16.2.1 Tangent Office Furniture
List of Figures
- Figure 1: Global UK Office Furniture Industry Revenue Breakdown (Million, %) by Region 2024 & 2032
- Figure 2: Global UK Office Furniture Industry Volume Breakdown (K Unit, %) by Region 2024 & 2032
- Figure 3: United kingdom Region UK Office Furniture Industry Revenue (Million), by Country 2024 & 2032
- Figure 4: United kingdom Region UK Office Furniture Industry Volume (K Unit), by Country 2024 & 2032
- Figure 5: United kingdom Region UK Office Furniture Industry Revenue Share (%), by Country 2024 & 2032
- Figure 6: United kingdom Region UK Office Furniture Industry Volume Share (%), by Country 2024 & 2032
- Figure 7: North America UK Office Furniture Industry Revenue (Million), by Type 2024 & 2032
- Figure 8: North America UK Office Furniture Industry Volume (K Unit), by Type 2024 & 2032
- Figure 9: North America UK Office Furniture Industry Revenue Share (%), by Type 2024 & 2032
- Figure 10: North America UK Office Furniture Industry Volume Share (%), by Type 2024 & 2032
- Figure 11: North America UK Office Furniture Industry Revenue (Million), by Distribution Channel 2024 & 2032
- Figure 12: North America UK Office Furniture Industry Volume (K Unit), by Distribution Channel 2024 & 2032
- Figure 13: North America UK Office Furniture Industry Revenue Share (%), by Distribution Channel 2024 & 2032
- Figure 14: North America UK Office Furniture Industry Volume Share (%), by Distribution Channel 2024 & 2032
- Figure 15: North America UK Office Furniture Industry Revenue (Million), by Country 2024 & 2032
- Figure 16: North America UK Office Furniture Industry Volume (K Unit), by Country 2024 & 2032
- Figure 17: North America UK Office Furniture Industry Revenue Share (%), by Country 2024 & 2032
- Figure 18: North America UK Office Furniture Industry Volume Share (%), by Country 2024 & 2032
- Figure 19: South America UK Office Furniture Industry Revenue (Million), by Type 2024 & 2032
- Figure 20: South America UK Office Furniture Industry Volume (K Unit), by Type 2024 & 2032
- Figure 21: South America UK Office Furniture Industry Revenue Share (%), by Type 2024 & 2032
- Figure 22: South America UK Office Furniture Industry Volume Share (%), by Type 2024 & 2032
- Figure 23: South America UK Office Furniture Industry Revenue (Million), by Distribution Channel 2024 & 2032
- Figure 24: South America UK Office Furniture Industry Volume (K Unit), by Distribution Channel 2024 & 2032
- Figure 25: South America UK Office Furniture Industry Revenue Share (%), by Distribution Channel 2024 & 2032
- Figure 26: South America UK Office Furniture Industry Volume Share (%), by Distribution Channel 2024 & 2032
- Figure 27: South America UK Office Furniture Industry Revenue (Million), by Country 2024 & 2032
- Figure 28: South America UK Office Furniture Industry Volume (K Unit), by Country 2024 & 2032
- Figure 29: South America UK Office Furniture Industry Revenue Share (%), by Country 2024 & 2032
- Figure 30: South America UK Office Furniture Industry Volume Share (%), by Country 2024 & 2032
- Figure 31: Europe UK Office Furniture Industry Revenue (Million), by Type 2024 & 2032
- Figure 32: Europe UK Office Furniture Industry Volume (K Unit), by Type 2024 & 2032
- Figure 33: Europe UK Office Furniture Industry Revenue Share (%), by Type 2024 & 2032
- Figure 34: Europe UK Office Furniture Industry Volume Share (%), by Type 2024 & 2032
- Figure 35: Europe UK Office Furniture Industry Revenue (Million), by Distribution Channel 2024 & 2032
- Figure 36: Europe UK Office Furniture Industry Volume (K Unit), by Distribution Channel 2024 & 2032
- Figure 37: Europe UK Office Furniture Industry Revenue Share (%), by Distribution Channel 2024 & 2032
- Figure 38: Europe UK Office Furniture Industry Volume Share (%), by Distribution Channel 2024 & 2032
- Figure 39: Europe UK Office Furniture Industry Revenue (Million), by Country 2024 & 2032
- Figure 40: Europe UK Office Furniture Industry Volume (K Unit), by Country 2024 & 2032
- Figure 41: Europe UK Office Furniture Industry Revenue Share (%), by Country 2024 & 2032
- Figure 42: Europe UK Office Furniture Industry Volume Share (%), by Country 2024 & 2032
- Figure 43: Middle East & Africa UK Office Furniture Industry Revenue (Million), by Type 2024 & 2032
- Figure 44: Middle East & Africa UK Office Furniture Industry Volume (K Unit), by Type 2024 & 2032
- Figure 45: Middle East & Africa UK Office Furniture Industry Revenue Share (%), by Type 2024 & 2032
- Figure 46: Middle East & Africa UK Office Furniture Industry Volume Share (%), by Type 2024 & 2032
- Figure 47: Middle East & Africa UK Office Furniture Industry Revenue (Million), by Distribution Channel 2024 & 2032
- Figure 48: Middle East & Africa UK Office Furniture Industry Volume (K Unit), by Distribution Channel 2024 & 2032
- Figure 49: Middle East & Africa UK Office Furniture Industry Revenue Share (%), by Distribution Channel 2024 & 2032
- Figure 50: Middle East & Africa UK Office Furniture Industry Volume Share (%), by Distribution Channel 2024 & 2032
- Figure 51: Middle East & Africa UK Office Furniture Industry Revenue (Million), by Country 2024 & 2032
- Figure 52: Middle East & Africa UK Office Furniture Industry Volume (K Unit), by Country 2024 & 2032
- Figure 53: Middle East & Africa UK Office Furniture Industry Revenue Share (%), by Country 2024 & 2032
- Figure 54: Middle East & Africa UK Office Furniture Industry Volume Share (%), by Country 2024 & 2032
- Figure 55: Asia Pacific UK Office Furniture Industry Revenue (Million), by Type 2024 & 2032
- Figure 56: Asia Pacific UK Office Furniture Industry Volume (K Unit), by Type 2024 & 2032
- Figure 57: Asia Pacific UK Office Furniture Industry Revenue Share (%), by Type 2024 & 2032
- Figure 58: Asia Pacific UK Office Furniture Industry Volume Share (%), by Type 2024 & 2032
- Figure 59: Asia Pacific UK Office Furniture Industry Revenue (Million), by Distribution Channel 2024 & 2032
- Figure 60: Asia Pacific UK Office Furniture Industry Volume (K Unit), by Distribution Channel 2024 & 2032
- Figure 61: Asia Pacific UK Office Furniture Industry Revenue Share (%), by Distribution Channel 2024 & 2032
- Figure 62: Asia Pacific UK Office Furniture Industry Volume Share (%), by Distribution Channel 2024 & 2032
- Figure 63: Asia Pacific UK Office Furniture Industry Revenue (Million), by Country 2024 & 2032
- Figure 64: Asia Pacific UK Office Furniture Industry Volume (K Unit), by Country 2024 & 2032
- Figure 65: Asia Pacific UK Office Furniture Industry Revenue Share (%), by Country 2024 & 2032
- Figure 66: Asia Pacific UK Office Furniture Industry Volume Share (%), by Country 2024 & 2032
List of Tables
- Table 1: Global UK Office Furniture Industry Revenue Million Forecast, by Region 2019 & 2032
- Table 2: Global UK Office Furniture Industry Volume K Unit Forecast, by Region 2019 & 2032
- Table 3: Global UK Office Furniture Industry Revenue Million Forecast, by Type 2019 & 2032
- Table 4: Global UK Office Furniture Industry Volume K Unit Forecast, by Type 2019 & 2032
- Table 5: Global UK Office Furniture Industry Revenue Million Forecast, by Distribution Channel 2019 & 2032
- Table 6: Global UK Office Furniture Industry Volume K Unit Forecast, by Distribution Channel 2019 & 2032
- Table 7: Global UK Office Furniture Industry Revenue Million Forecast, by Region 2019 & 2032
- Table 8: Global UK Office Furniture Industry Volume K Unit Forecast, by Region 2019 & 2032
- Table 9: Global UK Office Furniture Industry Revenue Million Forecast, by Country 2019 & 2032
- Table 10: Global UK Office Furniture Industry Volume K Unit Forecast, by Country 2019 & 2032
- Table 11: England UK Office Furniture Industry Revenue (Million) Forecast, by Application 2019 & 2032
- Table 12: England UK Office Furniture Industry Volume (K Unit) Forecast, by Application 2019 & 2032
- Table 13: Wales UK Office Furniture Industry Revenue (Million) Forecast, by Application 2019 & 2032
- Table 14: Wales UK Office Furniture Industry Volume (K Unit) Forecast, by Application 2019 & 2032
- Table 15: Scotland UK Office Furniture Industry Revenue (Million) Forecast, by Application 2019 & 2032
- Table 16: Scotland UK Office Furniture Industry Volume (K Unit) Forecast, by Application 2019 & 2032
- Table 17: Northern UK Office Furniture Industry Revenue (Million) Forecast, by Application 2019 & 2032
- Table 18: Northern UK Office Furniture Industry Volume (K Unit) Forecast, by Application 2019 & 2032
- Table 19: Ireland UK Office Furniture Industry Revenue (Million) Forecast, by Application 2019 & 2032
- Table 20: Ireland UK Office Furniture Industry Volume (K Unit) Forecast, by Application 2019 & 2032
- Table 21: Global UK Office Furniture Industry Revenue Million Forecast, by Type 2019 & 2032
- Table 22: Global UK Office Furniture Industry Volume K Unit Forecast, by Type 2019 & 2032
- Table 23: Global UK Office Furniture Industry Revenue Million Forecast, by Distribution Channel 2019 & 2032
- Table 24: Global UK Office Furniture Industry Volume K Unit Forecast, by Distribution Channel 2019 & 2032
- Table 25: Global UK Office Furniture Industry Revenue Million Forecast, by Country 2019 & 2032
- Table 26: Global UK Office Furniture Industry Volume K Unit Forecast, by Country 2019 & 2032
- Table 27: United States UK Office Furniture Industry Revenue (Million) Forecast, by Application 2019 & 2032
- Table 28: United States UK Office Furniture Industry Volume (K Unit) Forecast, by Application 2019 & 2032
- Table 29: Canada UK Office Furniture Industry Revenue (Million) Forecast, by Application 2019 & 2032
- Table 30: Canada UK Office Furniture Industry Volume (K Unit) Forecast, by Application 2019 & 2032
- Table 31: Mexico UK Office Furniture Industry Revenue (Million) Forecast, by Application 2019 & 2032
- Table 32: Mexico UK Office Furniture Industry Volume (K Unit) Forecast, by Application 2019 & 2032
- Table 33: Global UK Office Furniture Industry Revenue Million Forecast, by Type 2019 & 2032
- Table 34: Global UK Office Furniture Industry Volume K Unit Forecast, by Type 2019 & 2032
- Table 35: Global UK Office Furniture Industry Revenue Million Forecast, by Distribution Channel 2019 & 2032
- Table 36: Global UK Office Furniture Industry Volume K Unit Forecast, by Distribution Channel 2019 & 2032
- Table 37: Global UK Office Furniture Industry Revenue Million Forecast, by Country 2019 & 2032
- Table 38: Global UK Office Furniture Industry Volume K Unit Forecast, by Country 2019 & 2032
- Table 39: Brazil UK Office Furniture Industry Revenue (Million) Forecast, by Application 2019 & 2032
- Table 40: Brazil UK Office Furniture Industry Volume (K Unit) Forecast, by Application 2019 & 2032
- Table 41: Argentina UK Office Furniture Industry Revenue (Million) Forecast, by Application 2019 & 2032
- Table 42: Argentina UK Office Furniture Industry Volume (K Unit) Forecast, by Application 2019 & 2032
- Table 43: Rest of South America UK Office Furniture Industry Revenue (Million) Forecast, by Application 2019 & 2032
- Table 44: Rest of South America UK Office Furniture Industry Volume (K Unit) Forecast, by Application 2019 & 2032
- Table 45: Global UK Office Furniture Industry Revenue Million Forecast, by Type 2019 & 2032
- Table 46: Global UK Office Furniture Industry Volume K Unit Forecast, by Type 2019 & 2032
- Table 47: Global UK Office Furniture Industry Revenue Million Forecast, by Distribution Channel 2019 & 2032
- Table 48: Global UK Office Furniture Industry Volume K Unit Forecast, by Distribution Channel 2019 & 2032
- Table 49: Global UK Office Furniture Industry Revenue Million Forecast, by Country 2019 & 2032
- Table 50: Global UK Office Furniture Industry Volume K Unit Forecast, by Country 2019 & 2032
- Table 51: United Kingdom UK Office Furniture Industry Revenue (Million) Forecast, by Application 2019 & 2032
- Table 52: United Kingdom UK Office Furniture Industry Volume (K Unit) Forecast, by Application 2019 & 2032
- Table 53: Germany UK Office Furniture Industry Revenue (Million) Forecast, by Application 2019 & 2032
- Table 54: Germany UK Office Furniture Industry Volume (K Unit) Forecast, by Application 2019 & 2032
- Table 55: France UK Office Furniture Industry Revenue (Million) Forecast, by Application 2019 & 2032
- Table 56: France UK Office Furniture Industry Volume (K Unit) Forecast, by Application 2019 & 2032
- Table 57: Italy UK Office Furniture Industry Revenue (Million) Forecast, by Application 2019 & 2032
- Table 58: Italy UK Office Furniture Industry Volume (K Unit) Forecast, by Application 2019 & 2032
- Table 59: Spain UK Office Furniture Industry Revenue (Million) Forecast, by Application 2019 & 2032
- Table 60: Spain UK Office Furniture Industry Volume (K Unit) Forecast, by Application 2019 & 2032
- Table 61: Russia UK Office Furniture Industry Revenue (Million) Forecast, by Application 2019 & 2032
- Table 62: Russia UK Office Furniture Industry Volume (K Unit) Forecast, by Application 2019 & 2032
- Table 63: Benelux UK Office Furniture Industry Revenue (Million) Forecast, by Application 2019 & 2032
- Table 64: Benelux UK Office Furniture Industry Volume (K Unit) Forecast, by Application 2019 & 2032
- Table 65: Nordics UK Office Furniture Industry Revenue (Million) Forecast, by Application 2019 & 2032
- Table 66: Nordics UK Office Furniture Industry Volume (K Unit) Forecast, by Application 2019 & 2032
- Table 67: Rest of Europe UK Office Furniture Industry Revenue (Million) Forecast, by Application 2019 & 2032
- Table 68: Rest of Europe UK Office Furniture Industry Volume (K Unit) Forecast, by Application 2019 & 2032
- Table 69: Global UK Office Furniture Industry Revenue Million Forecast, by Type 2019 & 2032
- Table 70: Global UK Office Furniture Industry Volume K Unit Forecast, by Type 2019 & 2032
- Table 71: Global UK Office Furniture Industry Revenue Million Forecast, by Distribution Channel 2019 & 2032
- Table 72: Global UK Office Furniture Industry Volume K Unit Forecast, by Distribution Channel 2019 & 2032
- Table 73: Global UK Office Furniture Industry Revenue Million Forecast, by Country 2019 & 2032
- Table 74: Global UK Office Furniture Industry Volume K Unit Forecast, by Country 2019 & 2032
- Table 75: Turkey UK Office Furniture Industry Revenue (Million) Forecast, by Application 2019 & 2032
- Table 76: Turkey UK Office Furniture Industry Volume (K Unit) Forecast, by Application 2019 & 2032
- Table 77: Israel UK Office Furniture Industry Revenue (Million) Forecast, by Application 2019 & 2032
- Table 78: Israel UK Office Furniture Industry Volume (K Unit) Forecast, by Application 2019 & 2032
- Table 79: GCC UK Office Furniture Industry Revenue (Million) Forecast, by Application 2019 & 2032
- Table 80: GCC UK Office Furniture Industry Volume (K Unit) Forecast, by Application 2019 & 2032
- Table 81: North Africa UK Office Furniture Industry Revenue (Million) Forecast, by Application 2019 & 2032
- Table 82: North Africa UK Office Furniture Industry Volume (K Unit) Forecast, by Application 2019 & 2032
- Table 83: South Africa UK Office Furniture Industry Revenue (Million) Forecast, by Application 2019 & 2032
- Table 84: South Africa UK Office Furniture Industry Volume (K Unit) Forecast, by Application 2019 & 2032
- Table 85: Rest of Middle East & Africa UK Office Furniture Industry Revenue (Million) Forecast, by Application 2019 & 2032
- Table 86: Rest of Middle East & Africa UK Office Furniture Industry Volume (K Unit) Forecast, by Application 2019 & 2032
- Table 87: Global UK Office Furniture Industry Revenue Million Forecast, by Type 2019 & 2032
- Table 88: Global UK Office Furniture Industry Volume K Unit Forecast, by Type 2019 & 2032
- Table 89: Global UK Office Furniture Industry Revenue Million Forecast, by Distribution Channel 2019 & 2032
- Table 90: Global UK Office Furniture Industry Volume K Unit Forecast, by Distribution Channel 2019 & 2032
- Table 91: Global UK Office Furniture Industry Revenue Million Forecast, by Country 2019 & 2032
- Table 92: Global UK Office Furniture Industry Volume K Unit Forecast, by Country 2019 & 2032
- Table 93: China UK Office Furniture Industry Revenue (Million) Forecast, by Application 2019 & 2032
- Table 94: China UK Office Furniture Industry Volume (K Unit) Forecast, by Application 2019 & 2032
- Table 95: India UK Office Furniture Industry Revenue (Million) Forecast, by Application 2019 & 2032
- Table 96: India UK Office Furniture Industry Volume (K Unit) Forecast, by Application 2019 & 2032
- Table 97: Japan UK Office Furniture Industry Revenue (Million) Forecast, by Application 2019 & 2032
- Table 98: Japan UK Office Furniture Industry Volume (K Unit) Forecast, by Application 2019 & 2032
- Table 99: South Korea UK Office Furniture Industry Revenue (Million) Forecast, by Application 2019 & 2032
- Table 100: South Korea UK Office Furniture Industry Volume (K Unit) Forecast, by Application 2019 & 2032
- Table 101: ASEAN UK Office Furniture Industry Revenue (Million) Forecast, by Application 2019 & 2032
- Table 102: ASEAN UK Office Furniture Industry Volume (K Unit) Forecast, by Application 2019 & 2032
- Table 103: Oceania UK Office Furniture Industry Revenue (Million) Forecast, by Application 2019 & 2032
- Table 104: Oceania UK Office Furniture Industry Volume (K Unit) Forecast, by Application 2019 & 2032
- Table 105: Rest of Asia Pacific UK Office Furniture Industry Revenue (Million) Forecast, by Application 2019 & 2032
- Table 106: Rest of Asia Pacific UK Office Furniture Industry Volume (K Unit) Forecast, by Application 2019 & 2032
Frequently Asked Questions
1. What is the projected Compound Annual Growth Rate (CAGR) of the UK Office Furniture Industry?
The projected CAGR is approximately 2.78%.
2. Which companies are prominent players in the UK Office Furniture Industry?
Key companies in the market include Tangent Office Furniture, SteelCase, Verve Workspace, Flexiform Office Furniture, Herman Miller, Verco Office Furniture, Lee & Plumpton, The Frem Group, Margolis Furniture, Knoll, Metric Office Furniture, HumanScale, Urban Office.
3. What are the main segments of the UK Office Furniture Industry?
The market segments include Type, Distribution Channel.
4. Can you provide details about the market size?
The market size is estimated to be USD 5.21 Million as of 2022.
5. What are some drivers contributing to market growth?
Tech-Integrated Furniture are Helping to Grow the Market.
6. What are the notable trends driving market growth?
Growing Flexible Office Spaces in the Country.
7. Are there any restraints impacting market growth?
Raw Material Cost Barrier to Growth.
8. Can you provide examples of recent developments in the market?
In 2022, Steelcase Inc. reported first-quarter revenue of USD 740.7 million, a net loss of USD 11.4 million, and an adjusted loss per share of USD 0.05. Steelcase Inc. acquired Halcon, a Minnesota-based designer and manufacturer of tailored wood furniture for the workplace, for USD 127.5 million in May 2022.
9. What pricing options are available for accessing the report?
Pricing options include single-user, multi-user, and enterprise licenses priced at USD 3800, USD 4500, and USD 5800 respectively.
10. Is the market size provided in terms of value or volume?
The market size is provided in terms of value, measured in Million and volume, measured in K Unit.
11. Are there any specific market keywords associated with the report?
Yes, the market keyword associated with the report is "UK Office Furniture Industry," which aids in identifying and referencing the specific market segment covered.
12. How do I determine which pricing option suits my needs best?
The pricing options vary based on user requirements and access needs. Individual users may opt for single-user licenses, while businesses requiring broader access may choose multi-user or enterprise licenses for cost-effective access to the report.
13. Are there any additional resources or data provided in the UK Office Furniture Industry report?
While the report offers comprehensive insights, it's advisable to review the specific contents or supplementary materials provided to ascertain if additional resources or data are available.
14. How can I stay updated on further developments or reports in the UK Office Furniture Industry?
To stay informed about further developments, trends, and reports in the UK Office Furniture Industry, consider subscribing to industry newsletters, following relevant companies and organizations, or regularly checking reputable industry news sources and publications.
Methodology
Step 1 - Identification of Relevant Samples Size from Population Database


Step 2 - Approaches for Defining Global Market Size (Value, Volume* & Price*)

Note*: In applicable scenarios
Step 3 - Data Sources
Primary Research
- Web Analytics
- Survey Reports
- Research Institute
- Latest Research Reports
- Opinion Leaders
Secondary Research
- Annual Reports
- White Paper
- Latest Press Release
- Industry Association
- Paid Database
- Investor Presentations

Step 4 - Data Triangulation
Involves using different sources of information in order to increase the validity of a study
These sources are likely to be stakeholders in a program - participants, other researchers, program staff, other community members, and so on.
Then we put all data in single framework & apply various statistical tools to find out the dynamic on the market.
During the analysis stage, feedback from the stakeholder groups would be compared to determine areas of agreement as well as areas of divergence


