
Key Insights
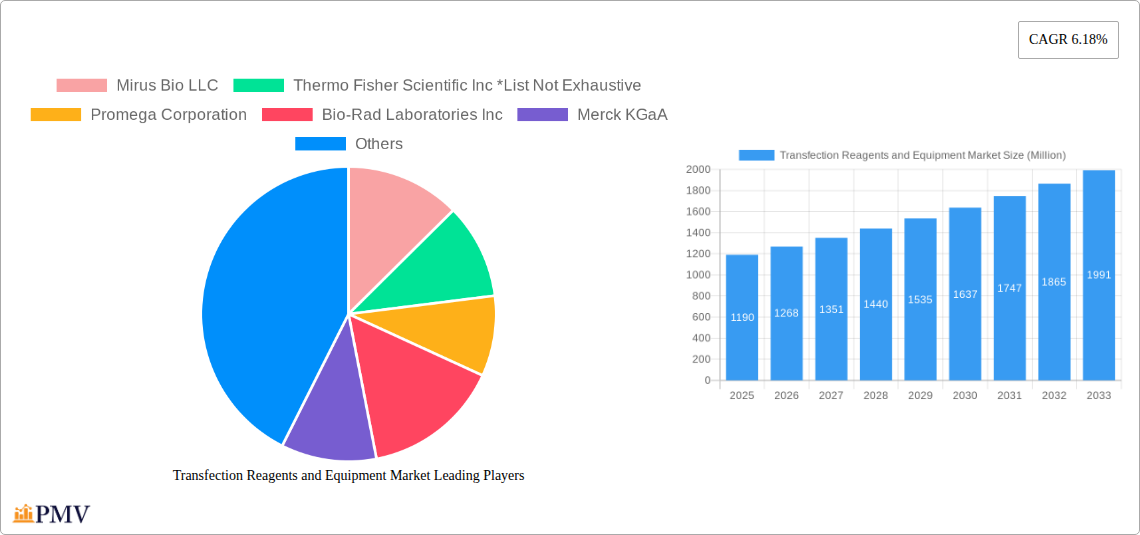
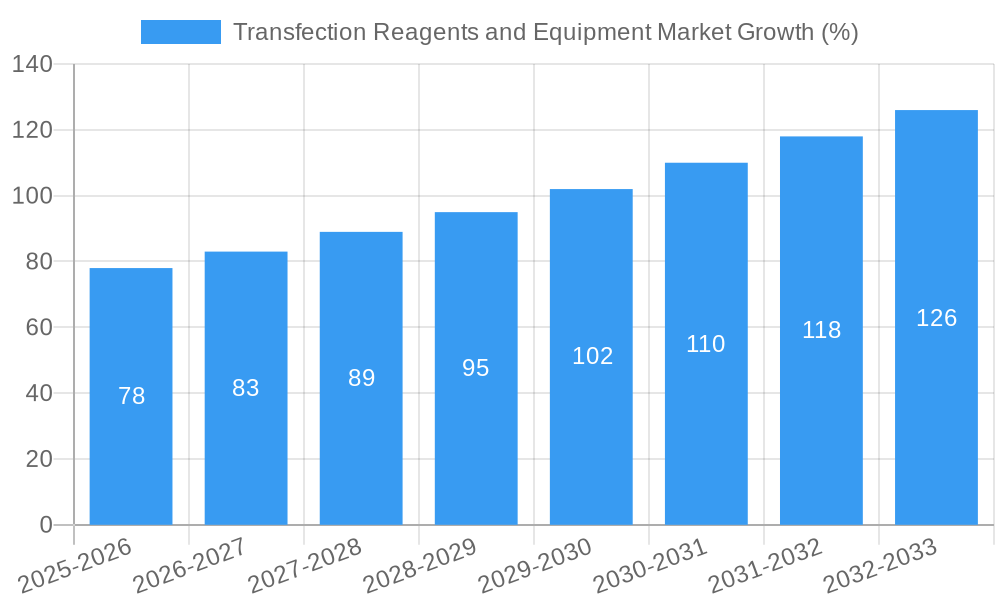
The global transfection reagents and equipment market, valued at $1.19 billion in 2025, is projected to experience robust growth, driven by the increasing demand for cell-based therapies, gene therapy advancements, and the rising prevalence of chronic diseases requiring innovative treatment approaches. The market's Compound Annual Growth Rate (CAGR) of 6.18% from 2025 to 2033 indicates a significant expansion, fueled by technological advancements in transfection techniques and the growing adoption of these methods in pharmaceutical and biotechnology research. This growth is further supported by the expanding academic and research sector actively involved in gene editing, drug discovery, and disease modeling, all of which rely heavily on efficient transfection methods. The market is segmented by product type (reagents and equipment), method (biochemical, physical, and viral), and end-user (pharmaceutical and biotechnology companies, academic and research institutes, and others). While reagents currently hold a larger market share, the equipment segment is expected to witness faster growth driven by the increasing need for automated and high-throughput transfection systems. Geographic expansion is also anticipated, with North America and Europe maintaining leading positions due to established research infrastructure and a strong pharmaceutical industry, but Asia Pacific is expected to exhibit substantial growth due to rising investment in biotechnology and a burgeoning research sector.
Competition in the market is intense, with key players like Thermo Fisher Scientific, Promega, and Qiagen constantly striving to innovate and improve the efficiency and effectiveness of transfection techniques. The market's growth trajectory is projected to remain positive, although challenges such as the high cost of reagents and specialized equipment, as well as the complexities associated with certain transfection methods, could potentially impede growth to some extent. However, ongoing research and development efforts aimed at overcoming these limitations, coupled with the burgeoning demand from downstream applications, are poised to drive market expansion in the coming years. The continued focus on personalized medicine and advanced therapeutic modalities will further fuel the demand for efficient and reliable transfection technologies, ensuring sustained market growth throughout the forecast period.
Transfection Reagents and Equipment Market: A Comprehensive Report (2019-2033)
This in-depth report provides a comprehensive analysis of the global Transfection Reagents and Equipment Market, offering valuable insights for stakeholders across the pharmaceutical, biotechnology, and academic research sectors. Covering the period from 2019 to 2033, with a focus on the 2025-2033 forecast, this report unveils market dynamics, competitive landscapes, and future growth trajectories. The study period is 2019-2033, the base year is 2025, the estimated year is 2025, and the forecast period is 2025-2033. The historical period covered is 2019-2024.
Transfection Reagents and Equipment Market Market Structure & Competitive Dynamics
The Transfection Reagents and Equipment market is characterized by a moderately concentrated landscape, with several major players holding significant market share. However, a vibrant ecosystem of smaller companies and startups is driving innovation and introducing novel transfection technologies. The market is subject to stringent regulatory frameworks, particularly regarding the safety and efficacy of reagents used in therapeutic applications. Product substitutes, primarily focused on alternative gene delivery methods, present a degree of competitive pressure. End-user trends, driven by advancements in gene therapy and personalized medicine, are pushing demand for more efficient and versatile transfection technologies. The market has witnessed several significant mergers and acquisitions (M&A) in recent years, with deal values ranging from xx Million to xx Million, reflecting the strategic importance of this sector. Key players are actively involved in strategic partnerships and collaborations to expand their product portfolios and geographic reach.
- Market Concentration: Moderately concentrated, with top 5 players holding approximately xx% of the market share.
- Innovation Ecosystems: Active, with both established companies and startups contributing to technological advancements.
- Regulatory Frameworks: Stringent, particularly concerning therapeutic applications.
- Product Substitutes: Alternative gene delivery methods are emerging, creating competitive pressure.
- M&A Activity: Significant activity observed in recent years, with deal values ranging from xx Million to xx Million.
- End-User Trends: Growing demand driven by advancements in gene therapy and personalized medicine.
Transfection Reagents and Equipment Market Industry Trends & Insights
The global Transfection Reagents and Equipment market is experiencing robust growth, driven primarily by the expanding applications of gene therapy and cell-based therapies. The increasing prevalence of chronic diseases and the growing demand for personalized medicine are further fueling market expansion. Technological advancements, such as the development of novel transfection reagents and equipment with improved efficiency and safety profiles, are contributing to market growth. Consumer preferences are shifting toward more convenient, cost-effective, and readily scalable transfection solutions. The competitive dynamics are marked by intense innovation, strategic partnerships, and a focus on product differentiation. The market is expected to witness a compound annual growth rate (CAGR) of xx% during the forecast period (2025-2033), with significant market penetration expected in emerging economies. The rising adoption of CRISPR-Cas9 gene editing technology is also a key driver. The market size is expected to reach xx Million by 2033.
Dominant Markets & Segments in Transfection Reagents and Equipment Market
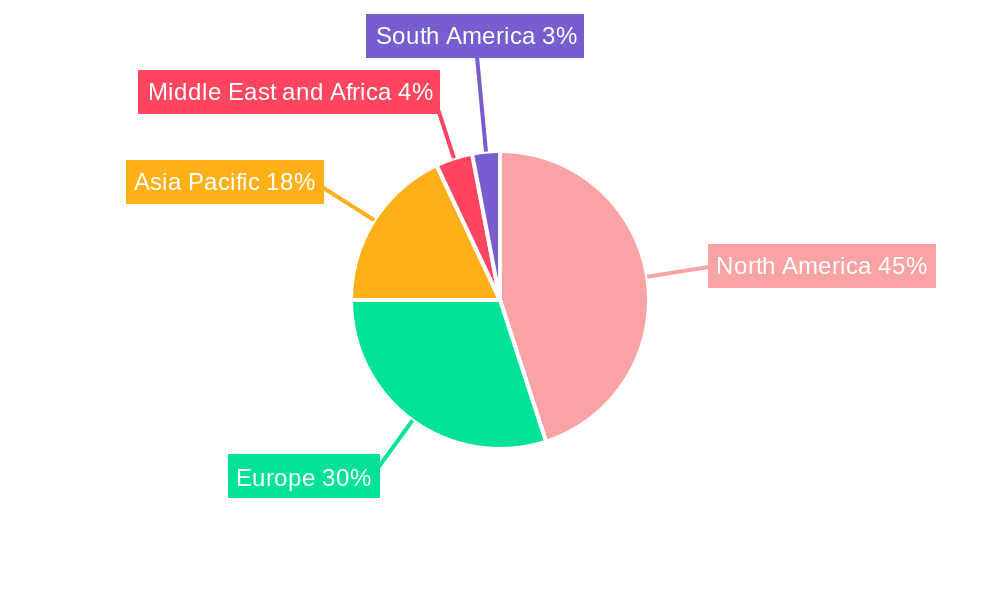
The North American region currently holds the largest market share in the Transfection Reagents and Equipment market, driven by robust pharmaceutical and biotechnology industries, significant research funding, and the early adoption of advanced technologies. Within this region, the United States is the dominant market. However, the Asia-Pacific region is exhibiting the fastest growth rate, propelled by increasing investments in life sciences research, expanding healthcare infrastructure, and a growing number of pharmaceutical and biotechnology companies.
- By Product: Reagents currently dominate the market, owing to their widespread use in various research and therapeutic applications. However, the equipment segment is projected to grow at a faster rate due to the increasing demand for automated and high-throughput transfection systems.
- By Method: Viral methods are currently leading the market, reflecting their high transfection efficiency in many applications, but biochemical and physical methods are experiencing significant growth, driven by technological advancements that improve efficacy and reduce costs.
- By End User: Pharmaceutical & Biotechnology Companies represent the largest end-user segment, due to the extensive use of transfection in drug discovery and development. However, Academics & Research Institutes are expected to grow at a significant rate due to an increase in funding for research projects.
Key Drivers for Dominant Regions:
- North America: Strong pharmaceutical and biotech industries, high research funding, early adoption of advanced technologies.
- Asia-Pacific: Increasing investments in life sciences, expanding healthcare infrastructure, growing number of pharma/biotech companies.
Transfection Reagents and Equipment Market Product Innovations
Recent years have witnessed significant innovations in transfection reagents and equipment. New reagents with enhanced transfection efficiency, reduced toxicity, and improved target specificity are being developed. Automated and high-throughput systems are streamlining the transfection process, increasing throughput and reducing costs. The integration of advanced technologies, such as microfluidics and nanotechnology, is leading to the development of novel transfection platforms with greater precision and control. These innovations are improving the efficacy and safety of gene therapy and cell-based therapies, contributing to the overall growth of the market.
Report Segmentation & Scope
This report segments the Transfection Reagents and Equipment market by product (Reagents and Equipment), method (Biochemical, Physical, and Viral), and end-user (Pharmaceutical & Biotechnology Companies, Academics & Research Institutes, and Others). Each segment is analyzed in detail, providing market size, growth projections, and competitive dynamics. For example, the reagents segment is expected to grow at a CAGR of xx% during the forecast period, while the equipment segment is expected to show a CAGR of xx%. The pharmaceutical and biotechnology companies segment will continue to dominate the end-user landscape. The viral method is expected to maintain its leading market position due to its high transfection efficiency.
Key Drivers of Transfection Reagents and Equipment Market Growth
The growth of the transfection reagents and equipment market is driven by several key factors: the expanding applications of gene therapy and cell-based therapies, the increasing prevalence of chronic diseases, the growing demand for personalized medicine, technological advancements, rising research funding in life sciences, and favorable regulatory environments in key markets. Government initiatives to support research and development in biotechnology further contribute to the market's growth. The rising adoption of CRISPR-Cas9 and other gene editing tools is also a significant driver.
Challenges in the Transfection Reagents and Equipment Market Sector
The transfection reagents and equipment market faces several challenges, including stringent regulatory hurdles for new products, potential supply chain disruptions affecting raw materials, intense competition from existing and emerging players, and the need for continuous innovation to address limitations of existing technologies. High development costs and the need for robust quality control measures also pose challenges. These factors may negatively impact market growth if not properly addressed.
Leading Players in the Transfection Reagents and Equipment Market Market
- Mirus Bio LLC
- Thermo Fisher Scientific Inc
- Promega Corporation
- Bio-Rad Laboratories Inc
- Merck KGaA
- Lonza Group
- Polyplus-transfection SA
- Qiagen NV
- MaxCyte Inc
Key Developments in Transfection Reagents and Equipment Market Sector
- September 2022: Polyplus launched in vivo-jetRNA+ transfection reagent for in vivo mRNA delivery using preformed liposome formulation.
- October 2022: Aragen Life Sciences (Aragen) launched its newly optimized RapTr 2022 cell line development (CLD) platform, offering a 33% reduction in CLD timelines and increased titers up to 6g/l.
Strategic Transfection Reagents and Equipment Market Market Outlook
The future of the Transfection Reagents and Equipment market appears promising, with continued growth driven by advancements in gene editing technologies, the rising adoption of personalized medicine, and increasing investments in life sciences research. Strategic partnerships and collaborations among industry players are anticipated to drive innovation and market expansion. Companies are focusing on developing more efficient, safer, and cost-effective transfection solutions to cater to the growing demand from various end-user segments. The market presents significant opportunities for companies that can leverage technological advancements and meet the evolving needs of researchers and clinicians.
Transfection Reagents and Equipment Market Segmentation
-
1. Product
- 1.1. Reagents
- 1.2. Equipment
-
2. Method
- 2.1. Biochemical Methods
- 2.2. Physical Methods
- 2.3. Viral Methods
-
3. End User
- 3.1. Pharmaceutical & Biotechnology Companies
- 3.2. Academics & Research Institutes
- 3.3. Others
Transfection Reagents and Equipment Market Segmentation By Geography
-
1. North America
- 1.1. United States
- 1.2. Canada
- 1.3. Mexico
-
2. Europe
- 2.1. Germany
- 2.2. United Kingdom
- 2.3. France
- 2.4. Italy
- 2.5. Spain
- 2.6. Rest of Europe
-
3. Asia Pacific
- 3.1. China
- 3.2. Japan
- 3.3. India
- 3.4. Australia
- 3.5. South Korea
- 3.6. Rest of Asia Pacific
-
4. Middle East and Africa
- 4.1. GCC
- 4.2. South Africa
- 4.3. Rest of Middle East and Africa
-
5. South America
- 5.1. Brazil
- 5.2. Argentina
- 5.3. Rest of South America
Transfection Reagents and Equipment Market REPORT HIGHLIGHTS
| Aspects | Details |
|---|---|
| Study Period | 2019-2033 |
| Base Year | 2024 |
| Estimated Year | 2025 |
| Forecast Period | 2025-2033 |
| Historical Period | 2019-2024 |
| Growth Rate | CAGR of 6.18% from 2019-2033 |
| Segmentation |
|
Table of Contents
- 1. Introduction
- 1.1. Research Scope
- 1.2. Market Segmentation
- 1.3. Research Methodology
- 1.4. Definitions and Assumptions
- 2. Executive Summary
- 2.1. Introduction
- 3. Market Dynamics
- 3.1. Introduction
- 3.2. Market Drivers
- 3.2.1. Technological Advancements in Transfection; Increase in R&D Expenditure and Research Activities by Pharmaceutical and Biotech Companies; Rise in Demand for Synthetic Genes
- 3.3. Market Restrains
- 3.3.1. High Cost of Transfection Reagents; Selective Effectiveness and Certain Limitations of Transfection Reagents
- 3.4. Market Trends
- 3.4.1. Pharmaceutical & Biotechnology Companies Segment is Expected to Hold a Significant Share in the Market Over the Forecast Period
- 4. Market Factor Analysis
- 4.1. Porters Five Forces
- 4.2. Supply/Value Chain
- 4.3. PESTEL analysis
- 4.4. Market Entropy
- 4.5. Patent/Trademark Analysis
- 5. Global Transfection Reagents and Equipment Market Analysis, Insights and Forecast, 2019-2031
- 5.1. Market Analysis, Insights and Forecast - by Product
- 5.1.1. Reagents
- 5.1.2. Equipment
- 5.2. Market Analysis, Insights and Forecast - by Method
- 5.2.1. Biochemical Methods
- 5.2.2. Physical Methods
- 5.2.3. Viral Methods
- 5.3. Market Analysis, Insights and Forecast - by End User
- 5.3.1. Pharmaceutical & Biotechnology Companies
- 5.3.2. Academics & Research Institutes
- 5.3.3. Others
- 5.4. Market Analysis, Insights and Forecast - by Region
- 5.4.1. North America
- 5.4.2. Europe
- 5.4.3. Asia Pacific
- 5.4.4. Middle East and Africa
- 5.4.5. South America
- 5.1. Market Analysis, Insights and Forecast - by Product
- 6. North America Transfection Reagents and Equipment Market Analysis, Insights and Forecast, 2019-2031
- 6.1. Market Analysis, Insights and Forecast - by Product
- 6.1.1. Reagents
- 6.1.2. Equipment
- 6.2. Market Analysis, Insights and Forecast - by Method
- 6.2.1. Biochemical Methods
- 6.2.2. Physical Methods
- 6.2.3. Viral Methods
- 6.3. Market Analysis, Insights and Forecast - by End User
- 6.3.1. Pharmaceutical & Biotechnology Companies
- 6.3.2. Academics & Research Institutes
- 6.3.3. Others
- 6.1. Market Analysis, Insights and Forecast - by Product
- 7. Europe Transfection Reagents and Equipment Market Analysis, Insights and Forecast, 2019-2031
- 7.1. Market Analysis, Insights and Forecast - by Product
- 7.1.1. Reagents
- 7.1.2. Equipment
- 7.2. Market Analysis, Insights and Forecast - by Method
- 7.2.1. Biochemical Methods
- 7.2.2. Physical Methods
- 7.2.3. Viral Methods
- 7.3. Market Analysis, Insights and Forecast - by End User
- 7.3.1. Pharmaceutical & Biotechnology Companies
- 7.3.2. Academics & Research Institutes
- 7.3.3. Others
- 7.1. Market Analysis, Insights and Forecast - by Product
- 8. Asia Pacific Transfection Reagents and Equipment Market Analysis, Insights and Forecast, 2019-2031
- 8.1. Market Analysis, Insights and Forecast - by Product
- 8.1.1. Reagents
- 8.1.2. Equipment
- 8.2. Market Analysis, Insights and Forecast - by Method
- 8.2.1. Biochemical Methods
- 8.2.2. Physical Methods
- 8.2.3. Viral Methods
- 8.3. Market Analysis, Insights and Forecast - by End User
- 8.3.1. Pharmaceutical & Biotechnology Companies
- 8.3.2. Academics & Research Institutes
- 8.3.3. Others
- 8.1. Market Analysis, Insights and Forecast - by Product
- 9. Middle East and Africa Transfection Reagents and Equipment Market Analysis, Insights and Forecast, 2019-2031
- 9.1. Market Analysis, Insights and Forecast - by Product
- 9.1.1. Reagents
- 9.1.2. Equipment
- 9.2. Market Analysis, Insights and Forecast - by Method
- 9.2.1. Biochemical Methods
- 9.2.2. Physical Methods
- 9.2.3. Viral Methods
- 9.3. Market Analysis, Insights and Forecast - by End User
- 9.3.1. Pharmaceutical & Biotechnology Companies
- 9.3.2. Academics & Research Institutes
- 9.3.3. Others
- 9.1. Market Analysis, Insights and Forecast - by Product
- 10. South America Transfection Reagents and Equipment Market Analysis, Insights and Forecast, 2019-2031
- 10.1. Market Analysis, Insights and Forecast - by Product
- 10.1.1. Reagents
- 10.1.2. Equipment
- 10.2. Market Analysis, Insights and Forecast - by Method
- 10.2.1. Biochemical Methods
- 10.2.2. Physical Methods
- 10.2.3. Viral Methods
- 10.3. Market Analysis, Insights and Forecast - by End User
- 10.3.1. Pharmaceutical & Biotechnology Companies
- 10.3.2. Academics & Research Institutes
- 10.3.3. Others
- 10.1. Market Analysis, Insights and Forecast - by Product
- 11. North America Transfection Reagents and Equipment Market Analysis, Insights and Forecast, 2019-2031
- 11.1. Market Analysis, Insights and Forecast - By Country/Sub-region
- 11.1.1 United States
- 11.1.2 Canada
- 11.1.3 Mexico
- 12. Europe Transfection Reagents and Equipment Market Analysis, Insights and Forecast, 2019-2031
- 12.1. Market Analysis, Insights and Forecast - By Country/Sub-region
- 12.1.1 Germany
- 12.1.2 United Kingdom
- 12.1.3 France
- 12.1.4 Italy
- 12.1.5 Spain
- 12.1.6 Rest of Europe
- 13. Asia Pacific Transfection Reagents and Equipment Market Analysis, Insights and Forecast, 2019-2031
- 13.1. Market Analysis, Insights and Forecast - By Country/Sub-region
- 13.1.1 China
- 13.1.2 Japan
- 13.1.3 India
- 13.1.4 Australia
- 13.1.5 South Korea
- 13.1.6 Rest of Asia Pacific
- 14. Middle East and Africa Transfection Reagents and Equipment Market Analysis, Insights and Forecast, 2019-2031
- 14.1. Market Analysis, Insights and Forecast - By Country/Sub-region
- 14.1.1 GCC
- 14.1.2 South Africa
- 14.1.3 Rest of Middle East and Africa
- 15. South America Transfection Reagents and Equipment Market Analysis, Insights and Forecast, 2019-2031
- 15.1. Market Analysis, Insights and Forecast - By Country/Sub-region
- 15.1.1 Brazil
- 15.1.2 Argentina
- 15.1.3 Rest of South America
- 16. Competitive Analysis
- 16.1. Global Market Share Analysis 2024
- 16.2. Company Profiles
- 16.2.1 Mirus Bio LLC
- 16.2.1.1. Overview
- 16.2.1.2. Products
- 16.2.1.3. SWOT Analysis
- 16.2.1.4. Recent Developments
- 16.2.1.5. Financials (Based on Availability)
- 16.2.2 Thermo Fisher Scientific Inc *List Not Exhaustive
- 16.2.2.1. Overview
- 16.2.2.2. Products
- 16.2.2.3. SWOT Analysis
- 16.2.2.4. Recent Developments
- 16.2.2.5. Financials (Based on Availability)
- 16.2.3 Promega Corporation
- 16.2.3.1. Overview
- 16.2.3.2. Products
- 16.2.3.3. SWOT Analysis
- 16.2.3.4. Recent Developments
- 16.2.3.5. Financials (Based on Availability)
- 16.2.4 Bio-Rad Laboratories Inc
- 16.2.4.1. Overview
- 16.2.4.2. Products
- 16.2.4.3. SWOT Analysis
- 16.2.4.4. Recent Developments
- 16.2.4.5. Financials (Based on Availability)
- 16.2.5 Merck KGaA
- 16.2.5.1. Overview
- 16.2.5.2. Products
- 16.2.5.3. SWOT Analysis
- 16.2.5.4. Recent Developments
- 16.2.5.5. Financials (Based on Availability)
- 16.2.6 Lonza Group
- 16.2.6.1. Overview
- 16.2.6.2. Products
- 16.2.6.3. SWOT Analysis
- 16.2.6.4. Recent Developments
- 16.2.6.5. Financials (Based on Availability)
- 16.2.7 Polyplus-transfection SA
- 16.2.7.1. Overview
- 16.2.7.2. Products
- 16.2.7.3. SWOT Analysis
- 16.2.7.4. Recent Developments
- 16.2.7.5. Financials (Based on Availability)
- 16.2.8 Qiagen NV
- 16.2.8.1. Overview
- 16.2.8.2. Products
- 16.2.8.3. SWOT Analysis
- 16.2.8.4. Recent Developments
- 16.2.8.5. Financials (Based on Availability)
- 16.2.9 MaxCyte Inc
- 16.2.9.1. Overview
- 16.2.9.2. Products
- 16.2.9.3. SWOT Analysis
- 16.2.9.4. Recent Developments
- 16.2.9.5. Financials (Based on Availability)
- 16.2.1 Mirus Bio LLC
List of Figures
- Figure 1: Global Transfection Reagents and Equipment Market Revenue Breakdown (Million, %) by Region 2024 & 2032
- Figure 2: North America Transfection Reagents and Equipment Market Revenue (Million), by Country 2024 & 2032
- Figure 3: North America Transfection Reagents and Equipment Market Revenue Share (%), by Country 2024 & 2032
- Figure 4: Europe Transfection Reagents and Equipment Market Revenue (Million), by Country 2024 & 2032
- Figure 5: Europe Transfection Reagents and Equipment Market Revenue Share (%), by Country 2024 & 2032
- Figure 6: Asia Pacific Transfection Reagents and Equipment Market Revenue (Million), by Country 2024 & 2032
- Figure 7: Asia Pacific Transfection Reagents and Equipment Market Revenue Share (%), by Country 2024 & 2032
- Figure 8: Middle East and Africa Transfection Reagents and Equipment Market Revenue (Million), by Country 2024 & 2032
- Figure 9: Middle East and Africa Transfection Reagents and Equipment Market Revenue Share (%), by Country 2024 & 2032
- Figure 10: South America Transfection Reagents and Equipment Market Revenue (Million), by Country 2024 & 2032
- Figure 11: South America Transfection Reagents and Equipment Market Revenue Share (%), by Country 2024 & 2032
- Figure 12: North America Transfection Reagents and Equipment Market Revenue (Million), by Product 2024 & 2032
- Figure 13: North America Transfection Reagents and Equipment Market Revenue Share (%), by Product 2024 & 2032
- Figure 14: North America Transfection Reagents and Equipment Market Revenue (Million), by Method 2024 & 2032
- Figure 15: North America Transfection Reagents and Equipment Market Revenue Share (%), by Method 2024 & 2032
- Figure 16: North America Transfection Reagents and Equipment Market Revenue (Million), by End User 2024 & 2032
- Figure 17: North America Transfection Reagents and Equipment Market Revenue Share (%), by End User 2024 & 2032
- Figure 18: North America Transfection Reagents and Equipment Market Revenue (Million), by Country 2024 & 2032
- Figure 19: North America Transfection Reagents and Equipment Market Revenue Share (%), by Country 2024 & 2032
- Figure 20: Europe Transfection Reagents and Equipment Market Revenue (Million), by Product 2024 & 2032
- Figure 21: Europe Transfection Reagents and Equipment Market Revenue Share (%), by Product 2024 & 2032
- Figure 22: Europe Transfection Reagents and Equipment Market Revenue (Million), by Method 2024 & 2032
- Figure 23: Europe Transfection Reagents and Equipment Market Revenue Share (%), by Method 2024 & 2032
- Figure 24: Europe Transfection Reagents and Equipment Market Revenue (Million), by End User 2024 & 2032
- Figure 25: Europe Transfection Reagents and Equipment Market Revenue Share (%), by End User 2024 & 2032
- Figure 26: Europe Transfection Reagents and Equipment Market Revenue (Million), by Country 2024 & 2032
- Figure 27: Europe Transfection Reagents and Equipment Market Revenue Share (%), by Country 2024 & 2032
- Figure 28: Asia Pacific Transfection Reagents and Equipment Market Revenue (Million), by Product 2024 & 2032
- Figure 29: Asia Pacific Transfection Reagents and Equipment Market Revenue Share (%), by Product 2024 & 2032
- Figure 30: Asia Pacific Transfection Reagents and Equipment Market Revenue (Million), by Method 2024 & 2032
- Figure 31: Asia Pacific Transfection Reagents and Equipment Market Revenue Share (%), by Method 2024 & 2032
- Figure 32: Asia Pacific Transfection Reagents and Equipment Market Revenue (Million), by End User 2024 & 2032
- Figure 33: Asia Pacific Transfection Reagents and Equipment Market Revenue Share (%), by End User 2024 & 2032
- Figure 34: Asia Pacific Transfection Reagents and Equipment Market Revenue (Million), by Country 2024 & 2032
- Figure 35: Asia Pacific Transfection Reagents and Equipment Market Revenue Share (%), by Country 2024 & 2032
- Figure 36: Middle East and Africa Transfection Reagents and Equipment Market Revenue (Million), by Product 2024 & 2032
- Figure 37: Middle East and Africa Transfection Reagents and Equipment Market Revenue Share (%), by Product 2024 & 2032
- Figure 38: Middle East and Africa Transfection Reagents and Equipment Market Revenue (Million), by Method 2024 & 2032
- Figure 39: Middle East and Africa Transfection Reagents and Equipment Market Revenue Share (%), by Method 2024 & 2032
- Figure 40: Middle East and Africa Transfection Reagents and Equipment Market Revenue (Million), by End User 2024 & 2032
- Figure 41: Middle East and Africa Transfection Reagents and Equipment Market Revenue Share (%), by End User 2024 & 2032
- Figure 42: Middle East and Africa Transfection Reagents and Equipment Market Revenue (Million), by Country 2024 & 2032
- Figure 43: Middle East and Africa Transfection Reagents and Equipment Market Revenue Share (%), by Country 2024 & 2032
- Figure 44: South America Transfection Reagents and Equipment Market Revenue (Million), by Product 2024 & 2032
- Figure 45: South America Transfection Reagents and Equipment Market Revenue Share (%), by Product 2024 & 2032
- Figure 46: South America Transfection Reagents and Equipment Market Revenue (Million), by Method 2024 & 2032
- Figure 47: South America Transfection Reagents and Equipment Market Revenue Share (%), by Method 2024 & 2032
- Figure 48: South America Transfection Reagents and Equipment Market Revenue (Million), by End User 2024 & 2032
- Figure 49: South America Transfection Reagents and Equipment Market Revenue Share (%), by End User 2024 & 2032
- Figure 50: South America Transfection Reagents and Equipment Market Revenue (Million), by Country 2024 & 2032
- Figure 51: South America Transfection Reagents and Equipment Market Revenue Share (%), by Country 2024 & 2032
List of Tables
- Table 1: Global Transfection Reagents and Equipment Market Revenue Million Forecast, by Region 2019 & 2032
- Table 2: Global Transfection Reagents and Equipment Market Revenue Million Forecast, by Product 2019 & 2032
- Table 3: Global Transfection Reagents and Equipment Market Revenue Million Forecast, by Method 2019 & 2032
- Table 4: Global Transfection Reagents and Equipment Market Revenue Million Forecast, by End User 2019 & 2032
- Table 5: Global Transfection Reagents and Equipment Market Revenue Million Forecast, by Region 2019 & 2032
- Table 6: Global Transfection Reagents and Equipment Market Revenue Million Forecast, by Country 2019 & 2032
- Table 7: United States Transfection Reagents and Equipment Market Revenue (Million) Forecast, by Application 2019 & 2032
- Table 8: Canada Transfection Reagents and Equipment Market Revenue (Million) Forecast, by Application 2019 & 2032
- Table 9: Mexico Transfection Reagents and Equipment Market Revenue (Million) Forecast, by Application 2019 & 2032
- Table 10: Global Transfection Reagents and Equipment Market Revenue Million Forecast, by Country 2019 & 2032
- Table 11: Germany Transfection Reagents and Equipment Market Revenue (Million) Forecast, by Application 2019 & 2032
- Table 12: United Kingdom Transfection Reagents and Equipment Market Revenue (Million) Forecast, by Application 2019 & 2032
- Table 13: France Transfection Reagents and Equipment Market Revenue (Million) Forecast, by Application 2019 & 2032
- Table 14: Italy Transfection Reagents and Equipment Market Revenue (Million) Forecast, by Application 2019 & 2032
- Table 15: Spain Transfection Reagents and Equipment Market Revenue (Million) Forecast, by Application 2019 & 2032
- Table 16: Rest of Europe Transfection Reagents and Equipment Market Revenue (Million) Forecast, by Application 2019 & 2032
- Table 17: Global Transfection Reagents and Equipment Market Revenue Million Forecast, by Country 2019 & 2032
- Table 18: China Transfection Reagents and Equipment Market Revenue (Million) Forecast, by Application 2019 & 2032
- Table 19: Japan Transfection Reagents and Equipment Market Revenue (Million) Forecast, by Application 2019 & 2032
- Table 20: India Transfection Reagents and Equipment Market Revenue (Million) Forecast, by Application 2019 & 2032
- Table 21: Australia Transfection Reagents and Equipment Market Revenue (Million) Forecast, by Application 2019 & 2032
- Table 22: South Korea Transfection Reagents and Equipment Market Revenue (Million) Forecast, by Application 2019 & 2032
- Table 23: Rest of Asia Pacific Transfection Reagents and Equipment Market Revenue (Million) Forecast, by Application 2019 & 2032
- Table 24: Global Transfection Reagents and Equipment Market Revenue Million Forecast, by Country 2019 & 2032
- Table 25: GCC Transfection Reagents and Equipment Market Revenue (Million) Forecast, by Application 2019 & 2032
- Table 26: South Africa Transfection Reagents and Equipment Market Revenue (Million) Forecast, by Application 2019 & 2032
- Table 27: Rest of Middle East and Africa Transfection Reagents and Equipment Market Revenue (Million) Forecast, by Application 2019 & 2032
- Table 28: Global Transfection Reagents and Equipment Market Revenue Million Forecast, by Country 2019 & 2032
- Table 29: Brazil Transfection Reagents and Equipment Market Revenue (Million) Forecast, by Application 2019 & 2032
- Table 30: Argentina Transfection Reagents and Equipment Market Revenue (Million) Forecast, by Application 2019 & 2032
- Table 31: Rest of South America Transfection Reagents and Equipment Market Revenue (Million) Forecast, by Application 2019 & 2032
- Table 32: Global Transfection Reagents and Equipment Market Revenue Million Forecast, by Product 2019 & 2032
- Table 33: Global Transfection Reagents and Equipment Market Revenue Million Forecast, by Method 2019 & 2032
- Table 34: Global Transfection Reagents and Equipment Market Revenue Million Forecast, by End User 2019 & 2032
- Table 35: Global Transfection Reagents and Equipment Market Revenue Million Forecast, by Country 2019 & 2032
- Table 36: United States Transfection Reagents and Equipment Market Revenue (Million) Forecast, by Application 2019 & 2032
- Table 37: Canada Transfection Reagents and Equipment Market Revenue (Million) Forecast, by Application 2019 & 2032
- Table 38: Mexico Transfection Reagents and Equipment Market Revenue (Million) Forecast, by Application 2019 & 2032
- Table 39: Global Transfection Reagents and Equipment Market Revenue Million Forecast, by Product 2019 & 2032
- Table 40: Global Transfection Reagents and Equipment Market Revenue Million Forecast, by Method 2019 & 2032
- Table 41: Global Transfection Reagents and Equipment Market Revenue Million Forecast, by End User 2019 & 2032
- Table 42: Global Transfection Reagents and Equipment Market Revenue Million Forecast, by Country 2019 & 2032
- Table 43: Germany Transfection Reagents and Equipment Market Revenue (Million) Forecast, by Application 2019 & 2032
- Table 44: United Kingdom Transfection Reagents and Equipment Market Revenue (Million) Forecast, by Application 2019 & 2032
- Table 45: France Transfection Reagents and Equipment Market Revenue (Million) Forecast, by Application 2019 & 2032
- Table 46: Italy Transfection Reagents and Equipment Market Revenue (Million) Forecast, by Application 2019 & 2032
- Table 47: Spain Transfection Reagents and Equipment Market Revenue (Million) Forecast, by Application 2019 & 2032
- Table 48: Rest of Europe Transfection Reagents and Equipment Market Revenue (Million) Forecast, by Application 2019 & 2032
- Table 49: Global Transfection Reagents and Equipment Market Revenue Million Forecast, by Product 2019 & 2032
- Table 50: Global Transfection Reagents and Equipment Market Revenue Million Forecast, by Method 2019 & 2032
- Table 51: Global Transfection Reagents and Equipment Market Revenue Million Forecast, by End User 2019 & 2032
- Table 52: Global Transfection Reagents and Equipment Market Revenue Million Forecast, by Country 2019 & 2032
- Table 53: China Transfection Reagents and Equipment Market Revenue (Million) Forecast, by Application 2019 & 2032
- Table 54: Japan Transfection Reagents and Equipment Market Revenue (Million) Forecast, by Application 2019 & 2032
- Table 55: India Transfection Reagents and Equipment Market Revenue (Million) Forecast, by Application 2019 & 2032
- Table 56: Australia Transfection Reagents and Equipment Market Revenue (Million) Forecast, by Application 2019 & 2032
- Table 57: South Korea Transfection Reagents and Equipment Market Revenue (Million) Forecast, by Application 2019 & 2032
- Table 58: Rest of Asia Pacific Transfection Reagents and Equipment Market Revenue (Million) Forecast, by Application 2019 & 2032
- Table 59: Global Transfection Reagents and Equipment Market Revenue Million Forecast, by Product 2019 & 2032
- Table 60: Global Transfection Reagents and Equipment Market Revenue Million Forecast, by Method 2019 & 2032
- Table 61: Global Transfection Reagents and Equipment Market Revenue Million Forecast, by End User 2019 & 2032
- Table 62: Global Transfection Reagents and Equipment Market Revenue Million Forecast, by Country 2019 & 2032
- Table 63: GCC Transfection Reagents and Equipment Market Revenue (Million) Forecast, by Application 2019 & 2032
- Table 64: South Africa Transfection Reagents and Equipment Market Revenue (Million) Forecast, by Application 2019 & 2032
- Table 65: Rest of Middle East and Africa Transfection Reagents and Equipment Market Revenue (Million) Forecast, by Application 2019 & 2032
- Table 66: Global Transfection Reagents and Equipment Market Revenue Million Forecast, by Product 2019 & 2032
- Table 67: Global Transfection Reagents and Equipment Market Revenue Million Forecast, by Method 2019 & 2032
- Table 68: Global Transfection Reagents and Equipment Market Revenue Million Forecast, by End User 2019 & 2032
- Table 69: Global Transfection Reagents and Equipment Market Revenue Million Forecast, by Country 2019 & 2032
- Table 70: Brazil Transfection Reagents and Equipment Market Revenue (Million) Forecast, by Application 2019 & 2032
- Table 71: Argentina Transfection Reagents and Equipment Market Revenue (Million) Forecast, by Application 2019 & 2032
- Table 72: Rest of South America Transfection Reagents and Equipment Market Revenue (Million) Forecast, by Application 2019 & 2032
Frequently Asked Questions
1. What is the projected Compound Annual Growth Rate (CAGR) of the Transfection Reagents and Equipment Market?
The projected CAGR is approximately 6.18%.
2. Which companies are prominent players in the Transfection Reagents and Equipment Market?
Key companies in the market include Mirus Bio LLC, Thermo Fisher Scientific Inc *List Not Exhaustive, Promega Corporation, Bio-Rad Laboratories Inc, Merck KGaA, Lonza Group, Polyplus-transfection SA, Qiagen NV, MaxCyte Inc.
3. What are the main segments of the Transfection Reagents and Equipment Market?
The market segments include Product, Method, End User.
4. Can you provide details about the market size?
The market size is estimated to be USD 1.19 Million as of 2022.
5. What are some drivers contributing to market growth?
Technological Advancements in Transfection; Increase in R&D Expenditure and Research Activities by Pharmaceutical and Biotech Companies; Rise in Demand for Synthetic Genes.
6. What are the notable trends driving market growth?
Pharmaceutical & Biotechnology Companies Segment is Expected to Hold a Significant Share in the Market Over the Forecast Period.
7. Are there any restraints impacting market growth?
High Cost of Transfection Reagents; Selective Effectiveness and Certain Limitations of Transfection Reagents.
8. Can you provide examples of recent developments in the market?
In October 2022, Aragen Life Sciences (Aragen) launched its newly optimized RapTr 2022 cell line development (CLD) platform. The RapTr2022 offers a 33% reduction in CLD timelines and delivers increased titers up to 6g/l. This royalty-free platform accelerates the process of cell line engineering from DNA transfection in the host cell lines to Research Cell Bank (RCB) within 18 weeks.
9. What pricing options are available for accessing the report?
Pricing options include single-user, multi-user, and enterprise licenses priced at USD 4750, USD 5250, and USD 8750 respectively.
10. Is the market size provided in terms of value or volume?
The market size is provided in terms of value, measured in Million.
11. Are there any specific market keywords associated with the report?
Yes, the market keyword associated with the report is "Transfection Reagents and Equipment Market," which aids in identifying and referencing the specific market segment covered.
12. How do I determine which pricing option suits my needs best?
The pricing options vary based on user requirements and access needs. Individual users may opt for single-user licenses, while businesses requiring broader access may choose multi-user or enterprise licenses for cost-effective access to the report.
13. Are there any additional resources or data provided in the Transfection Reagents and Equipment Market report?
While the report offers comprehensive insights, it's advisable to review the specific contents or supplementary materials provided to ascertain if additional resources or data are available.
14. How can I stay updated on further developments or reports in the Transfection Reagents and Equipment Market?
To stay informed about further developments, trends, and reports in the Transfection Reagents and Equipment Market, consider subscribing to industry newsletters, following relevant companies and organizations, or regularly checking reputable industry news sources and publications.
Methodology
Step 1 - Identification of Relevant Samples Size from Population Database


Step 2 - Approaches for Defining Global Market Size (Value, Volume* & Price*)

Note*: In applicable scenarios
Step 3 - Data Sources
Primary Research
- Web Analytics
- Survey Reports
- Research Institute
- Latest Research Reports
- Opinion Leaders
Secondary Research
- Annual Reports
- White Paper
- Latest Press Release
- Industry Association
- Paid Database
- Investor Presentations

Step 4 - Data Triangulation
Involves using different sources of information in order to increase the validity of a study
These sources are likely to be stakeholders in a program - participants, other researchers, program staff, other community members, and so on.
Then we put all data in single framework & apply various statistical tools to find out the dynamic on the market.
During the analysis stage, feedback from the stakeholder groups would be compared to determine areas of agreement as well as areas of divergence


