
Key Insights
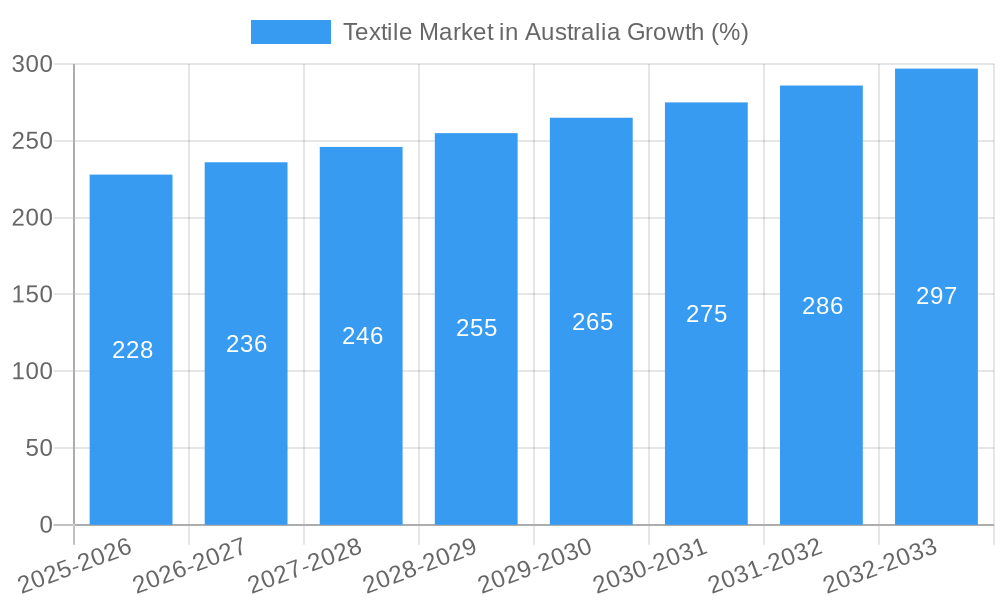
The Australian textile market, valued at approximately $5 billion AUD in 2025, is projected to experience steady growth, with a compound annual growth rate (CAGR) of 4.56% from 2025 to 2033. This growth is driven by several key factors. Increasing disposable incomes and a rising preference for comfortable and aesthetically pleasing home furnishings are bolstering demand across various segments, including bed linen, bath linen, kitchen textiles, and upholstery. The growing popularity of online shopping channels provides convenient access to a wider range of products, further stimulating market expansion. Furthermore, the increasing focus on sustainable and ethically sourced textiles is influencing consumer choices, creating opportunities for brands prioritizing eco-friendly practices. However, the market faces challenges such as fluctuating raw material prices and intense competition from both domestic and international players. The dominance of established players like Inditex, Harvey Norman, and IKEA necessitates strategic differentiation for smaller businesses. Future growth will likely be driven by innovative product development, leveraging e-commerce platforms, and focusing on premium, sustainable, and ethically produced textiles.
The market segmentation reveals a diverse landscape. While supermarkets and hypermarkets remain significant distribution channels, the online segment is experiencing rapid growth, reflecting changing consumer behavior. Product-wise, bed linen and bath linen consistently hold significant market shares, with kitchen linen and upholstery witnessing increasing demand fueled by home renovation trends. The strong presence of both international giants and established Australian brands indicates a mature market characterized by both price competition and brand loyalty. Understanding consumer preferences for specific product types, coupled with effective online marketing strategies, will be crucial for success in this dynamic market. Growth strategies should include adapting to evolving consumer needs, embracing sustainable practices, and effectively utilizing digital marketing channels to reach a wider customer base.

Textile Market in Australia: A Comprehensive Market Report (2019-2033)
This detailed report provides a comprehensive analysis of the Australian textile market, covering the period 2019-2033, with a focus on 2025. It offers invaluable insights into market structure, competitive dynamics, industry trends, leading players, and future growth potential, making it an essential resource for businesses operating in or planning to enter this dynamic sector. The report uses data from the historical period (2019-2024), the base year (2025), and forecasts for the period 2025-2033.
Textile Market in Australia: Market Structure & Competitive Dynamics
The Australian textile market exhibits a moderately concentrated structure, with several large multinational players like Inditex, Hennes & Mauritz AB (H&M), and IKEA competing alongside significant domestic players such as Forty Winks Pty Ltd and Harvey Norman Holdings Ltd. Smaller specialist brands like Lorraine Lea and Pure Linen cater to niche market segments. Market share is dynamic, influenced by factors such as brand recognition, product innovation, and distribution network strength. The estimated market size in 2025 is approximately xx Million, with a projected CAGR of xx% during the forecast period.
Innovation in the Australian textile market is driven by a blend of international and domestic players. While larger companies often lead in technological advancements in manufacturing and supply chain management, smaller businesses show agility in product design and niche market targeting. The regulatory framework includes standards concerning product safety, labeling, and sustainability, impacting manufacturing and marketing practices. Product substitutes, such as synthetic materials and recycled fibers, are increasingly prominent, impacting traditional textile materials' market share. End-user trends favor sustainable and ethically sourced products, creating opportunities for businesses meeting these demands. Mergers and acquisitions (M&A) activity has been moderate in recent years, with deal values estimated at xx Million annually in the historical period. Notable examples include [Insert example if available, otherwise replace with “xx”].
- Market Concentration: Moderately concentrated
- Innovation Ecosystem: Blend of international and domestic players
- Regulatory Framework: Focus on safety, labeling, and sustainability
- M&A Activity (2019-2024): xx Million annually
Textile Market in Australia: Industry Trends & Insights
The Australian textile market demonstrates robust growth, driven by several factors. Rising disposable incomes and changing consumer preferences toward home improvement and comfortable living significantly boost the demand for various textile products, including bed linen, bath linen, and home furnishings. The increasing popularity of online shopping channels also contributes to the market's expansion. Technological advancements in textile manufacturing, such as automation and the use of advanced materials, lead to enhanced product quality, durability, and design possibilities. These factors contribute to a positive outlook for the market, with a projected CAGR of xx% between 2025 and 2033. Market penetration for online sales is currently estimated at xx%, expected to rise to xx% by 2033. The increasing awareness of sustainable and ethical production practices also affects consumer choices, pushing brands towards environmentally friendly alternatives. Competition remains intense, with established players facing pressure from emerging brands and online retailers.
Dominant Markets & Segments in Textile Market in Australia
The Australian textile market shows diverse growth across segments.
Product Type: Bed linen currently holds the largest market share, driven by a significant demand for comfortable and high-quality sleep solutions. This segment is expected to continue its dominance. Kitchen linen and bath linen also show substantial growth, while upholstery and floor coverings are exhibiting moderate growth.
- Bed Linen: Key Driver: Rising disposable incomes, demand for quality sleep solutions
- Bath Linen: Key Driver: Focus on home comfort and self-care
- Kitchen Linen: Key Driver: Growing interest in home cooking and entertaining
- Upholstery: Key Driver: Home renovation trends
- Floor Covering: Key Driver: Increased spending on home décor
Distribution Channel: Speciality stores and online channels currently dominate the market, offering a wide selection and curated shopping experience. Supermarkets and hypermarkets provide accessibility for everyday textiles, while the "Others" category represents smaller players and direct-to-consumer models. Online sales continue to grow rapidly due to convenience and wider product availability.
- Speciality Stores: Key Driver: Curated selection, personalized service
- Online: Key Driver: Convenience, wider selection
- Supermarkets & Hypermarkets: Key Driver: Accessibility, competitive pricing
Textile Market in Australia: Product Innovations
Recent innovations in the Australian textile market focus on sustainable materials, smart textiles (incorporating technology for temperature regulation or moisture wicking), and improved durability. Manufacturers are increasingly integrating recycled fibers and eco-friendly dyes, enhancing their appeal to environmentally conscious consumers. The integration of technology into textiles, although still niche, is gaining traction, creating opportunities for enhanced functionalities and competitive advantages.
Report Segmentation & Scope
This report segments the Australian textile market by product type (bed linen, bath linen, kitchen linen, upholstery, floor covering) and distribution channel (supermarkets & hypermarkets, specialty stores, online, others). Each segment's growth projections, market size (in Millions), and competitive dynamics are thoroughly analyzed. The analysis encompasses both historical data (2019-2024) and future projections (2025-2033).
Key Drivers of Textile Market in Australia Growth
Several factors drive the Australian textile market's growth. Increasing disposable incomes enable consumers to invest more in home furnishings. Changing lifestyle trends emphasizing comfort and home improvement positively impact demand. Technological advancements in manufacturing and product design contribute to improved quality and innovation. Government initiatives promoting sustainable practices further influence market growth.
Challenges in the Textile Market in Australia Sector
The Australian textile market faces several challenges. Fluctuations in raw material prices and supply chain disruptions affect production costs and profitability. Increasing competition from both domestic and international players requires businesses to maintain innovation and competitive pricing strategies. Regulatory changes related to sustainability and ethical sourcing demand adaptation and compliance.
Leading Players in the Textile Market in Australia Market
- Inditex
- Forty Winks Pty Ltd
- Mittal Australia
- Lorraine lea
- Pure Linen
- Greenlit Brands
- ST Albans Textiles
- Harvey Norman Holdings Ltd
- Hennes & Mauritz AB
- Charles Pearson
- Ikea
Key Developments in Textile Market in Australia Sector
- September 2022: IKEA opens its first planning studio in West Melbourne, focusing on kitchens and wardrobes.
- August 2022: Forty Winks opens a new store in Noarlunga, Adelaide.
Strategic Textile Market in Australia Market Outlook
The Australian textile market presents significant future growth potential, driven by evolving consumer preferences, technological innovations, and increasing emphasis on sustainability. Strategic opportunities lie in developing eco-friendly products, leveraging e-commerce platforms, and focusing on niche market segments. Businesses that successfully adapt to changing consumer demands and invest in innovation are poised to benefit from this growth.
Textile Market in Australia Segmentation
-
1. Product type
- 1.1. Bed linen
- 1.2. Bath linen
- 1.3. Kitchen linen
- 1.4. Upholstery
- 1.5. Floor Covering
-
2. Distribution Channel
- 2.1. Supermarkets & Hypermarkets
- 2.2. Speciality Stores
- 2.3. Online
- 2.4. Others
Textile Market in Australia Segmentation By Geography
-
1. North America
- 1.1. United States
- 1.2. Canada
- 1.3. Mexico
-
2. South America
- 2.1. Brazil
- 2.2. Argentina
- 2.3. Rest of South America
-
3. Europe
- 3.1. United Kingdom
- 3.2. Germany
- 3.3. France
- 3.4. Italy
- 3.5. Spain
- 3.6. Russia
- 3.7. Benelux
- 3.8. Nordics
- 3.9. Rest of Europe
-
4. Middle East & Africa
- 4.1. Turkey
- 4.2. Israel
- 4.3. GCC
- 4.4. North Africa
- 4.5. South Africa
- 4.6. Rest of Middle East & Africa
-
5. Asia Pacific
- 5.1. China
- 5.2. India
- 5.3. Japan
- 5.4. South Korea
- 5.5. ASEAN
- 5.6. Oceania
- 5.7. Rest of Asia Pacific
Textile Market in Australia REPORT HIGHLIGHTS
| Aspects | Details |
|---|---|
| Study Period | 2019-2033 |
| Base Year | 2024 |
| Estimated Year | 2025 |
| Forecast Period | 2025-2033 |
| Historical Period | 2019-2024 |
| Growth Rate | CAGR of 4.56% from 2019-2033 |
| Segmentation |
|
Table of Contents
- 1. Introduction
- 1.1. Research Scope
- 1.2. Market Segmentation
- 1.3. Research Methodology
- 1.4. Definitions and Assumptions
- 2. Executive Summary
- 2.1. Introduction
- 3. Market Dynamics
- 3.1. Introduction
- 3.2. Market Drivers
- 3.2.1. Convenience and Time-Saving; Changing Food Culture and Western Influence
- 3.3. Market Restrains
- 3.3.1. Power Supply Issues; Preference for Traditional Cooking Methods
- 3.4. Market Trends
- 3.4.1. Home Textile Trade from Australia is Increasing
- 4. Market Factor Analysis
- 4.1. Porters Five Forces
- 4.2. Supply/Value Chain
- 4.3. PESTEL analysis
- 4.4. Market Entropy
- 4.5. Patent/Trademark Analysis
- 5. Global Textile Market in Australia Analysis, Insights and Forecast, 2019-2031
- 5.1. Market Analysis, Insights and Forecast - by Product type
- 5.1.1. Bed linen
- 5.1.2. Bath linen
- 5.1.3. Kitchen linen
- 5.1.4. Upholstery
- 5.1.5. Floor Covering
- 5.2. Market Analysis, Insights and Forecast - by Distribution Channel
- 5.2.1. Supermarkets & Hypermarkets
- 5.2.2. Speciality Stores
- 5.2.3. Online
- 5.2.4. Others
- 5.3. Market Analysis, Insights and Forecast - by Region
- 5.3.1. North America
- 5.3.2. South America
- 5.3.3. Europe
- 5.3.4. Middle East & Africa
- 5.3.5. Asia Pacific
- 5.1. Market Analysis, Insights and Forecast - by Product type
- 6. North America Textile Market in Australia Analysis, Insights and Forecast, 2019-2031
- 6.1. Market Analysis, Insights and Forecast - by Product type
- 6.1.1. Bed linen
- 6.1.2. Bath linen
- 6.1.3. Kitchen linen
- 6.1.4. Upholstery
- 6.1.5. Floor Covering
- 6.2. Market Analysis, Insights and Forecast - by Distribution Channel
- 6.2.1. Supermarkets & Hypermarkets
- 6.2.2. Speciality Stores
- 6.2.3. Online
- 6.2.4. Others
- 6.1. Market Analysis, Insights and Forecast - by Product type
- 7. South America Textile Market in Australia Analysis, Insights and Forecast, 2019-2031
- 7.1. Market Analysis, Insights and Forecast - by Product type
- 7.1.1. Bed linen
- 7.1.2. Bath linen
- 7.1.3. Kitchen linen
- 7.1.4. Upholstery
- 7.1.5. Floor Covering
- 7.2. Market Analysis, Insights and Forecast - by Distribution Channel
- 7.2.1. Supermarkets & Hypermarkets
- 7.2.2. Speciality Stores
- 7.2.3. Online
- 7.2.4. Others
- 7.1. Market Analysis, Insights and Forecast - by Product type
- 8. Europe Textile Market in Australia Analysis, Insights and Forecast, 2019-2031
- 8.1. Market Analysis, Insights and Forecast - by Product type
- 8.1.1. Bed linen
- 8.1.2. Bath linen
- 8.1.3. Kitchen linen
- 8.1.4. Upholstery
- 8.1.5. Floor Covering
- 8.2. Market Analysis, Insights and Forecast - by Distribution Channel
- 8.2.1. Supermarkets & Hypermarkets
- 8.2.2. Speciality Stores
- 8.2.3. Online
- 8.2.4. Others
- 8.1. Market Analysis, Insights and Forecast - by Product type
- 9. Middle East & Africa Textile Market in Australia Analysis, Insights and Forecast, 2019-2031
- 9.1. Market Analysis, Insights and Forecast - by Product type
- 9.1.1. Bed linen
- 9.1.2. Bath linen
- 9.1.3. Kitchen linen
- 9.1.4. Upholstery
- 9.1.5. Floor Covering
- 9.2. Market Analysis, Insights and Forecast - by Distribution Channel
- 9.2.1. Supermarkets & Hypermarkets
- 9.2.2. Speciality Stores
- 9.2.3. Online
- 9.2.4. Others
- 9.1. Market Analysis, Insights and Forecast - by Product type
- 10. Asia Pacific Textile Market in Australia Analysis, Insights and Forecast, 2019-2031
- 10.1. Market Analysis, Insights and Forecast - by Product type
- 10.1.1. Bed linen
- 10.1.2. Bath linen
- 10.1.3. Kitchen linen
- 10.1.4. Upholstery
- 10.1.5. Floor Covering
- 10.2. Market Analysis, Insights and Forecast - by Distribution Channel
- 10.2.1. Supermarkets & Hypermarkets
- 10.2.2. Speciality Stores
- 10.2.3. Online
- 10.2.4. Others
- 10.1. Market Analysis, Insights and Forecast - by Product type
- 11. Competitive Analysis
- 11.1. Global Market Share Analysis 2024
- 11.2. Company Profiles
- 11.2.1 Inditex
- 11.2.1.1. Overview
- 11.2.1.2. Products
- 11.2.1.3. SWOT Analysis
- 11.2.1.4. Recent Developments
- 11.2.1.5. Financials (Based on Availability)
- 11.2.2 Forty Winks Pty Ltd
- 11.2.2.1. Overview
- 11.2.2.2. Products
- 11.2.2.3. SWOT Analysis
- 11.2.2.4. Recent Developments
- 11.2.2.5. Financials (Based on Availability)
- 11.2.3 Mittal Australia
- 11.2.3.1. Overview
- 11.2.3.2. Products
- 11.2.3.3. SWOT Analysis
- 11.2.3.4. Recent Developments
- 11.2.3.5. Financials (Based on Availability)
- 11.2.4 Lorraine lea
- 11.2.4.1. Overview
- 11.2.4.2. Products
- 11.2.4.3. SWOT Analysis
- 11.2.4.4. Recent Developments
- 11.2.4.5. Financials (Based on Availability)
- 11.2.5 Pure Linen
- 11.2.5.1. Overview
- 11.2.5.2. Products
- 11.2.5.3. SWOT Analysis
- 11.2.5.4. Recent Developments
- 11.2.5.5. Financials (Based on Availability)
- 11.2.6 Greenlit Brands
- 11.2.6.1. Overview
- 11.2.6.2. Products
- 11.2.6.3. SWOT Analysis
- 11.2.6.4. Recent Developments
- 11.2.6.5. Financials (Based on Availability)
- 11.2.7 ST Albans Textiles
- 11.2.7.1. Overview
- 11.2.7.2. Products
- 11.2.7.3. SWOT Analysis
- 11.2.7.4. Recent Developments
- 11.2.7.5. Financials (Based on Availability)
- 11.2.8 Harvey Norman Holdings Ltd
- 11.2.8.1. Overview
- 11.2.8.2. Products
- 11.2.8.3. SWOT Analysis
- 11.2.8.4. Recent Developments
- 11.2.8.5. Financials (Based on Availability)
- 11.2.9 Hennes & Mauritz AB
- 11.2.9.1. Overview
- 11.2.9.2. Products
- 11.2.9.3. SWOT Analysis
- 11.2.9.4. Recent Developments
- 11.2.9.5. Financials (Based on Availability)
- 11.2.10 Charles Pearson
- 11.2.10.1. Overview
- 11.2.10.2. Products
- 11.2.10.3. SWOT Analysis
- 11.2.10.4. Recent Developments
- 11.2.10.5. Financials (Based on Availability)
- 11.2.11 Ikea
- 11.2.11.1. Overview
- 11.2.11.2. Products
- 11.2.11.3. SWOT Analysis
- 11.2.11.4. Recent Developments
- 11.2.11.5. Financials (Based on Availability)
- 11.2.1 Inditex
List of Figures
- Figure 1: Global Textile Market in Australia Revenue Breakdown (Million, %) by Region 2024 & 2032
- Figure 2: Global Textile Market in Australia Volume Breakdown (K Unit, %) by Region 2024 & 2032
- Figure 3: Australia Textile Market in Australia Revenue (Million), by Country 2024 & 2032
- Figure 4: Australia Textile Market in Australia Volume (K Unit), by Country 2024 & 2032
- Figure 5: Australia Textile Market in Australia Revenue Share (%), by Country 2024 & 2032
- Figure 6: Australia Textile Market in Australia Volume Share (%), by Country 2024 & 2032
- Figure 7: North America Textile Market in Australia Revenue (Million), by Product type 2024 & 2032
- Figure 8: North America Textile Market in Australia Volume (K Unit), by Product type 2024 & 2032
- Figure 9: North America Textile Market in Australia Revenue Share (%), by Product type 2024 & 2032
- Figure 10: North America Textile Market in Australia Volume Share (%), by Product type 2024 & 2032
- Figure 11: North America Textile Market in Australia Revenue (Million), by Distribution Channel 2024 & 2032
- Figure 12: North America Textile Market in Australia Volume (K Unit), by Distribution Channel 2024 & 2032
- Figure 13: North America Textile Market in Australia Revenue Share (%), by Distribution Channel 2024 & 2032
- Figure 14: North America Textile Market in Australia Volume Share (%), by Distribution Channel 2024 & 2032
- Figure 15: North America Textile Market in Australia Revenue (Million), by Country 2024 & 2032
- Figure 16: North America Textile Market in Australia Volume (K Unit), by Country 2024 & 2032
- Figure 17: North America Textile Market in Australia Revenue Share (%), by Country 2024 & 2032
- Figure 18: North America Textile Market in Australia Volume Share (%), by Country 2024 & 2032
- Figure 19: South America Textile Market in Australia Revenue (Million), by Product type 2024 & 2032
- Figure 20: South America Textile Market in Australia Volume (K Unit), by Product type 2024 & 2032
- Figure 21: South America Textile Market in Australia Revenue Share (%), by Product type 2024 & 2032
- Figure 22: South America Textile Market in Australia Volume Share (%), by Product type 2024 & 2032
- Figure 23: South America Textile Market in Australia Revenue (Million), by Distribution Channel 2024 & 2032
- Figure 24: South America Textile Market in Australia Volume (K Unit), by Distribution Channel 2024 & 2032
- Figure 25: South America Textile Market in Australia Revenue Share (%), by Distribution Channel 2024 & 2032
- Figure 26: South America Textile Market in Australia Volume Share (%), by Distribution Channel 2024 & 2032
- Figure 27: South America Textile Market in Australia Revenue (Million), by Country 2024 & 2032
- Figure 28: South America Textile Market in Australia Volume (K Unit), by Country 2024 & 2032
- Figure 29: South America Textile Market in Australia Revenue Share (%), by Country 2024 & 2032
- Figure 30: South America Textile Market in Australia Volume Share (%), by Country 2024 & 2032
- Figure 31: Europe Textile Market in Australia Revenue (Million), by Product type 2024 & 2032
- Figure 32: Europe Textile Market in Australia Volume (K Unit), by Product type 2024 & 2032
- Figure 33: Europe Textile Market in Australia Revenue Share (%), by Product type 2024 & 2032
- Figure 34: Europe Textile Market in Australia Volume Share (%), by Product type 2024 & 2032
- Figure 35: Europe Textile Market in Australia Revenue (Million), by Distribution Channel 2024 & 2032
- Figure 36: Europe Textile Market in Australia Volume (K Unit), by Distribution Channel 2024 & 2032
- Figure 37: Europe Textile Market in Australia Revenue Share (%), by Distribution Channel 2024 & 2032
- Figure 38: Europe Textile Market in Australia Volume Share (%), by Distribution Channel 2024 & 2032
- Figure 39: Europe Textile Market in Australia Revenue (Million), by Country 2024 & 2032
- Figure 40: Europe Textile Market in Australia Volume (K Unit), by Country 2024 & 2032
- Figure 41: Europe Textile Market in Australia Revenue Share (%), by Country 2024 & 2032
- Figure 42: Europe Textile Market in Australia Volume Share (%), by Country 2024 & 2032
- Figure 43: Middle East & Africa Textile Market in Australia Revenue (Million), by Product type 2024 & 2032
- Figure 44: Middle East & Africa Textile Market in Australia Volume (K Unit), by Product type 2024 & 2032
- Figure 45: Middle East & Africa Textile Market in Australia Revenue Share (%), by Product type 2024 & 2032
- Figure 46: Middle East & Africa Textile Market in Australia Volume Share (%), by Product type 2024 & 2032
- Figure 47: Middle East & Africa Textile Market in Australia Revenue (Million), by Distribution Channel 2024 & 2032
- Figure 48: Middle East & Africa Textile Market in Australia Volume (K Unit), by Distribution Channel 2024 & 2032
- Figure 49: Middle East & Africa Textile Market in Australia Revenue Share (%), by Distribution Channel 2024 & 2032
- Figure 50: Middle East & Africa Textile Market in Australia Volume Share (%), by Distribution Channel 2024 & 2032
- Figure 51: Middle East & Africa Textile Market in Australia Revenue (Million), by Country 2024 & 2032
- Figure 52: Middle East & Africa Textile Market in Australia Volume (K Unit), by Country 2024 & 2032
- Figure 53: Middle East & Africa Textile Market in Australia Revenue Share (%), by Country 2024 & 2032
- Figure 54: Middle East & Africa Textile Market in Australia Volume Share (%), by Country 2024 & 2032
- Figure 55: Asia Pacific Textile Market in Australia Revenue (Million), by Product type 2024 & 2032
- Figure 56: Asia Pacific Textile Market in Australia Volume (K Unit), by Product type 2024 & 2032
- Figure 57: Asia Pacific Textile Market in Australia Revenue Share (%), by Product type 2024 & 2032
- Figure 58: Asia Pacific Textile Market in Australia Volume Share (%), by Product type 2024 & 2032
- Figure 59: Asia Pacific Textile Market in Australia Revenue (Million), by Distribution Channel 2024 & 2032
- Figure 60: Asia Pacific Textile Market in Australia Volume (K Unit), by Distribution Channel 2024 & 2032
- Figure 61: Asia Pacific Textile Market in Australia Revenue Share (%), by Distribution Channel 2024 & 2032
- Figure 62: Asia Pacific Textile Market in Australia Volume Share (%), by Distribution Channel 2024 & 2032
- Figure 63: Asia Pacific Textile Market in Australia Revenue (Million), by Country 2024 & 2032
- Figure 64: Asia Pacific Textile Market in Australia Volume (K Unit), by Country 2024 & 2032
- Figure 65: Asia Pacific Textile Market in Australia Revenue Share (%), by Country 2024 & 2032
- Figure 66: Asia Pacific Textile Market in Australia Volume Share (%), by Country 2024 & 2032
List of Tables
- Table 1: Global Textile Market in Australia Revenue Million Forecast, by Region 2019 & 2032
- Table 2: Global Textile Market in Australia Volume K Unit Forecast, by Region 2019 & 2032
- Table 3: Global Textile Market in Australia Revenue Million Forecast, by Product type 2019 & 2032
- Table 4: Global Textile Market in Australia Volume K Unit Forecast, by Product type 2019 & 2032
- Table 5: Global Textile Market in Australia Revenue Million Forecast, by Distribution Channel 2019 & 2032
- Table 6: Global Textile Market in Australia Volume K Unit Forecast, by Distribution Channel 2019 & 2032
- Table 7: Global Textile Market in Australia Revenue Million Forecast, by Region 2019 & 2032
- Table 8: Global Textile Market in Australia Volume K Unit Forecast, by Region 2019 & 2032
- Table 9: Global Textile Market in Australia Revenue Million Forecast, by Country 2019 & 2032
- Table 10: Global Textile Market in Australia Volume K Unit Forecast, by Country 2019 & 2032
- Table 11: Global Textile Market in Australia Revenue Million Forecast, by Product type 2019 & 2032
- Table 12: Global Textile Market in Australia Volume K Unit Forecast, by Product type 2019 & 2032
- Table 13: Global Textile Market in Australia Revenue Million Forecast, by Distribution Channel 2019 & 2032
- Table 14: Global Textile Market in Australia Volume K Unit Forecast, by Distribution Channel 2019 & 2032
- Table 15: Global Textile Market in Australia Revenue Million Forecast, by Country 2019 & 2032
- Table 16: Global Textile Market in Australia Volume K Unit Forecast, by Country 2019 & 2032
- Table 17: United States Textile Market in Australia Revenue (Million) Forecast, by Application 2019 & 2032
- Table 18: United States Textile Market in Australia Volume (K Unit) Forecast, by Application 2019 & 2032
- Table 19: Canada Textile Market in Australia Revenue (Million) Forecast, by Application 2019 & 2032
- Table 20: Canada Textile Market in Australia Volume (K Unit) Forecast, by Application 2019 & 2032
- Table 21: Mexico Textile Market in Australia Revenue (Million) Forecast, by Application 2019 & 2032
- Table 22: Mexico Textile Market in Australia Volume (K Unit) Forecast, by Application 2019 & 2032
- Table 23: Global Textile Market in Australia Revenue Million Forecast, by Product type 2019 & 2032
- Table 24: Global Textile Market in Australia Volume K Unit Forecast, by Product type 2019 & 2032
- Table 25: Global Textile Market in Australia Revenue Million Forecast, by Distribution Channel 2019 & 2032
- Table 26: Global Textile Market in Australia Volume K Unit Forecast, by Distribution Channel 2019 & 2032
- Table 27: Global Textile Market in Australia Revenue Million Forecast, by Country 2019 & 2032
- Table 28: Global Textile Market in Australia Volume K Unit Forecast, by Country 2019 & 2032
- Table 29: Brazil Textile Market in Australia Revenue (Million) Forecast, by Application 2019 & 2032
- Table 30: Brazil Textile Market in Australia Volume (K Unit) Forecast, by Application 2019 & 2032
- Table 31: Argentina Textile Market in Australia Revenue (Million) Forecast, by Application 2019 & 2032
- Table 32: Argentina Textile Market in Australia Volume (K Unit) Forecast, by Application 2019 & 2032
- Table 33: Rest of South America Textile Market in Australia Revenue (Million) Forecast, by Application 2019 & 2032
- Table 34: Rest of South America Textile Market in Australia Volume (K Unit) Forecast, by Application 2019 & 2032
- Table 35: Global Textile Market in Australia Revenue Million Forecast, by Product type 2019 & 2032
- Table 36: Global Textile Market in Australia Volume K Unit Forecast, by Product type 2019 & 2032
- Table 37: Global Textile Market in Australia Revenue Million Forecast, by Distribution Channel 2019 & 2032
- Table 38: Global Textile Market in Australia Volume K Unit Forecast, by Distribution Channel 2019 & 2032
- Table 39: Global Textile Market in Australia Revenue Million Forecast, by Country 2019 & 2032
- Table 40: Global Textile Market in Australia Volume K Unit Forecast, by Country 2019 & 2032
- Table 41: United Kingdom Textile Market in Australia Revenue (Million) Forecast, by Application 2019 & 2032
- Table 42: United Kingdom Textile Market in Australia Volume (K Unit) Forecast, by Application 2019 & 2032
- Table 43: Germany Textile Market in Australia Revenue (Million) Forecast, by Application 2019 & 2032
- Table 44: Germany Textile Market in Australia Volume (K Unit) Forecast, by Application 2019 & 2032
- Table 45: France Textile Market in Australia Revenue (Million) Forecast, by Application 2019 & 2032
- Table 46: France Textile Market in Australia Volume (K Unit) Forecast, by Application 2019 & 2032
- Table 47: Italy Textile Market in Australia Revenue (Million) Forecast, by Application 2019 & 2032
- Table 48: Italy Textile Market in Australia Volume (K Unit) Forecast, by Application 2019 & 2032
- Table 49: Spain Textile Market in Australia Revenue (Million) Forecast, by Application 2019 & 2032
- Table 50: Spain Textile Market in Australia Volume (K Unit) Forecast, by Application 2019 & 2032
- Table 51: Russia Textile Market in Australia Revenue (Million) Forecast, by Application 2019 & 2032
- Table 52: Russia Textile Market in Australia Volume (K Unit) Forecast, by Application 2019 & 2032
- Table 53: Benelux Textile Market in Australia Revenue (Million) Forecast, by Application 2019 & 2032
- Table 54: Benelux Textile Market in Australia Volume (K Unit) Forecast, by Application 2019 & 2032
- Table 55: Nordics Textile Market in Australia Revenue (Million) Forecast, by Application 2019 & 2032
- Table 56: Nordics Textile Market in Australia Volume (K Unit) Forecast, by Application 2019 & 2032
- Table 57: Rest of Europe Textile Market in Australia Revenue (Million) Forecast, by Application 2019 & 2032
- Table 58: Rest of Europe Textile Market in Australia Volume (K Unit) Forecast, by Application 2019 & 2032
- Table 59: Global Textile Market in Australia Revenue Million Forecast, by Product type 2019 & 2032
- Table 60: Global Textile Market in Australia Volume K Unit Forecast, by Product type 2019 & 2032
- Table 61: Global Textile Market in Australia Revenue Million Forecast, by Distribution Channel 2019 & 2032
- Table 62: Global Textile Market in Australia Volume K Unit Forecast, by Distribution Channel 2019 & 2032
- Table 63: Global Textile Market in Australia Revenue Million Forecast, by Country 2019 & 2032
- Table 64: Global Textile Market in Australia Volume K Unit Forecast, by Country 2019 & 2032
- Table 65: Turkey Textile Market in Australia Revenue (Million) Forecast, by Application 2019 & 2032
- Table 66: Turkey Textile Market in Australia Volume (K Unit) Forecast, by Application 2019 & 2032
- Table 67: Israel Textile Market in Australia Revenue (Million) Forecast, by Application 2019 & 2032
- Table 68: Israel Textile Market in Australia Volume (K Unit) Forecast, by Application 2019 & 2032
- Table 69: GCC Textile Market in Australia Revenue (Million) Forecast, by Application 2019 & 2032
- Table 70: GCC Textile Market in Australia Volume (K Unit) Forecast, by Application 2019 & 2032
- Table 71: North Africa Textile Market in Australia Revenue (Million) Forecast, by Application 2019 & 2032
- Table 72: North Africa Textile Market in Australia Volume (K Unit) Forecast, by Application 2019 & 2032
- Table 73: South Africa Textile Market in Australia Revenue (Million) Forecast, by Application 2019 & 2032
- Table 74: South Africa Textile Market in Australia Volume (K Unit) Forecast, by Application 2019 & 2032
- Table 75: Rest of Middle East & Africa Textile Market in Australia Revenue (Million) Forecast, by Application 2019 & 2032
- Table 76: Rest of Middle East & Africa Textile Market in Australia Volume (K Unit) Forecast, by Application 2019 & 2032
- Table 77: Global Textile Market in Australia Revenue Million Forecast, by Product type 2019 & 2032
- Table 78: Global Textile Market in Australia Volume K Unit Forecast, by Product type 2019 & 2032
- Table 79: Global Textile Market in Australia Revenue Million Forecast, by Distribution Channel 2019 & 2032
- Table 80: Global Textile Market in Australia Volume K Unit Forecast, by Distribution Channel 2019 & 2032
- Table 81: Global Textile Market in Australia Revenue Million Forecast, by Country 2019 & 2032
- Table 82: Global Textile Market in Australia Volume K Unit Forecast, by Country 2019 & 2032
- Table 83: China Textile Market in Australia Revenue (Million) Forecast, by Application 2019 & 2032
- Table 84: China Textile Market in Australia Volume (K Unit) Forecast, by Application 2019 & 2032
- Table 85: India Textile Market in Australia Revenue (Million) Forecast, by Application 2019 & 2032
- Table 86: India Textile Market in Australia Volume (K Unit) Forecast, by Application 2019 & 2032
- Table 87: Japan Textile Market in Australia Revenue (Million) Forecast, by Application 2019 & 2032
- Table 88: Japan Textile Market in Australia Volume (K Unit) Forecast, by Application 2019 & 2032
- Table 89: South Korea Textile Market in Australia Revenue (Million) Forecast, by Application 2019 & 2032
- Table 90: South Korea Textile Market in Australia Volume (K Unit) Forecast, by Application 2019 & 2032
- Table 91: ASEAN Textile Market in Australia Revenue (Million) Forecast, by Application 2019 & 2032
- Table 92: ASEAN Textile Market in Australia Volume (K Unit) Forecast, by Application 2019 & 2032
- Table 93: Oceania Textile Market in Australia Revenue (Million) Forecast, by Application 2019 & 2032
- Table 94: Oceania Textile Market in Australia Volume (K Unit) Forecast, by Application 2019 & 2032
- Table 95: Rest of Asia Pacific Textile Market in Australia Revenue (Million) Forecast, by Application 2019 & 2032
- Table 96: Rest of Asia Pacific Textile Market in Australia Volume (K Unit) Forecast, by Application 2019 & 2032
Frequently Asked Questions
1. What is the projected Compound Annual Growth Rate (CAGR) of the Textile Market in Australia?
The projected CAGR is approximately 4.56%.
2. Which companies are prominent players in the Textile Market in Australia?
Key companies in the market include Inditex, Forty Winks Pty Ltd, Mittal Australia, Lorraine lea, Pure Linen, Greenlit Brands, ST Albans Textiles, Harvey Norman Holdings Ltd, Hennes & Mauritz AB, Charles Pearson, Ikea.
3. What are the main segments of the Textile Market in Australia?
The market segments include Product type, Distribution Channel.
4. Can you provide details about the market size?
The market size is estimated to be USD 5.00 Million as of 2022.
5. What are some drivers contributing to market growth?
Convenience and Time-Saving; Changing Food Culture and Western Influence.
6. What are the notable trends driving market growth?
Home Textile Trade from Australia is Increasing.
7. Are there any restraints impacting market growth?
Power Supply Issues; Preference for Traditional Cooking Methods.
8. Can you provide examples of recent developments in the market?
In September 2022, Ingka group operating in Australian home textile opens its first planning studio in Australia in west Melbourne. This studio will be focusing on kitchens and wardrobes, offering customers one-to-one planning with experts, with the full IKEA range available to order.
9. What pricing options are available for accessing the report?
Pricing options include single-user, multi-user, and enterprise licenses priced at USD 3800, USD 4500, and USD 5800 respectively.
10. Is the market size provided in terms of value or volume?
The market size is provided in terms of value, measured in Million and volume, measured in K Unit.
11. Are there any specific market keywords associated with the report?
Yes, the market keyword associated with the report is "Textile Market in Australia," which aids in identifying and referencing the specific market segment covered.
12. How do I determine which pricing option suits my needs best?
The pricing options vary based on user requirements and access needs. Individual users may opt for single-user licenses, while businesses requiring broader access may choose multi-user or enterprise licenses for cost-effective access to the report.
13. Are there any additional resources or data provided in the Textile Market in Australia report?
While the report offers comprehensive insights, it's advisable to review the specific contents or supplementary materials provided to ascertain if additional resources or data are available.
14. How can I stay updated on further developments or reports in the Textile Market in Australia?
To stay informed about further developments, trends, and reports in the Textile Market in Australia, consider subscribing to industry newsletters, following relevant companies and organizations, or regularly checking reputable industry news sources and publications.
Methodology
Step 1 - Identification of Relevant Samples Size from Population Database


Step 2 - Approaches for Defining Global Market Size (Value, Volume* & Price*)

Note*: In applicable scenarios
Step 3 - Data Sources
Primary Research
- Web Analytics
- Survey Reports
- Research Institute
- Latest Research Reports
- Opinion Leaders
Secondary Research
- Annual Reports
- White Paper
- Latest Press Release
- Industry Association
- Paid Database
- Investor Presentations

Step 4 - Data Triangulation
Involves using different sources of information in order to increase the validity of a study
These sources are likely to be stakeholders in a program - participants, other researchers, program staff, other community members, and so on.
Then we put all data in single framework & apply various statistical tools to find out the dynamic on the market.
During the analysis stage, feedback from the stakeholder groups would be compared to determine areas of agreement as well as areas of divergence


