
Key Insights
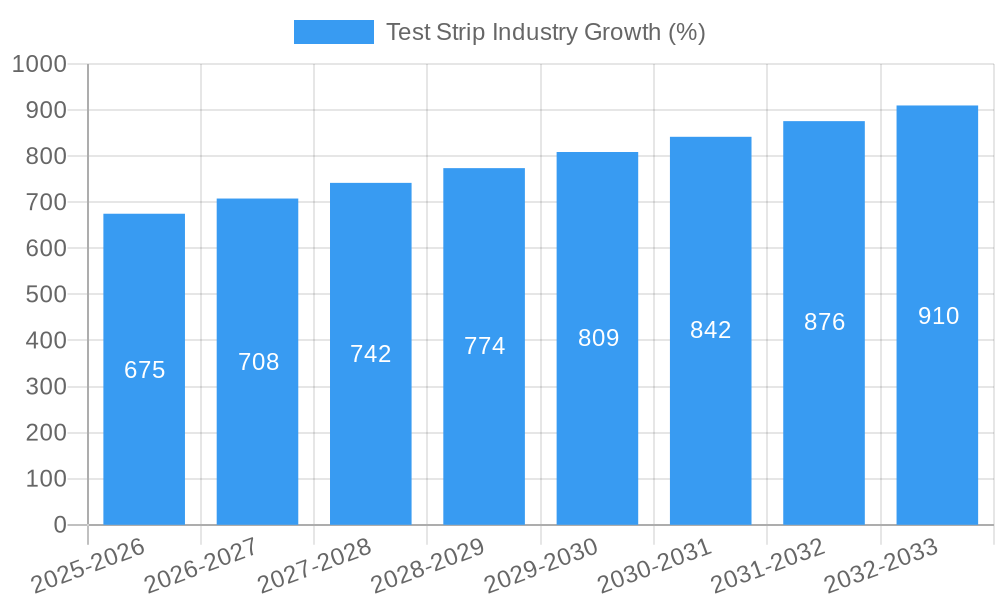
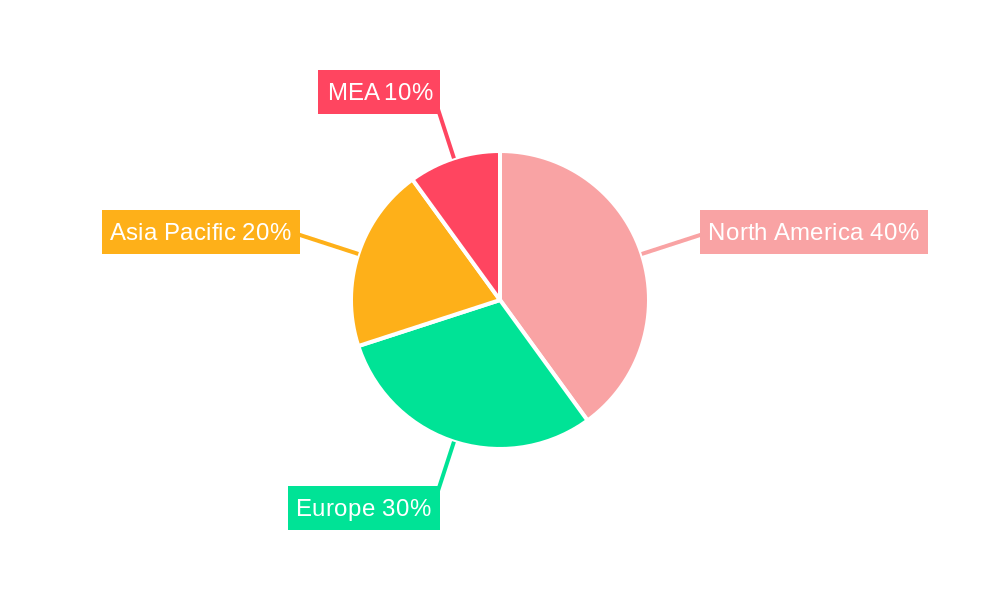
The global test strip market, valued at approximately $XX billion in 2025, is projected to experience robust growth, driven by a compound annual growth rate (CAGR) of 4.50% from 2025 to 2033. This expansion is fueled by several key factors. The increasing prevalence of chronic diseases like diabetes necessitates frequent blood glucose monitoring, significantly boosting demand for blood test strips. Furthermore, the rising incidence of urinary tract infections (UTIs) and the growing need for convenient at-home diagnostics are driving the adoption of urine test strips. Technological advancements leading to more accurate, user-friendly, and affordable test strips are also contributing to market growth. The market is segmented by product type (blood and urine test strips), application (diabetes, pregnancy, UTI, and others), and end-user (hospitals, home care, and diagnostic laboratories). The North American market currently holds a significant share, attributed to high healthcare expenditure and advanced healthcare infrastructure. However, Asia-Pacific is expected to witness substantial growth due to rising disposable incomes, increasing healthcare awareness, and a growing diabetic population. Competitive pressures from established players like Abbott Laboratories, Roche, and Siemens Healthineers, alongside emerging players, are shaping market dynamics. Despite the positive growth outlook, challenges such as stringent regulatory approvals and the potential for inaccuracies in certain test strips could pose some restraints.
The forecast period (2025-2033) anticipates continued market expansion, propelled by factors like the development of integrated digital health solutions incorporating test strips and rising adoption of point-of-care diagnostics. Growth will likely be uneven across segments, with blood test strips maintaining a larger market share due to the prevalence of diabetes. Geographic expansion will likely see a stronger push into emerging markets, especially within the Asia-Pacific region, as healthcare infrastructure and awareness continue to improve. Effective marketing and strategic partnerships with healthcare providers will be crucial for companies seeking to maximize market penetration. The ongoing development of more sophisticated and connected test strips offers further potential for growth in the years to come. The continuous improvement in accuracy and ease of use is anticipated to make this market more accessible to a wider demographic.
Test Strip Industry Market Report: 2019-2033
This comprehensive report provides a detailed analysis of the global test strip industry, offering invaluable insights for stakeholders seeking to understand market dynamics, competitive landscapes, and future growth opportunities. With a study period spanning 2019-2033, a base year of 2025, and a forecast period of 2025-2033, this report leverages extensive data analysis to project a market valued at billions by 2033.
Test Strip Industry Market Structure & Competitive Dynamics
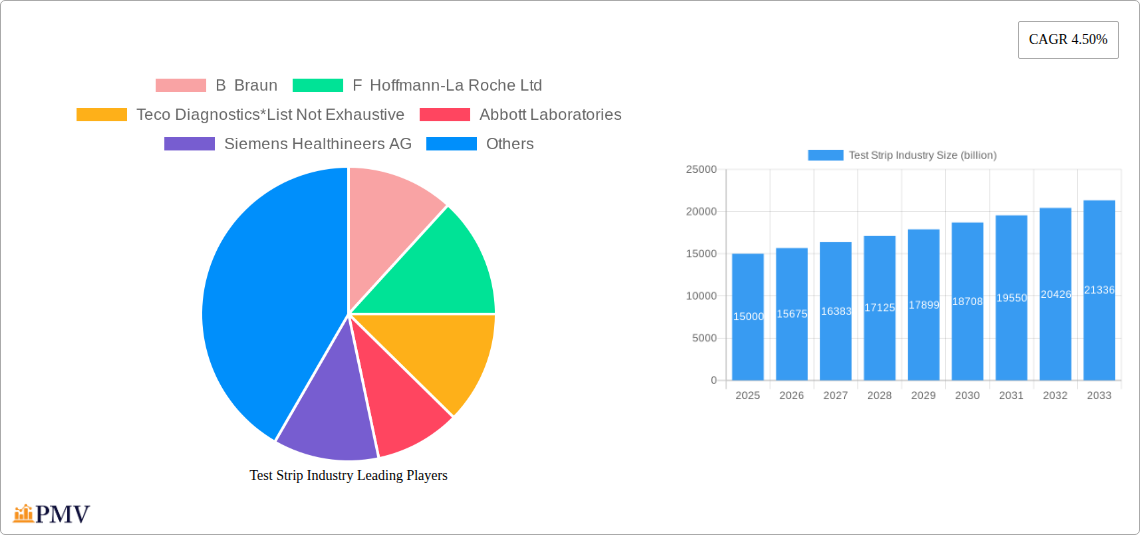
The global test strip market exhibits a moderately consolidated structure, with a handful of multinational corporations holding significant market share. Key players like B Braun, F. Hoffmann-La Roche Ltd, Abbott Laboratories, Siemens Healthineers AG, and others compete fiercely, driving innovation and influencing market pricing. The industry's competitive dynamics are shaped by factors such as technological advancements, regulatory approvals, and strategic mergers and acquisitions (M&A). While precise market share figures fluctuate, estimates suggest that the top five players collectively control approximately xx% of the global market. Recent M&A activity has seen deal values in the range of billions of dollars, indicative of the high stakes involved in securing a dominant market position. The regulatory landscape varies across regions, influencing product approvals and market access, further contributing to the complex competitive environment. Innovation ecosystems are crucial, with significant investments in R&D aimed at improving accuracy, reducing cost, and developing user-friendly devices. Growing preference for point-of-care testing and at-home diagnostics is shifting the dynamics within the end-user segment.
- Market Concentration: Moderately consolidated, with top 5 players controlling approximately xx% of the market.
- Innovation Ecosystems: High R&D investment focused on accuracy, cost reduction, and user-friendly designs.
- Regulatory Frameworks: Vary across geographies, influencing product approvals and market entry.
- Product Substitutes: Limited, with existing substitutes offering lower accuracy or convenience.
- End-User Trends: Increasing preference for point-of-care and home testing.
- M&A Activities: Significant activity with billions of dollars in deal values.
Test Strip Industry Trends & Insights
The test strip industry is experiencing robust growth, driven by several key factors. The increasing prevalence of chronic diseases like diabetes, coupled with the rising geriatric population, fuels the demand for blood glucose test strips. The convenience and affordability of home-based testing are major growth catalysts. Technological advancements, such as the development of more accurate, sensitive, and user-friendly test strips, are also expanding the market. A significant trend is the integration of digital health technologies, enabling remote patient monitoring and data management. However, the market faces challenges, including price fluctuations in raw materials, stringent regulatory requirements, and the potential for generic competition. The Compound Annual Growth Rate (CAGR) is projected to be xx% during the forecast period (2025-2033), with market penetration expected to reach xx% by 2033. Competitive dynamics remain intense, with companies focusing on product differentiation, strategic partnerships, and geographic expansion to maintain their market position.
Dominant Markets & Segments in Test Strip Industry
The global test strip market is geographically diverse, with North America and Europe currently holding the largest market share due to higher healthcare expenditure, advanced healthcare infrastructure, and greater awareness of chronic diseases. However, developing economies in Asia-Pacific and Latin America are witnessing significant growth potential due to rising prevalence of chronic diseases and increasing healthcare investments. Within the segments, blood glucose test strips dominate the product category due to the high prevalence of diabetes. Diabetes holds the lion's share in application-based segments, followed by pregnancy and urinary tract infection testing. Hospitals and diagnostic laboratories comprise the largest end-user segment, reflecting their vital role in medical diagnosis.
- Leading Region: North America
- Key Drivers (North America): High healthcare expenditure, advanced infrastructure, high diabetes prevalence
- Leading Segment (Product): Blood glucose test strips
- Key Drivers (Blood Glucose Strips): High prevalence of diabetes, increased home testing
- Leading Segment (Application): Diabetes
- Key Drivers (Diabetes): Rising diabetes prevalence, improved disease management
- Leading Segment (End User): Hospitals & Diagnostic Laboratories
- Key Drivers (Hospitals & Labs): Established testing infrastructure, diagnostic accuracy demands
Test Strip Industry Product Innovations
Recent innovations in the test strip industry focus on improving accuracy, reducing test time, and enhancing user-friendliness. Miniaturization, integration with digital platforms for data analysis, and the development of advanced biosensors are key areas of technological advancements. These innovations cater to the increasing demand for convenient and reliable point-of-care testing. The market also witnesses a trend toward the development of multi-parameter test strips, capable of simultaneously detecting various analytes in a single test. This improves efficiency and reduces the overall cost per test.
Report Segmentation & Scope
This report segments the test strip market across various parameters to offer a granular view of market dynamics.
- By Product: Blood test strips, Urine test strips. Blood test strips are projected to hold a larger market share due to the higher prevalence of conditions requiring blood testing.
- By Application: Diabetes, Pregnancy, Urinary Tract Infection (UTI), Others. The diabetes segment holds the largest share driven by high prevalence and consistent demand.
- By End User: Hospitals, Home care, Diagnostic laboratories. Hospitals and diagnostic labs currently dominate, but home care is witnessing significant growth.
Key Drivers of Test Strip Industry Growth
Several factors contribute to the growth of the test strip industry. These include the increasing prevalence of chronic diseases (especially diabetes), rising geriatric population, growing adoption of point-of-care testing, technological advancements in test strip technology leading to enhanced accuracy and convenience, and increasing investments in healthcare infrastructure, particularly in emerging economies. Favorable regulatory landscapes in certain regions also support market expansion.
Challenges in the Test Strip Industry Sector
The test strip industry faces several challenges. These include price volatility of raw materials, stringent regulatory approvals, intense competition, and the potential for counterfeit products. Supply chain disruptions can also impact production and availability, causing price hikes. The increasing prevalence of generic test strips can exert downward pressure on pricing.
Leading Players in the Test Strip Industry Market
- B Braun
- F. Hoffmann-La Roche Ltd
- Teco Diagnostics
- Abbott Laboratories
- Siemens Healthineers AG
- Acon Lab
- Lifescan
- Arkray
- Ascensia
- Tiadoc Technology Corporation
Key Developments in Test Strip Industry Sector
- March 2022: 9am.health partnered with Ascensia Diabetes Care to integrate Ascensia's Contour Next One blood glucose meter and test strips into its virtual diabetes clinic platform, significantly expanding access to testing for patients.
- August 2021: FIND partnered with i-SENS Inc. and SD BIOSENSOR Inc. to improve affordability and access to blood glucose test strips in low- and middle-income countries, addressing a critical need in underserved populations.
Strategic Test Strip Industry Market Outlook
The test strip market holds significant growth potential due to the continued increase in chronic diseases, technological advancements, and expanding access to healthcare in developing nations. Strategic opportunities exist in developing innovative, cost-effective test strips, expanding into emerging markets, and forging strategic partnerships with healthcare providers and digital health companies. Focus on personalized medicine and remote patient monitoring will further drive market growth. The global market is poised for continued expansion in the coming years, presenting lucrative prospects for existing and new players.
Test Strip Industry Segmentation
-
1. Product
- 1.1. Blood Test Strips
- 1.2. Urine Test Strips
-
2. Application
- 2.1. Diabetes
- 2.2. Pregnancy
- 2.3. Urinary Tract Infection
- 2.4. Other Applications
-
3. End User
- 3.1. Hospitals
- 3.2. Home Care
- 3.3. Diagnostic Laboratories
Test Strip Industry Segmentation By Geography
-
1. North America
- 1.1. United States
- 1.2. Canada
- 1.3. Mexico
-
2. Europe
- 2.1. Germany
- 2.2. United Kingdom
- 2.3. France
- 2.4. Italy
- 2.5. Spain
- 2.6. Rest of Europe
-
3. Asia Pacific
- 3.1. China
- 3.2. Japan
- 3.3. India
- 3.4. Australia
- 3.5. South Korea
- 3.6. Rest of Asia Pacific
-
4. Middle East and Africa
- 4.1. GCC
- 4.2. South Africa
- 4.3. Rest of Middle East and Africa
-
5. South America
- 5.1. Brazil
- 5.2. Argentina
- 5.3. Rest of South America
Test Strip Industry REPORT HIGHLIGHTS
| Aspects | Details |
|---|---|
| Study Period | 2019-2033 |
| Base Year | 2024 |
| Estimated Year | 2025 |
| Forecast Period | 2025-2033 |
| Historical Period | 2019-2024 |
| Growth Rate | CAGR of 4.50% from 2019-2033 |
| Segmentation |
|
Table of Contents
- 1. Introduction
- 1.1. Research Scope
- 1.2. Market Segmentation
- 1.3. Research Methodology
- 1.4. Definitions and Assumptions
- 2. Executive Summary
- 2.1. Introduction
- 3. Market Dynamics
- 3.1. Introduction
- 3.2. Market Drivers
- 3.2.1. Increasing Burden of Diabetes and Urinary Tract Infection Across The Globe; Rising Preference for Point of Care Testing; Increasing Technological Advancements in Test Strips
- 3.3. Market Restrains
- 3.3.1. Dearth of Reimbursement Policies; Lack of Accuracy in Test Results
- 3.4. Market Trends
- 3.4.1. Diabetes Segment is Anticipated to Witness Significant Growth Over the Analysis Period
- 4. Market Factor Analysis
- 4.1. Porters Five Forces
- 4.2. Supply/Value Chain
- 4.3. PESTEL analysis
- 4.4. Market Entropy
- 4.5. Patent/Trademark Analysis
- 5. Global Test Strip Industry Analysis, Insights and Forecast, 2019-2031
- 5.1. Market Analysis, Insights and Forecast - by Product
- 5.1.1. Blood Test Strips
- 5.1.2. Urine Test Strips
- 5.2. Market Analysis, Insights and Forecast - by Application
- 5.2.1. Diabetes
- 5.2.2. Pregnancy
- 5.2.3. Urinary Tract Infection
- 5.2.4. Other Applications
- 5.3. Market Analysis, Insights and Forecast - by End User
- 5.3.1. Hospitals
- 5.3.2. Home Care
- 5.3.3. Diagnostic Laboratories
- 5.4. Market Analysis, Insights and Forecast - by Region
- 5.4.1. North America
- 5.4.2. Europe
- 5.4.3. Asia Pacific
- 5.4.4. Middle East and Africa
- 5.4.5. South America
- 5.1. Market Analysis, Insights and Forecast - by Product
- 6. North America Test Strip Industry Analysis, Insights and Forecast, 2019-2031
- 6.1. Market Analysis, Insights and Forecast - by Product
- 6.1.1. Blood Test Strips
- 6.1.2. Urine Test Strips
- 6.2. Market Analysis, Insights and Forecast - by Application
- 6.2.1. Diabetes
- 6.2.2. Pregnancy
- 6.2.3. Urinary Tract Infection
- 6.2.4. Other Applications
- 6.3. Market Analysis, Insights and Forecast - by End User
- 6.3.1. Hospitals
- 6.3.2. Home Care
- 6.3.3. Diagnostic Laboratories
- 6.1. Market Analysis, Insights and Forecast - by Product
- 7. Europe Test Strip Industry Analysis, Insights and Forecast, 2019-2031
- 7.1. Market Analysis, Insights and Forecast - by Product
- 7.1.1. Blood Test Strips
- 7.1.2. Urine Test Strips
- 7.2. Market Analysis, Insights and Forecast - by Application
- 7.2.1. Diabetes
- 7.2.2. Pregnancy
- 7.2.3. Urinary Tract Infection
- 7.2.4. Other Applications
- 7.3. Market Analysis, Insights and Forecast - by End User
- 7.3.1. Hospitals
- 7.3.2. Home Care
- 7.3.3. Diagnostic Laboratories
- 7.1. Market Analysis, Insights and Forecast - by Product
- 8. Asia Pacific Test Strip Industry Analysis, Insights and Forecast, 2019-2031
- 8.1. Market Analysis, Insights and Forecast - by Product
- 8.1.1. Blood Test Strips
- 8.1.2. Urine Test Strips
- 8.2. Market Analysis, Insights and Forecast - by Application
- 8.2.1. Diabetes
- 8.2.2. Pregnancy
- 8.2.3. Urinary Tract Infection
- 8.2.4. Other Applications
- 8.3. Market Analysis, Insights and Forecast - by End User
- 8.3.1. Hospitals
- 8.3.2. Home Care
- 8.3.3. Diagnostic Laboratories
- 8.1. Market Analysis, Insights and Forecast - by Product
- 9. Middle East and Africa Test Strip Industry Analysis, Insights and Forecast, 2019-2031
- 9.1. Market Analysis, Insights and Forecast - by Product
- 9.1.1. Blood Test Strips
- 9.1.2. Urine Test Strips
- 9.2. Market Analysis, Insights and Forecast - by Application
- 9.2.1. Diabetes
- 9.2.2. Pregnancy
- 9.2.3. Urinary Tract Infection
- 9.2.4. Other Applications
- 9.3. Market Analysis, Insights and Forecast - by End User
- 9.3.1. Hospitals
- 9.3.2. Home Care
- 9.3.3. Diagnostic Laboratories
- 9.1. Market Analysis, Insights and Forecast - by Product
- 10. South America Test Strip Industry Analysis, Insights and Forecast, 2019-2031
- 10.1. Market Analysis, Insights and Forecast - by Product
- 10.1.1. Blood Test Strips
- 10.1.2. Urine Test Strips
- 10.2. Market Analysis, Insights and Forecast - by Application
- 10.2.1. Diabetes
- 10.2.2. Pregnancy
- 10.2.3. Urinary Tract Infection
- 10.2.4. Other Applications
- 10.3. Market Analysis, Insights and Forecast - by End User
- 10.3.1. Hospitals
- 10.3.2. Home Care
- 10.3.3. Diagnostic Laboratories
- 10.1. Market Analysis, Insights and Forecast - by Product
- 11. North Americ Test Strip Industry Analysis, Insights and Forecast, 2019-2031
- 11.1. Market Analysis, Insights and Forecast - By Country/Sub-region
- 11.1.1 United States
- 11.1.2 Canada
- 11.1.3 Mexico
- 12. South America Test Strip Industry Analysis, Insights and Forecast, 2019-2031
- 12.1. Market Analysis, Insights and Forecast - By Country/Sub-region
- 12.1.1 Brazil
- 12.1.2 Mexico
- 12.1.3 Rest of South America
- 13. Europe Test Strip Industry Analysis, Insights and Forecast, 2019-2031
- 13.1. Market Analysis, Insights and Forecast - By Country/Sub-region
- 13.1.1 Germany
- 13.1.2 United Kingdom
- 13.1.3 France
- 13.1.4 Italy
- 13.1.5 Spain
- 13.1.6 Rest of Europe
- 14. Asia Pacific Test Strip Industry Analysis, Insights and Forecast, 2019-2031
- 14.1. Market Analysis, Insights and Forecast - By Country/Sub-region
- 14.1.1 China
- 14.1.2 Japan
- 14.1.3 India
- 14.1.4 South Korea
- 14.1.5 Taiwan
- 14.1.6 Australia
- 14.1.7 Rest of Asia-Pacific
- 15. MEA Test Strip Industry Analysis, Insights and Forecast, 2019-2031
- 15.1. Market Analysis, Insights and Forecast - By Country/Sub-region
- 15.1.1 Middle East
- 15.1.2 Africa
- 16. Competitive Analysis
- 16.1. Global Market Share Analysis 2024
- 16.2. Company Profiles
- 16.2.1 B Braun
- 16.2.1.1. Overview
- 16.2.1.2. Products
- 16.2.1.3. SWOT Analysis
- 16.2.1.4. Recent Developments
- 16.2.1.5. Financials (Based on Availability)
- 16.2.2 F Hoffmann-La Roche Ltd
- 16.2.2.1. Overview
- 16.2.2.2. Products
- 16.2.2.3. SWOT Analysis
- 16.2.2.4. Recent Developments
- 16.2.2.5. Financials (Based on Availability)
- 16.2.3 Teco Diagnostics*List Not Exhaustive
- 16.2.3.1. Overview
- 16.2.3.2. Products
- 16.2.3.3. SWOT Analysis
- 16.2.3.4. Recent Developments
- 16.2.3.5. Financials (Based on Availability)
- 16.2.4 Abbott Laboratories
- 16.2.4.1. Overview
- 16.2.4.2. Products
- 16.2.4.3. SWOT Analysis
- 16.2.4.4. Recent Developments
- 16.2.4.5. Financials (Based on Availability)
- 16.2.5 Siemens Healthineers AG
- 16.2.5.1. Overview
- 16.2.5.2. Products
- 16.2.5.3. SWOT Analysis
- 16.2.5.4. Recent Developments
- 16.2.5.5. Financials (Based on Availability)
- 16.2.6 Acon Lab
- 16.2.6.1. Overview
- 16.2.6.2. Products
- 16.2.6.3. SWOT Analysis
- 16.2.6.4. Recent Developments
- 16.2.6.5. Financials (Based on Availability)
- 16.2.7 Lifescan
- 16.2.7.1. Overview
- 16.2.7.2. Products
- 16.2.7.3. SWOT Analysis
- 16.2.7.4. Recent Developments
- 16.2.7.5. Financials (Based on Availability)
- 16.2.8 Arkray
- 16.2.8.1. Overview
- 16.2.8.2. Products
- 16.2.8.3. SWOT Analysis
- 16.2.8.4. Recent Developments
- 16.2.8.5. Financials (Based on Availability)
- 16.2.9 Ascensia
- 16.2.9.1. Overview
- 16.2.9.2. Products
- 16.2.9.3. SWOT Analysis
- 16.2.9.4. Recent Developments
- 16.2.9.5. Financials (Based on Availability)
- 16.2.10 Tiadoc Technology Corporation
- 16.2.10.1. Overview
- 16.2.10.2. Products
- 16.2.10.3. SWOT Analysis
- 16.2.10.4. Recent Developments
- 16.2.10.5. Financials (Based on Availability)
- 16.2.1 B Braun
List of Figures
- Figure 1: Global Test Strip Industry Revenue Breakdown (billion, %) by Region 2024 & 2032
- Figure 2: North Americ Test Strip Industry Revenue (billion), by Country 2024 & 2032
- Figure 3: North Americ Test Strip Industry Revenue Share (%), by Country 2024 & 2032
- Figure 4: South America Test Strip Industry Revenue (billion), by Country 2024 & 2032
- Figure 5: South America Test Strip Industry Revenue Share (%), by Country 2024 & 2032
- Figure 6: Europe Test Strip Industry Revenue (billion), by Country 2024 & 2032
- Figure 7: Europe Test Strip Industry Revenue Share (%), by Country 2024 & 2032
- Figure 8: Asia Pacific Test Strip Industry Revenue (billion), by Country 2024 & 2032
- Figure 9: Asia Pacific Test Strip Industry Revenue Share (%), by Country 2024 & 2032
- Figure 10: MEA Test Strip Industry Revenue (billion), by Country 2024 & 2032
- Figure 11: MEA Test Strip Industry Revenue Share (%), by Country 2024 & 2032
- Figure 12: North America Test Strip Industry Revenue (billion), by Product 2024 & 2032
- Figure 13: North America Test Strip Industry Revenue Share (%), by Product 2024 & 2032
- Figure 14: North America Test Strip Industry Revenue (billion), by Application 2024 & 2032
- Figure 15: North America Test Strip Industry Revenue Share (%), by Application 2024 & 2032
- Figure 16: North America Test Strip Industry Revenue (billion), by End User 2024 & 2032
- Figure 17: North America Test Strip Industry Revenue Share (%), by End User 2024 & 2032
- Figure 18: North America Test Strip Industry Revenue (billion), by Country 2024 & 2032
- Figure 19: North America Test Strip Industry Revenue Share (%), by Country 2024 & 2032
- Figure 20: Europe Test Strip Industry Revenue (billion), by Product 2024 & 2032
- Figure 21: Europe Test Strip Industry Revenue Share (%), by Product 2024 & 2032
- Figure 22: Europe Test Strip Industry Revenue (billion), by Application 2024 & 2032
- Figure 23: Europe Test Strip Industry Revenue Share (%), by Application 2024 & 2032
- Figure 24: Europe Test Strip Industry Revenue (billion), by End User 2024 & 2032
- Figure 25: Europe Test Strip Industry Revenue Share (%), by End User 2024 & 2032
- Figure 26: Europe Test Strip Industry Revenue (billion), by Country 2024 & 2032
- Figure 27: Europe Test Strip Industry Revenue Share (%), by Country 2024 & 2032
- Figure 28: Asia Pacific Test Strip Industry Revenue (billion), by Product 2024 & 2032
- Figure 29: Asia Pacific Test Strip Industry Revenue Share (%), by Product 2024 & 2032
- Figure 30: Asia Pacific Test Strip Industry Revenue (billion), by Application 2024 & 2032
- Figure 31: Asia Pacific Test Strip Industry Revenue Share (%), by Application 2024 & 2032
- Figure 32: Asia Pacific Test Strip Industry Revenue (billion), by End User 2024 & 2032
- Figure 33: Asia Pacific Test Strip Industry Revenue Share (%), by End User 2024 & 2032
- Figure 34: Asia Pacific Test Strip Industry Revenue (billion), by Country 2024 & 2032
- Figure 35: Asia Pacific Test Strip Industry Revenue Share (%), by Country 2024 & 2032
- Figure 36: Middle East and Africa Test Strip Industry Revenue (billion), by Product 2024 & 2032
- Figure 37: Middle East and Africa Test Strip Industry Revenue Share (%), by Product 2024 & 2032
- Figure 38: Middle East and Africa Test Strip Industry Revenue (billion), by Application 2024 & 2032
- Figure 39: Middle East and Africa Test Strip Industry Revenue Share (%), by Application 2024 & 2032
- Figure 40: Middle East and Africa Test Strip Industry Revenue (billion), by End User 2024 & 2032
- Figure 41: Middle East and Africa Test Strip Industry Revenue Share (%), by End User 2024 & 2032
- Figure 42: Middle East and Africa Test Strip Industry Revenue (billion), by Country 2024 & 2032
- Figure 43: Middle East and Africa Test Strip Industry Revenue Share (%), by Country 2024 & 2032
- Figure 44: South America Test Strip Industry Revenue (billion), by Product 2024 & 2032
- Figure 45: South America Test Strip Industry Revenue Share (%), by Product 2024 & 2032
- Figure 46: South America Test Strip Industry Revenue (billion), by Application 2024 & 2032
- Figure 47: South America Test Strip Industry Revenue Share (%), by Application 2024 & 2032
- Figure 48: South America Test Strip Industry Revenue (billion), by End User 2024 & 2032
- Figure 49: South America Test Strip Industry Revenue Share (%), by End User 2024 & 2032
- Figure 50: South America Test Strip Industry Revenue (billion), by Country 2024 & 2032
- Figure 51: South America Test Strip Industry Revenue Share (%), by Country 2024 & 2032
List of Tables
- Table 1: Global Test Strip Industry Revenue billion Forecast, by Region 2019 & 2032
- Table 2: Global Test Strip Industry Revenue billion Forecast, by Product 2019 & 2032
- Table 3: Global Test Strip Industry Revenue billion Forecast, by Application 2019 & 2032
- Table 4: Global Test Strip Industry Revenue billion Forecast, by End User 2019 & 2032
- Table 5: Global Test Strip Industry Revenue billion Forecast, by Region 2019 & 2032
- Table 6: Global Test Strip Industry Revenue billion Forecast, by Country 2019 & 2032
- Table 7: United States Test Strip Industry Revenue (billion) Forecast, by Application 2019 & 2032
- Table 8: Canada Test Strip Industry Revenue (billion) Forecast, by Application 2019 & 2032
- Table 9: Mexico Test Strip Industry Revenue (billion) Forecast, by Application 2019 & 2032
- Table 10: Global Test Strip Industry Revenue billion Forecast, by Country 2019 & 2032
- Table 11: Brazil Test Strip Industry Revenue (billion) Forecast, by Application 2019 & 2032
- Table 12: Mexico Test Strip Industry Revenue (billion) Forecast, by Application 2019 & 2032
- Table 13: Rest of South America Test Strip Industry Revenue (billion) Forecast, by Application 2019 & 2032
- Table 14: Global Test Strip Industry Revenue billion Forecast, by Country 2019 & 2032
- Table 15: Germany Test Strip Industry Revenue (billion) Forecast, by Application 2019 & 2032
- Table 16: United Kingdom Test Strip Industry Revenue (billion) Forecast, by Application 2019 & 2032
- Table 17: France Test Strip Industry Revenue (billion) Forecast, by Application 2019 & 2032
- Table 18: Italy Test Strip Industry Revenue (billion) Forecast, by Application 2019 & 2032
- Table 19: Spain Test Strip Industry Revenue (billion) Forecast, by Application 2019 & 2032
- Table 20: Rest of Europe Test Strip Industry Revenue (billion) Forecast, by Application 2019 & 2032
- Table 21: Global Test Strip Industry Revenue billion Forecast, by Country 2019 & 2032
- Table 22: China Test Strip Industry Revenue (billion) Forecast, by Application 2019 & 2032
- Table 23: Japan Test Strip Industry Revenue (billion) Forecast, by Application 2019 & 2032
- Table 24: India Test Strip Industry Revenue (billion) Forecast, by Application 2019 & 2032
- Table 25: South Korea Test Strip Industry Revenue (billion) Forecast, by Application 2019 & 2032
- Table 26: Taiwan Test Strip Industry Revenue (billion) Forecast, by Application 2019 & 2032
- Table 27: Australia Test Strip Industry Revenue (billion) Forecast, by Application 2019 & 2032
- Table 28: Rest of Asia-Pacific Test Strip Industry Revenue (billion) Forecast, by Application 2019 & 2032
- Table 29: Global Test Strip Industry Revenue billion Forecast, by Country 2019 & 2032
- Table 30: Middle East Test Strip Industry Revenue (billion) Forecast, by Application 2019 & 2032
- Table 31: Africa Test Strip Industry Revenue (billion) Forecast, by Application 2019 & 2032
- Table 32: Global Test Strip Industry Revenue billion Forecast, by Product 2019 & 2032
- Table 33: Global Test Strip Industry Revenue billion Forecast, by Application 2019 & 2032
- Table 34: Global Test Strip Industry Revenue billion Forecast, by End User 2019 & 2032
- Table 35: Global Test Strip Industry Revenue billion Forecast, by Country 2019 & 2032
- Table 36: United States Test Strip Industry Revenue (billion) Forecast, by Application 2019 & 2032
- Table 37: Canada Test Strip Industry Revenue (billion) Forecast, by Application 2019 & 2032
- Table 38: Mexico Test Strip Industry Revenue (billion) Forecast, by Application 2019 & 2032
- Table 39: Global Test Strip Industry Revenue billion Forecast, by Product 2019 & 2032
- Table 40: Global Test Strip Industry Revenue billion Forecast, by Application 2019 & 2032
- Table 41: Global Test Strip Industry Revenue billion Forecast, by End User 2019 & 2032
- Table 42: Global Test Strip Industry Revenue billion Forecast, by Country 2019 & 2032
- Table 43: Germany Test Strip Industry Revenue (billion) Forecast, by Application 2019 & 2032
- Table 44: United Kingdom Test Strip Industry Revenue (billion) Forecast, by Application 2019 & 2032
- Table 45: France Test Strip Industry Revenue (billion) Forecast, by Application 2019 & 2032
- Table 46: Italy Test Strip Industry Revenue (billion) Forecast, by Application 2019 & 2032
- Table 47: Spain Test Strip Industry Revenue (billion) Forecast, by Application 2019 & 2032
- Table 48: Rest of Europe Test Strip Industry Revenue (billion) Forecast, by Application 2019 & 2032
- Table 49: Global Test Strip Industry Revenue billion Forecast, by Product 2019 & 2032
- Table 50: Global Test Strip Industry Revenue billion Forecast, by Application 2019 & 2032
- Table 51: Global Test Strip Industry Revenue billion Forecast, by End User 2019 & 2032
- Table 52: Global Test Strip Industry Revenue billion Forecast, by Country 2019 & 2032
- Table 53: China Test Strip Industry Revenue (billion) Forecast, by Application 2019 & 2032
- Table 54: Japan Test Strip Industry Revenue (billion) Forecast, by Application 2019 & 2032
- Table 55: India Test Strip Industry Revenue (billion) Forecast, by Application 2019 & 2032
- Table 56: Australia Test Strip Industry Revenue (billion) Forecast, by Application 2019 & 2032
- Table 57: South Korea Test Strip Industry Revenue (billion) Forecast, by Application 2019 & 2032
- Table 58: Rest of Asia Pacific Test Strip Industry Revenue (billion) Forecast, by Application 2019 & 2032
- Table 59: Global Test Strip Industry Revenue billion Forecast, by Product 2019 & 2032
- Table 60: Global Test Strip Industry Revenue billion Forecast, by Application 2019 & 2032
- Table 61: Global Test Strip Industry Revenue billion Forecast, by End User 2019 & 2032
- Table 62: Global Test Strip Industry Revenue billion Forecast, by Country 2019 & 2032
- Table 63: GCC Test Strip Industry Revenue (billion) Forecast, by Application 2019 & 2032
- Table 64: South Africa Test Strip Industry Revenue (billion) Forecast, by Application 2019 & 2032
- Table 65: Rest of Middle East and Africa Test Strip Industry Revenue (billion) Forecast, by Application 2019 & 2032
- Table 66: Global Test Strip Industry Revenue billion Forecast, by Product 2019 & 2032
- Table 67: Global Test Strip Industry Revenue billion Forecast, by Application 2019 & 2032
- Table 68: Global Test Strip Industry Revenue billion Forecast, by End User 2019 & 2032
- Table 69: Global Test Strip Industry Revenue billion Forecast, by Country 2019 & 2032
- Table 70: Brazil Test Strip Industry Revenue (billion) Forecast, by Application 2019 & 2032
- Table 71: Argentina Test Strip Industry Revenue (billion) Forecast, by Application 2019 & 2032
- Table 72: Rest of South America Test Strip Industry Revenue (billion) Forecast, by Application 2019 & 2032
Frequently Asked Questions
1. What is the projected Compound Annual Growth Rate (CAGR) of the Test Strip Industry?
The projected CAGR is approximately 4.50%.
2. Which companies are prominent players in the Test Strip Industry?
Key companies in the market include B Braun, F Hoffmann-La Roche Ltd, Teco Diagnostics*List Not Exhaustive, Abbott Laboratories, Siemens Healthineers AG, Acon Lab, Lifescan, Arkray, Ascensia, Tiadoc Technology Corporation.
3. What are the main segments of the Test Strip Industry?
The market segments include Product, Application, End User.
4. Can you provide details about the market size?
The market size is estimated to be USD XX billion as of 2022.
5. What are some drivers contributing to market growth?
Increasing Burden of Diabetes and Urinary Tract Infection Across The Globe; Rising Preference for Point of Care Testing; Increasing Technological Advancements in Test Strips.
6. What are the notable trends driving market growth?
Diabetes Segment is Anticipated to Witness Significant Growth Over the Analysis Period.
7. Are there any restraints impacting market growth?
Dearth of Reimbursement Policies; Lack of Accuracy in Test Results.
8. Can you provide examples of recent developments in the market?
Mar 2022: Virtual diabetes clinic 9am.health partnered with Ascensia Diabetes Care to add the Contour Next One blood glucose meter to its patient diabetes toolkit. As part of the collaboration, the clinic's type 2 diabetes and prediabetes patients can now add Ascensia's blood glucose meter and 100 to 300 test strips to their personalized treatment plan.
9. What pricing options are available for accessing the report?
Pricing options include single-user, multi-user, and enterprise licenses priced at USD 4750, USD 5250, and USD 8750 respectively.
10. Is the market size provided in terms of value or volume?
The market size is provided in terms of value, measured in billion.
11. Are there any specific market keywords associated with the report?
Yes, the market keyword associated with the report is "Test Strip Industry," which aids in identifying and referencing the specific market segment covered.
12. How do I determine which pricing option suits my needs best?
The pricing options vary based on user requirements and access needs. Individual users may opt for single-user licenses, while businesses requiring broader access may choose multi-user or enterprise licenses for cost-effective access to the report.
13. Are there any additional resources or data provided in the Test Strip Industry report?
While the report offers comprehensive insights, it's advisable to review the specific contents or supplementary materials provided to ascertain if additional resources or data are available.
14. How can I stay updated on further developments or reports in the Test Strip Industry?
To stay informed about further developments, trends, and reports in the Test Strip Industry, consider subscribing to industry newsletters, following relevant companies and organizations, or regularly checking reputable industry news sources and publications.
Methodology
Step 1 - Identification of Relevant Samples Size from Population Database


Step 2 - Approaches for Defining Global Market Size (Value, Volume* & Price*)

Note*: In applicable scenarios
Step 3 - Data Sources
Primary Research
- Web Analytics
- Survey Reports
- Research Institute
- Latest Research Reports
- Opinion Leaders
Secondary Research
- Annual Reports
- White Paper
- Latest Press Release
- Industry Association
- Paid Database
- Investor Presentations

Step 4 - Data Triangulation
Involves using different sources of information in order to increase the validity of a study
These sources are likely to be stakeholders in a program - participants, other researchers, program staff, other community members, and so on.
Then we put all data in single framework & apply various statistical tools to find out the dynamic on the market.
During the analysis stage, feedback from the stakeholder groups would be compared to determine areas of agreement as well as areas of divergence


