
Key Insights
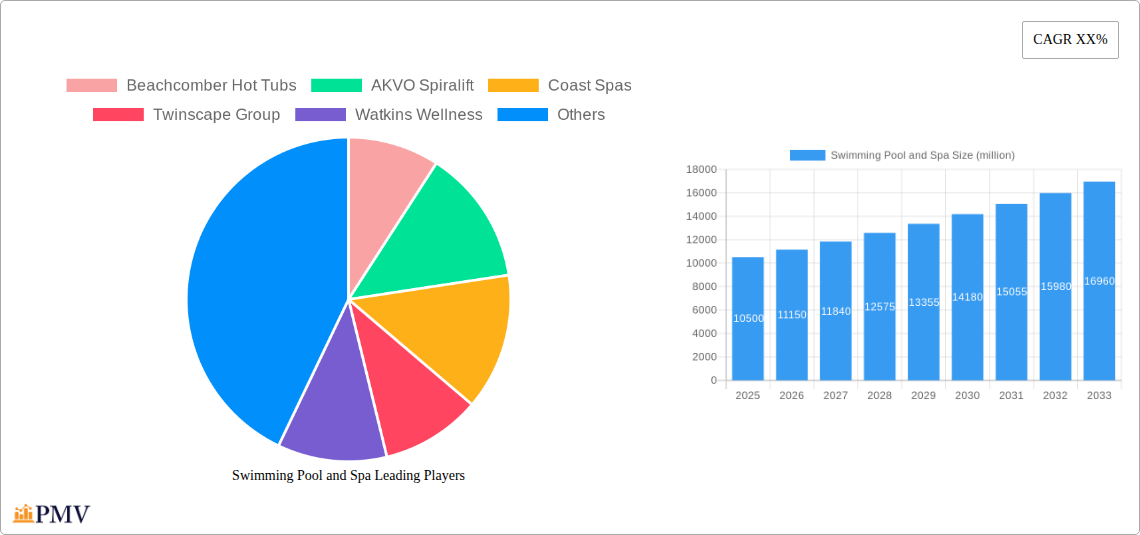
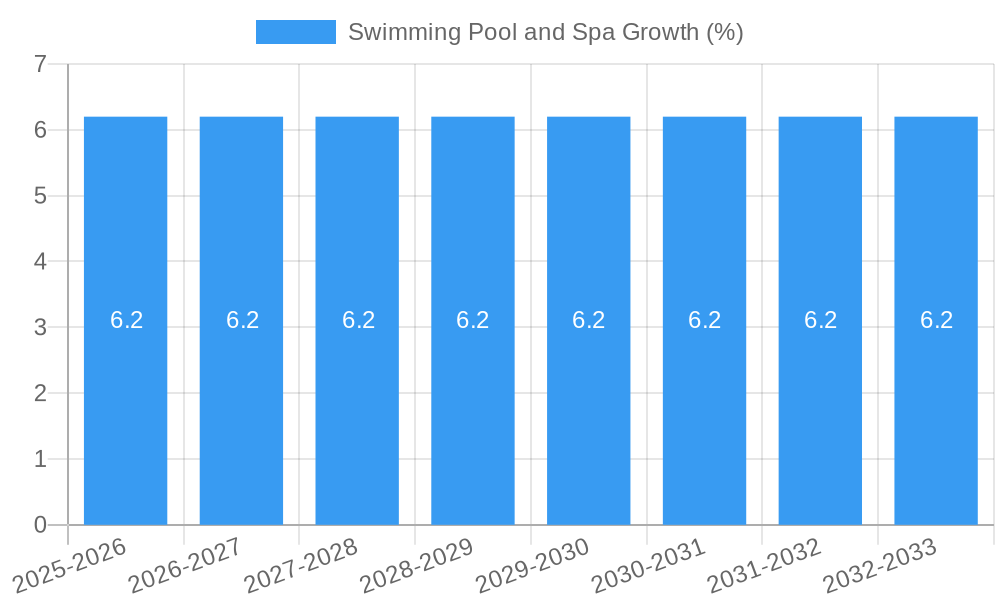
The global swimming pool and spa market is poised for significant expansion, projected to reach an estimated USD 10,500 million by 2025, growing at a robust Compound Annual Growth Rate (CAGR) of 6.2%. This upward trajectory is primarily fueled by increasing disposable incomes, a growing emphasis on health and wellness, and a rising demand for luxury and recreational amenities across both residential and commercial sectors. The "Other" application segment, encompassing hotels, resorts, fitness centers, and public aquatic facilities, is anticipated to lead the market, driven by their continuous need to upgrade and enhance customer experiences. Movable swimming pools and spas, offering unparalleled flexibility and space-saving solutions, are also expected to witness considerable adoption, particularly in urban environments and for temporary event installations.
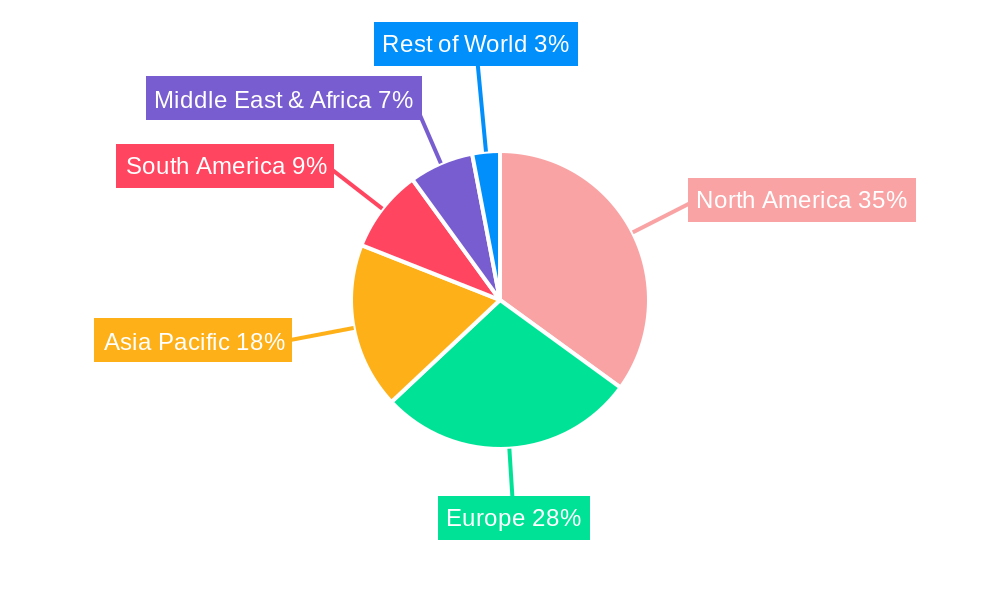
The market's growth is further propelled by technological advancements leading to more energy-efficient and user-friendly pool and spa systems, alongside an increasing adoption of smart technologies for automated maintenance and enhanced user control. Emerging economies, especially in Asia Pacific and Latin America, present substantial untapped potential due to rapid urbanization and a burgeoning middle class eager to embrace leisure and recreational lifestyles. However, high initial installation costs and stringent environmental regulations related to water usage and chemical disposal may pose some restraints. Nonetheless, innovations in water conservation technologies and the development of more affordable, modular spa and pool designs are expected to mitigate these challenges, paving the way for sustained growth throughout the forecast period. Key players like Watkins Wellness, Beachcomber Hot Tubs, and Coast Spas are actively investing in product innovation and expanding their global presence to capitalize on these evolving market dynamics.
This comprehensive report delves into the global Swimming Pool and Spa market, providing an in-depth analysis from 2019 to 2033. With a base year of 2025, the study leverages historical data (2019-2024) and projects future trends through the forecast period (2025-2033), offering an estimated market valuation for 2025.
Swimming Pool and Spa Market Structure & Competitive Dynamics
The global Swimming Pool and Spa market exhibits a moderately concentrated structure, with a blend of established global manufacturers and niche regional players. Innovation ecosystems are burgeoning, driven by advancements in smart technology integration, energy efficiency, and sustainable materials. Regulatory frameworks, primarily focused on water safety, energy consumption standards, and environmental impact, vary significantly across key regions, influencing product design and market entry strategies. Product substitutes, such as natural swimming ponds and public water parks, present a degree of competition, particularly in specific application segments. End-user trends are shifting towards personalized wellness experiences, automation, and aesthetically integrated spa and pool designs. Mergers and acquisitions (M&A) activities are notable, with recent deals valued in the hundreds of millions of dollars, aimed at consolidating market share and expanding product portfolios. Key players are actively engaged in strategic alliances to leverage technological expertise and broaden distribution networks. Market share analysis indicates that leading companies hold significant portions of the global market, with expansion driven by product differentiation and strategic market penetration.
Swimming Pool and Spa Industry Trends & Insights
The Swimming Pool and Spa industry is experiencing robust growth, projected at a Compound Annual Growth Rate (CAGR) of xx% during the forecast period. This expansion is propelled by increasing disposable incomes, a growing emphasis on health and wellness, and rising demand for luxury amenities in both residential and commercial settings. Technological disruptions are a significant trend, with the integration of smart controls, advanced water purification systems, and energy-efficient heating solutions becoming standard. The proliferation of connected devices allows for remote management of pools and spas, enhancing user convenience and operational efficiency. Consumer preferences are increasingly leaning towards sustainable and eco-friendly options, driving innovation in water conservation and energy usage. The residential segment, in particular, is witnessing a surge in demand for in-home wellness solutions, including plunge pools, swim spas, and high-end hot tubs, reflecting a desire for personalized relaxation and fitness. Market penetration in emerging economies is expected to accelerate, fueled by urbanization and a growing middle class seeking lifestyle enhancements. Competitive dynamics are characterized by continuous product innovation, aggressive marketing campaigns, and strategic collaborations to capture market share. The xx% market penetration in key developed regions underscores the mature nature of these markets, while emerging markets offer substantial untapped potential.
Dominant Markets & Segments in Swimming Pool and Spa
The Residential segment is currently the dominant force within the Swimming Pool and Spa market, accounting for an estimated xx% of the global market share. This dominance is driven by several key factors:
- Economic Policies & Disposable Income: Rising disposable incomes in developed and developing economies, coupled with favorable economic policies that encourage home improvement and leisure spending, significantly contribute to the demand for residential pools and spas.
- Lifestyle Trends: A growing global emphasis on home-based wellness, relaxation, and personal fitness has positioned swimming pools and spas as desirable amenities for enhancing quality of life.
- Technological Advancements: The integration of smart technologies, energy-efficient designs, and customizable features appeals to homeowners seeking convenience and luxury.
- Availability of Financing: Accessible financing options for home renovations and additions make the purchase of pools and spas more feasible for a broader consumer base.
Within the Types segmentation, Movable Swimming Pool products are experiencing significant traction due to their flexibility, ease of installation, and adaptability to various spaces, particularly in urban environments where traditional pool construction might be challenging. The market for Movable Swimming Pools is projected to grow at a CAGR of xx%, driven by innovation in modular designs and integrated filtration systems.
The Commercial application segment, while smaller in current market share, is exhibiting a strong growth trajectory. This segment includes hotels, resorts, fitness centers, and public aquatic facilities. Growth drivers include:
- Tourism and Hospitality Growth: The expansion of the global tourism industry fuels demand for high-quality swimming pool and spa facilities in hotels and resorts to attract and retain guests.
- Wellness Tourism: The rising trend of wellness tourism encourages investment in spa and pool facilities that offer therapeutic and recreational benefits.
- Infrastructure Development: Government investments in public parks, sports facilities, and recreational areas contribute to the growth of the commercial segment.
The Other application segment, encompassing therapeutic facilities, rehabilitation centers, and specialized aquatic training centers, also presents niche growth opportunities, driven by the increasing recognition of hydrotherapy and aquatic exercise benefits.
Swimming Pool and Spa Product Innovations
Product innovations in the Swimming Pool and Spa market are predominantly focused on enhanced user experience, energy efficiency, and sustainability. Key developments include the integration of advanced smart control systems for remote operation of heating, lighting, and water quality management, as well as the introduction of energy-saving heat pumps and solar-powered filtration systems. Material science advancements are leading to more durable, aesthetically pleasing, and eco-friendly construction materials. The rise of customizable and modular spa designs caters to diverse consumer preferences, offering unique hydrotherapy experiences and space-saving solutions.
Report Segmentation & Scope
This report segments the global Swimming Pool and Spa market across key applications and product types.
- Application: The Residential application segment is a major contributor, driven by homeowners investing in backyard amenities for leisure and wellness. This segment is projected to reach hundreds of millions in market value by 2033, with a steady CAGR of xx%. The Commercial application segment, including hotels, resorts, and fitness centers, is expected to grow at a CAGR of xx%, fueled by the hospitality and wellness industries. The Other segment, encompassing therapeutic and specialized facilities, offers niche growth opportunities.
- Types: The Movable Swimming Pool segment is gaining momentum due to its flexibility and ease of installation, projected to achieve a CAGR of xx%. The Movable Spa segment, including hot tubs and portable spas, continues to be a strong performer, benefiting from home wellness trends.
Key Drivers of Swimming Pool and Spa Growth
Several key drivers are fueling the growth of the Swimming Pool and Spa market.
- Rising Disposable Incomes: Increased purchasing power globally allows more consumers to invest in luxury home amenities and leisure activities.
- Health and Wellness Trends: A growing focus on personal well-being, relaxation, and therapeutic benefits drives demand for spas and swimming pools.
- Technological Advancements: Integration of smart technology, energy efficiency, and advanced water purification systems enhances convenience and appeal.
- Urbanization and Smaller Living Spaces: The demand for movable and space-saving pool and spa solutions is increasing in urban areas.
- Hospitality and Tourism Sector Growth: Expansion in hotels, resorts, and wellness centers directly boosts commercial demand.
Challenges in the Swimming Pool and Spa Sector
The Swimming Pool and Spa sector faces several challenges that can impact market growth.
- High Initial Investment Costs: The upfront cost of purchasing and installing swimming pools and spas remains a barrier for some potential consumers.
- Maintenance and Operational Expenses: Ongoing costs for water treatment, energy, and repairs can deter segments of the market.
- Regulatory Compliance: Adhering to evolving water safety, energy efficiency, and environmental regulations can increase production costs and complexity.
- Supply Chain Disruptions: Global supply chain issues can lead to material shortages and extended lead times, impacting production and delivery.
- Intense Competition: The market is characterized by intense competition among established players and new entrants, putting pressure on pricing and profit margins.
Leading Players in the Swimming Pool and Spa Market
The following companies are prominent leaders in the global Swimming Pool and Spa market:
- Beachcomber Hot Tubs
- AKVO Spiralift
- Coast Spas
- Twinscape Group
- Watkins Wellness
- Roca Sanitario
- Variopool Group
- Bestway
Key Developments in Swimming Pool and Spa Sector
- 2023/08: Watkins Wellness launches a new range of energy-efficient hot tubs with advanced smart controls.
- 2023/10: Bestway expands its portable spa offerings with innovative, easy-to-install models.
- 2023/11: Coast Spas introduces a swim spa with integrated resistance jets for advanced aquatic training.
- 2024/01: Variopool Group announces expansion into the Middle Eastern market with movable pool solutions.
- 2024/02: AKVO Spiralift showcases its innovative retractable pool cover technology at a leading industry exhibition.
- 2024/03: Beachcomber Hot Tubs enhances its product line with eco-friendly insulation and water treatment systems.
Strategic Swimming Pool and Spa Market Outlook
The strategic outlook for the Swimming Pool and Spa market is highly positive, driven by sustained demand for enhanced lifestyle amenities and a growing emphasis on health and wellness. Future growth accelerators include continued innovation in smart technologies, the development of more sustainable and energy-efficient products, and the expansion into emerging markets. Strategic opportunities lie in catering to the increasing demand for personalized and modular spa experiences, investing in eco-friendly manufacturing processes, and leveraging digital platforms for enhanced customer engagement and direct-to-consumer sales. The market is poised for significant expansion as consumers continue to prioritize home-based leisure and wellness solutions.
Swimming Pool and Spa Segmentation
-
1. Application
- 1.1. Commercial
- 1.2. Residential
- 1.3. Other
-
2. Types
- 2.1. Movable Swimming Pool
- 2.2. Movable Spa
Swimming Pool and Spa Segmentation By Geography
-
1. North America
- 1.1. United States
- 1.2. Canada
- 1.3. Mexico
-
2. South America
- 2.1. Brazil
- 2.2. Argentina
- 2.3. Rest of South America
-
3. Europe
- 3.1. United Kingdom
- 3.2. Germany
- 3.3. France
- 3.4. Italy
- 3.5. Spain
- 3.6. Russia
- 3.7. Benelux
- 3.8. Nordics
- 3.9. Rest of Europe
-
4. Middle East & Africa
- 4.1. Turkey
- 4.2. Israel
- 4.3. GCC
- 4.4. North Africa
- 4.5. South Africa
- 4.6. Rest of Middle East & Africa
-
5. Asia Pacific
- 5.1. China
- 5.2. India
- 5.3. Japan
- 5.4. South Korea
- 5.5. ASEAN
- 5.6. Oceania
- 5.7. Rest of Asia Pacific
Swimming Pool and Spa REPORT HIGHLIGHTS
| Aspects | Details |
|---|---|
| Study Period | 2019-2033 |
| Base Year | 2024 |
| Estimated Year | 2025 |
| Forecast Period | 2025-2033 |
| Historical Period | 2019-2024 |
| Growth Rate | CAGR of XX% from 2019-2033 |
| Segmentation |
|
Table of Contents
- 1. Introduction
- 1.1. Research Scope
- 1.2. Market Segmentation
- 1.3. Research Methodology
- 1.4. Definitions and Assumptions
- 2. Executive Summary
- 2.1. Introduction
- 3. Market Dynamics
- 3.1. Introduction
- 3.2. Market Drivers
- 3.3. Market Restrains
- 3.4. Market Trends
- 4. Market Factor Analysis
- 4.1. Porters Five Forces
- 4.2. Supply/Value Chain
- 4.3. PESTEL analysis
- 4.4. Market Entropy
- 4.5. Patent/Trademark Analysis
- 5. Global Swimming Pool and Spa Analysis, Insights and Forecast, 2019-2031
- 5.1. Market Analysis, Insights and Forecast - by Application
- 5.1.1. Commercial
- 5.1.2. Residential
- 5.1.3. Other
- 5.2. Market Analysis, Insights and Forecast - by Types
- 5.2.1. Movable Swimming Pool
- 5.2.2. Movable Spa
- 5.3. Market Analysis, Insights and Forecast - by Region
- 5.3.1. North America
- 5.3.2. South America
- 5.3.3. Europe
- 5.3.4. Middle East & Africa
- 5.3.5. Asia Pacific
- 5.1. Market Analysis, Insights and Forecast - by Application
- 6. North America Swimming Pool and Spa Analysis, Insights and Forecast, 2019-2031
- 6.1. Market Analysis, Insights and Forecast - by Application
- 6.1.1. Commercial
- 6.1.2. Residential
- 6.1.3. Other
- 6.2. Market Analysis, Insights and Forecast - by Types
- 6.2.1. Movable Swimming Pool
- 6.2.2. Movable Spa
- 6.1. Market Analysis, Insights and Forecast - by Application
- 7. South America Swimming Pool and Spa Analysis, Insights and Forecast, 2019-2031
- 7.1. Market Analysis, Insights and Forecast - by Application
- 7.1.1. Commercial
- 7.1.2. Residential
- 7.1.3. Other
- 7.2. Market Analysis, Insights and Forecast - by Types
- 7.2.1. Movable Swimming Pool
- 7.2.2. Movable Spa
- 7.1. Market Analysis, Insights and Forecast - by Application
- 8. Europe Swimming Pool and Spa Analysis, Insights and Forecast, 2019-2031
- 8.1. Market Analysis, Insights and Forecast - by Application
- 8.1.1. Commercial
- 8.1.2. Residential
- 8.1.3. Other
- 8.2. Market Analysis, Insights and Forecast - by Types
- 8.2.1. Movable Swimming Pool
- 8.2.2. Movable Spa
- 8.1. Market Analysis, Insights and Forecast - by Application
- 9. Middle East & Africa Swimming Pool and Spa Analysis, Insights and Forecast, 2019-2031
- 9.1. Market Analysis, Insights and Forecast - by Application
- 9.1.1. Commercial
- 9.1.2. Residential
- 9.1.3. Other
- 9.2. Market Analysis, Insights and Forecast - by Types
- 9.2.1. Movable Swimming Pool
- 9.2.2. Movable Spa
- 9.1. Market Analysis, Insights and Forecast - by Application
- 10. Asia Pacific Swimming Pool and Spa Analysis, Insights and Forecast, 2019-2031
- 10.1. Market Analysis, Insights and Forecast - by Application
- 10.1.1. Commercial
- 10.1.2. Residential
- 10.1.3. Other
- 10.2. Market Analysis, Insights and Forecast - by Types
- 10.2.1. Movable Swimming Pool
- 10.2.2. Movable Spa
- 10.1. Market Analysis, Insights and Forecast - by Application
- 11. Competitive Analysis
- 11.1. Global Market Share Analysis 2024
- 11.2. Company Profiles
- 11.2.1 Beachcomber Hot Tubs
- 11.2.1.1. Overview
- 11.2.1.2. Products
- 11.2.1.3. SWOT Analysis
- 11.2.1.4. Recent Developments
- 11.2.1.5. Financials (Based on Availability)
- 11.2.2 AKVO Spiralift
- 11.2.2.1. Overview
- 11.2.2.2. Products
- 11.2.2.3. SWOT Analysis
- 11.2.2.4. Recent Developments
- 11.2.2.5. Financials (Based on Availability)
- 11.2.3 Coast Spas
- 11.2.3.1. Overview
- 11.2.3.2. Products
- 11.2.3.3. SWOT Analysis
- 11.2.3.4. Recent Developments
- 11.2.3.5. Financials (Based on Availability)
- 11.2.4 Twinscape Group
- 11.2.4.1. Overview
- 11.2.4.2. Products
- 11.2.4.3. SWOT Analysis
- 11.2.4.4. Recent Developments
- 11.2.4.5. Financials (Based on Availability)
- 11.2.5 Watkins Wellness
- 11.2.5.1. Overview
- 11.2.5.2. Products
- 11.2.5.3. SWOT Analysis
- 11.2.5.4. Recent Developments
- 11.2.5.5. Financials (Based on Availability)
- 11.2.6 Roca Sanitario
- 11.2.6.1. Overview
- 11.2.6.2. Products
- 11.2.6.3. SWOT Analysis
- 11.2.6.4. Recent Developments
- 11.2.6.5. Financials (Based on Availability)
- 11.2.7 Variopool Group
- 11.2.7.1. Overview
- 11.2.7.2. Products
- 11.2.7.3. SWOT Analysis
- 11.2.7.4. Recent Developments
- 11.2.7.5. Financials (Based on Availability)
- 11.2.8 Bestway
- 11.2.8.1. Overview
- 11.2.8.2. Products
- 11.2.8.3. SWOT Analysis
- 11.2.8.4. Recent Developments
- 11.2.8.5. Financials (Based on Availability)
- 11.2.1 Beachcomber Hot Tubs
List of Figures
- Figure 1: Global Swimming Pool and Spa Revenue Breakdown (million, %) by Region 2024 & 2032
- Figure 2: Global Swimming Pool and Spa Volume Breakdown (K, %) by Region 2024 & 2032
- Figure 3: North America Swimming Pool and Spa Revenue (million), by Application 2024 & 2032
- Figure 4: North America Swimming Pool and Spa Volume (K), by Application 2024 & 2032
- Figure 5: North America Swimming Pool and Spa Revenue Share (%), by Application 2024 & 2032
- Figure 6: North America Swimming Pool and Spa Volume Share (%), by Application 2024 & 2032
- Figure 7: North America Swimming Pool and Spa Revenue (million), by Types 2024 & 2032
- Figure 8: North America Swimming Pool and Spa Volume (K), by Types 2024 & 2032
- Figure 9: North America Swimming Pool and Spa Revenue Share (%), by Types 2024 & 2032
- Figure 10: North America Swimming Pool and Spa Volume Share (%), by Types 2024 & 2032
- Figure 11: North America Swimming Pool and Spa Revenue (million), by Country 2024 & 2032
- Figure 12: North America Swimming Pool and Spa Volume (K), by Country 2024 & 2032
- Figure 13: North America Swimming Pool and Spa Revenue Share (%), by Country 2024 & 2032
- Figure 14: North America Swimming Pool and Spa Volume Share (%), by Country 2024 & 2032
- Figure 15: South America Swimming Pool and Spa Revenue (million), by Application 2024 & 2032
- Figure 16: South America Swimming Pool and Spa Volume (K), by Application 2024 & 2032
- Figure 17: South America Swimming Pool and Spa Revenue Share (%), by Application 2024 & 2032
- Figure 18: South America Swimming Pool and Spa Volume Share (%), by Application 2024 & 2032
- Figure 19: South America Swimming Pool and Spa Revenue (million), by Types 2024 & 2032
- Figure 20: South America Swimming Pool and Spa Volume (K), by Types 2024 & 2032
- Figure 21: South America Swimming Pool and Spa Revenue Share (%), by Types 2024 & 2032
- Figure 22: South America Swimming Pool and Spa Volume Share (%), by Types 2024 & 2032
- Figure 23: South America Swimming Pool and Spa Revenue (million), by Country 2024 & 2032
- Figure 24: South America Swimming Pool and Spa Volume (K), by Country 2024 & 2032
- Figure 25: South America Swimming Pool and Spa Revenue Share (%), by Country 2024 & 2032
- Figure 26: South America Swimming Pool and Spa Volume Share (%), by Country 2024 & 2032
- Figure 27: Europe Swimming Pool and Spa Revenue (million), by Application 2024 & 2032
- Figure 28: Europe Swimming Pool and Spa Volume (K), by Application 2024 & 2032
- Figure 29: Europe Swimming Pool and Spa Revenue Share (%), by Application 2024 & 2032
- Figure 30: Europe Swimming Pool and Spa Volume Share (%), by Application 2024 & 2032
- Figure 31: Europe Swimming Pool and Spa Revenue (million), by Types 2024 & 2032
- Figure 32: Europe Swimming Pool and Spa Volume (K), by Types 2024 & 2032
- Figure 33: Europe Swimming Pool and Spa Revenue Share (%), by Types 2024 & 2032
- Figure 34: Europe Swimming Pool and Spa Volume Share (%), by Types 2024 & 2032
- Figure 35: Europe Swimming Pool and Spa Revenue (million), by Country 2024 & 2032
- Figure 36: Europe Swimming Pool and Spa Volume (K), by Country 2024 & 2032
- Figure 37: Europe Swimming Pool and Spa Revenue Share (%), by Country 2024 & 2032
- Figure 38: Europe Swimming Pool and Spa Volume Share (%), by Country 2024 & 2032
- Figure 39: Middle East & Africa Swimming Pool and Spa Revenue (million), by Application 2024 & 2032
- Figure 40: Middle East & Africa Swimming Pool and Spa Volume (K), by Application 2024 & 2032
- Figure 41: Middle East & Africa Swimming Pool and Spa Revenue Share (%), by Application 2024 & 2032
- Figure 42: Middle East & Africa Swimming Pool and Spa Volume Share (%), by Application 2024 & 2032
- Figure 43: Middle East & Africa Swimming Pool and Spa Revenue (million), by Types 2024 & 2032
- Figure 44: Middle East & Africa Swimming Pool and Spa Volume (K), by Types 2024 & 2032
- Figure 45: Middle East & Africa Swimming Pool and Spa Revenue Share (%), by Types 2024 & 2032
- Figure 46: Middle East & Africa Swimming Pool and Spa Volume Share (%), by Types 2024 & 2032
- Figure 47: Middle East & Africa Swimming Pool and Spa Revenue (million), by Country 2024 & 2032
- Figure 48: Middle East & Africa Swimming Pool and Spa Volume (K), by Country 2024 & 2032
- Figure 49: Middle East & Africa Swimming Pool and Spa Revenue Share (%), by Country 2024 & 2032
- Figure 50: Middle East & Africa Swimming Pool and Spa Volume Share (%), by Country 2024 & 2032
- Figure 51: Asia Pacific Swimming Pool and Spa Revenue (million), by Application 2024 & 2032
- Figure 52: Asia Pacific Swimming Pool and Spa Volume (K), by Application 2024 & 2032
- Figure 53: Asia Pacific Swimming Pool and Spa Revenue Share (%), by Application 2024 & 2032
- Figure 54: Asia Pacific Swimming Pool and Spa Volume Share (%), by Application 2024 & 2032
- Figure 55: Asia Pacific Swimming Pool and Spa Revenue (million), by Types 2024 & 2032
- Figure 56: Asia Pacific Swimming Pool and Spa Volume (K), by Types 2024 & 2032
- Figure 57: Asia Pacific Swimming Pool and Spa Revenue Share (%), by Types 2024 & 2032
- Figure 58: Asia Pacific Swimming Pool and Spa Volume Share (%), by Types 2024 & 2032
- Figure 59: Asia Pacific Swimming Pool and Spa Revenue (million), by Country 2024 & 2032
- Figure 60: Asia Pacific Swimming Pool and Spa Volume (K), by Country 2024 & 2032
- Figure 61: Asia Pacific Swimming Pool and Spa Revenue Share (%), by Country 2024 & 2032
- Figure 62: Asia Pacific Swimming Pool and Spa Volume Share (%), by Country 2024 & 2032
List of Tables
- Table 1: Global Swimming Pool and Spa Revenue million Forecast, by Region 2019 & 2032
- Table 2: Global Swimming Pool and Spa Volume K Forecast, by Region 2019 & 2032
- Table 3: Global Swimming Pool and Spa Revenue million Forecast, by Application 2019 & 2032
- Table 4: Global Swimming Pool and Spa Volume K Forecast, by Application 2019 & 2032
- Table 5: Global Swimming Pool and Spa Revenue million Forecast, by Types 2019 & 2032
- Table 6: Global Swimming Pool and Spa Volume K Forecast, by Types 2019 & 2032
- Table 7: Global Swimming Pool and Spa Revenue million Forecast, by Region 2019 & 2032
- Table 8: Global Swimming Pool and Spa Volume K Forecast, by Region 2019 & 2032
- Table 9: Global Swimming Pool and Spa Revenue million Forecast, by Application 2019 & 2032
- Table 10: Global Swimming Pool and Spa Volume K Forecast, by Application 2019 & 2032
- Table 11: Global Swimming Pool and Spa Revenue million Forecast, by Types 2019 & 2032
- Table 12: Global Swimming Pool and Spa Volume K Forecast, by Types 2019 & 2032
- Table 13: Global Swimming Pool and Spa Revenue million Forecast, by Country 2019 & 2032
- Table 14: Global Swimming Pool and Spa Volume K Forecast, by Country 2019 & 2032
- Table 15: United States Swimming Pool and Spa Revenue (million) Forecast, by Application 2019 & 2032
- Table 16: United States Swimming Pool and Spa Volume (K) Forecast, by Application 2019 & 2032
- Table 17: Canada Swimming Pool and Spa Revenue (million) Forecast, by Application 2019 & 2032
- Table 18: Canada Swimming Pool and Spa Volume (K) Forecast, by Application 2019 & 2032
- Table 19: Mexico Swimming Pool and Spa Revenue (million) Forecast, by Application 2019 & 2032
- Table 20: Mexico Swimming Pool and Spa Volume (K) Forecast, by Application 2019 & 2032
- Table 21: Global Swimming Pool and Spa Revenue million Forecast, by Application 2019 & 2032
- Table 22: Global Swimming Pool and Spa Volume K Forecast, by Application 2019 & 2032
- Table 23: Global Swimming Pool and Spa Revenue million Forecast, by Types 2019 & 2032
- Table 24: Global Swimming Pool and Spa Volume K Forecast, by Types 2019 & 2032
- Table 25: Global Swimming Pool and Spa Revenue million Forecast, by Country 2019 & 2032
- Table 26: Global Swimming Pool and Spa Volume K Forecast, by Country 2019 & 2032
- Table 27: Brazil Swimming Pool and Spa Revenue (million) Forecast, by Application 2019 & 2032
- Table 28: Brazil Swimming Pool and Spa Volume (K) Forecast, by Application 2019 & 2032
- Table 29: Argentina Swimming Pool and Spa Revenue (million) Forecast, by Application 2019 & 2032
- Table 30: Argentina Swimming Pool and Spa Volume (K) Forecast, by Application 2019 & 2032
- Table 31: Rest of South America Swimming Pool and Spa Revenue (million) Forecast, by Application 2019 & 2032
- Table 32: Rest of South America Swimming Pool and Spa Volume (K) Forecast, by Application 2019 & 2032
- Table 33: Global Swimming Pool and Spa Revenue million Forecast, by Application 2019 & 2032
- Table 34: Global Swimming Pool and Spa Volume K Forecast, by Application 2019 & 2032
- Table 35: Global Swimming Pool and Spa Revenue million Forecast, by Types 2019 & 2032
- Table 36: Global Swimming Pool and Spa Volume K Forecast, by Types 2019 & 2032
- Table 37: Global Swimming Pool and Spa Revenue million Forecast, by Country 2019 & 2032
- Table 38: Global Swimming Pool and Spa Volume K Forecast, by Country 2019 & 2032
- Table 39: United Kingdom Swimming Pool and Spa Revenue (million) Forecast, by Application 2019 & 2032
- Table 40: United Kingdom Swimming Pool and Spa Volume (K) Forecast, by Application 2019 & 2032
- Table 41: Germany Swimming Pool and Spa Revenue (million) Forecast, by Application 2019 & 2032
- Table 42: Germany Swimming Pool and Spa Volume (K) Forecast, by Application 2019 & 2032
- Table 43: France Swimming Pool and Spa Revenue (million) Forecast, by Application 2019 & 2032
- Table 44: France Swimming Pool and Spa Volume (K) Forecast, by Application 2019 & 2032
- Table 45: Italy Swimming Pool and Spa Revenue (million) Forecast, by Application 2019 & 2032
- Table 46: Italy Swimming Pool and Spa Volume (K) Forecast, by Application 2019 & 2032
- Table 47: Spain Swimming Pool and Spa Revenue (million) Forecast, by Application 2019 & 2032
- Table 48: Spain Swimming Pool and Spa Volume (K) Forecast, by Application 2019 & 2032
- Table 49: Russia Swimming Pool and Spa Revenue (million) Forecast, by Application 2019 & 2032
- Table 50: Russia Swimming Pool and Spa Volume (K) Forecast, by Application 2019 & 2032
- Table 51: Benelux Swimming Pool and Spa Revenue (million) Forecast, by Application 2019 & 2032
- Table 52: Benelux Swimming Pool and Spa Volume (K) Forecast, by Application 2019 & 2032
- Table 53: Nordics Swimming Pool and Spa Revenue (million) Forecast, by Application 2019 & 2032
- Table 54: Nordics Swimming Pool and Spa Volume (K) Forecast, by Application 2019 & 2032
- Table 55: Rest of Europe Swimming Pool and Spa Revenue (million) Forecast, by Application 2019 & 2032
- Table 56: Rest of Europe Swimming Pool and Spa Volume (K) Forecast, by Application 2019 & 2032
- Table 57: Global Swimming Pool and Spa Revenue million Forecast, by Application 2019 & 2032
- Table 58: Global Swimming Pool and Spa Volume K Forecast, by Application 2019 & 2032
- Table 59: Global Swimming Pool and Spa Revenue million Forecast, by Types 2019 & 2032
- Table 60: Global Swimming Pool and Spa Volume K Forecast, by Types 2019 & 2032
- Table 61: Global Swimming Pool and Spa Revenue million Forecast, by Country 2019 & 2032
- Table 62: Global Swimming Pool and Spa Volume K Forecast, by Country 2019 & 2032
- Table 63: Turkey Swimming Pool and Spa Revenue (million) Forecast, by Application 2019 & 2032
- Table 64: Turkey Swimming Pool and Spa Volume (K) Forecast, by Application 2019 & 2032
- Table 65: Israel Swimming Pool and Spa Revenue (million) Forecast, by Application 2019 & 2032
- Table 66: Israel Swimming Pool and Spa Volume (K) Forecast, by Application 2019 & 2032
- Table 67: GCC Swimming Pool and Spa Revenue (million) Forecast, by Application 2019 & 2032
- Table 68: GCC Swimming Pool and Spa Volume (K) Forecast, by Application 2019 & 2032
- Table 69: North Africa Swimming Pool and Spa Revenue (million) Forecast, by Application 2019 & 2032
- Table 70: North Africa Swimming Pool and Spa Volume (K) Forecast, by Application 2019 & 2032
- Table 71: South Africa Swimming Pool and Spa Revenue (million) Forecast, by Application 2019 & 2032
- Table 72: South Africa Swimming Pool and Spa Volume (K) Forecast, by Application 2019 & 2032
- Table 73: Rest of Middle East & Africa Swimming Pool and Spa Revenue (million) Forecast, by Application 2019 & 2032
- Table 74: Rest of Middle East & Africa Swimming Pool and Spa Volume (K) Forecast, by Application 2019 & 2032
- Table 75: Global Swimming Pool and Spa Revenue million Forecast, by Application 2019 & 2032
- Table 76: Global Swimming Pool and Spa Volume K Forecast, by Application 2019 & 2032
- Table 77: Global Swimming Pool and Spa Revenue million Forecast, by Types 2019 & 2032
- Table 78: Global Swimming Pool and Spa Volume K Forecast, by Types 2019 & 2032
- Table 79: Global Swimming Pool and Spa Revenue million Forecast, by Country 2019 & 2032
- Table 80: Global Swimming Pool and Spa Volume K Forecast, by Country 2019 & 2032
- Table 81: China Swimming Pool and Spa Revenue (million) Forecast, by Application 2019 & 2032
- Table 82: China Swimming Pool and Spa Volume (K) Forecast, by Application 2019 & 2032
- Table 83: India Swimming Pool and Spa Revenue (million) Forecast, by Application 2019 & 2032
- Table 84: India Swimming Pool and Spa Volume (K) Forecast, by Application 2019 & 2032
- Table 85: Japan Swimming Pool and Spa Revenue (million) Forecast, by Application 2019 & 2032
- Table 86: Japan Swimming Pool and Spa Volume (K) Forecast, by Application 2019 & 2032
- Table 87: South Korea Swimming Pool and Spa Revenue (million) Forecast, by Application 2019 & 2032
- Table 88: South Korea Swimming Pool and Spa Volume (K) Forecast, by Application 2019 & 2032
- Table 89: ASEAN Swimming Pool and Spa Revenue (million) Forecast, by Application 2019 & 2032
- Table 90: ASEAN Swimming Pool and Spa Volume (K) Forecast, by Application 2019 & 2032
- Table 91: Oceania Swimming Pool and Spa Revenue (million) Forecast, by Application 2019 & 2032
- Table 92: Oceania Swimming Pool and Spa Volume (K) Forecast, by Application 2019 & 2032
- Table 93: Rest of Asia Pacific Swimming Pool and Spa Revenue (million) Forecast, by Application 2019 & 2032
- Table 94: Rest of Asia Pacific Swimming Pool and Spa Volume (K) Forecast, by Application 2019 & 2032
Frequently Asked Questions
1. What is the projected Compound Annual Growth Rate (CAGR) of the Swimming Pool and Spa?
The projected CAGR is approximately XX%.
2. Which companies are prominent players in the Swimming Pool and Spa?
Key companies in the market include Beachcomber Hot Tubs, AKVO Spiralift, Coast Spas, Twinscape Group, Watkins Wellness, Roca Sanitario, Variopool Group, Bestway.
3. What are the main segments of the Swimming Pool and Spa?
The market segments include Application, Types.
4. Can you provide details about the market size?
The market size is estimated to be USD XXX million as of 2022.
5. What are some drivers contributing to market growth?
N/A
6. What are the notable trends driving market growth?
N/A
7. Are there any restraints impacting market growth?
N/A
8. Can you provide examples of recent developments in the market?
N/A
9. What pricing options are available for accessing the report?
Pricing options include single-user, multi-user, and enterprise licenses priced at USD 4350.00, USD 6525.00, and USD 8700.00 respectively.
10. Is the market size provided in terms of value or volume?
The market size is provided in terms of value, measured in million and volume, measured in K.
11. Are there any specific market keywords associated with the report?
Yes, the market keyword associated with the report is "Swimming Pool and Spa," which aids in identifying and referencing the specific market segment covered.
12. How do I determine which pricing option suits my needs best?
The pricing options vary based on user requirements and access needs. Individual users may opt for single-user licenses, while businesses requiring broader access may choose multi-user or enterprise licenses for cost-effective access to the report.
13. Are there any additional resources or data provided in the Swimming Pool and Spa report?
While the report offers comprehensive insights, it's advisable to review the specific contents or supplementary materials provided to ascertain if additional resources or data are available.
14. How can I stay updated on further developments or reports in the Swimming Pool and Spa?
To stay informed about further developments, trends, and reports in the Swimming Pool and Spa, consider subscribing to industry newsletters, following relevant companies and organizations, or regularly checking reputable industry news sources and publications.
Methodology
Step 1 - Identification of Relevant Samples Size from Population Database


Step 2 - Approaches for Defining Global Market Size (Value, Volume* & Price*)

Note*: In applicable scenarios
Step 3 - Data Sources
Primary Research
- Web Analytics
- Survey Reports
- Research Institute
- Latest Research Reports
- Opinion Leaders
Secondary Research
- Annual Reports
- White Paper
- Latest Press Release
- Industry Association
- Paid Database
- Investor Presentations

Step 4 - Data Triangulation
Involves using different sources of information in order to increase the validity of a study
These sources are likely to be stakeholders in a program - participants, other researchers, program staff, other community members, and so on.
Then we put all data in single framework & apply various statistical tools to find out the dynamic on the market.
During the analysis stage, feedback from the stakeholder groups would be compared to determine areas of agreement as well as areas of divergence


