
Key Insights
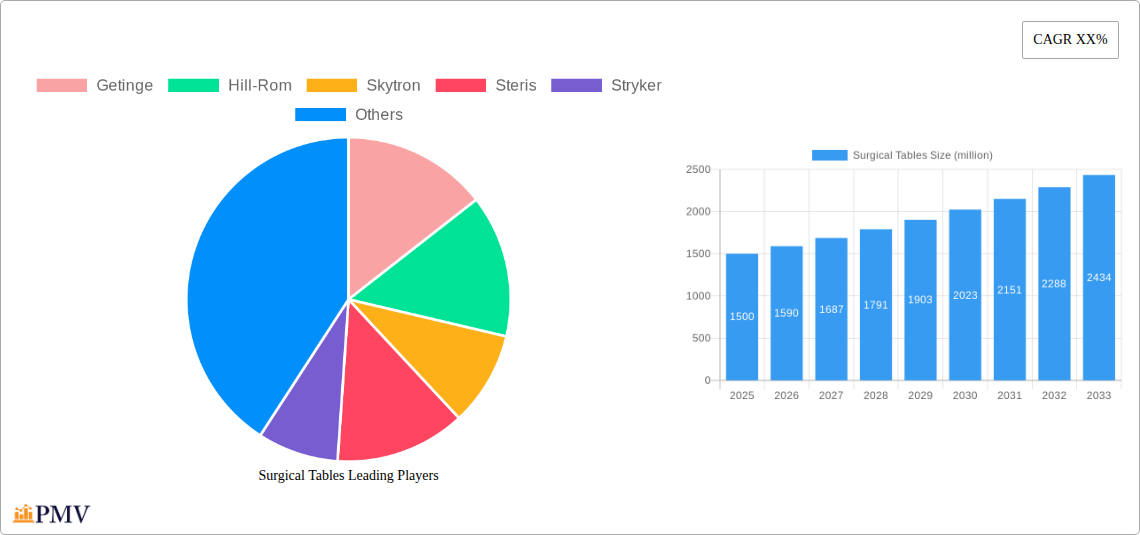
The global surgical tables market is experiencing robust growth, driven by several key factors. Technological advancements, such as the integration of advanced imaging capabilities, motorized adjustments for precise positioning, and enhanced patient comfort features, are significantly impacting market expansion. The rising prevalence of complex surgical procedures, coupled with an aging global population requiring more surgeries, fuels demand for sophisticated surgical tables. Furthermore, increasing healthcare expenditure and the expansion of modern healthcare infrastructure in developing economies contribute to the market's upward trajectory. The market is segmented by type (e.g., electric, hydraulic, manual), application (e.g., orthopedic, cardiovascular, neurosurgery), and end-user (e.g., hospitals, ambulatory surgical centers). Competitive intensity is moderate, with established players like Getinge, Hill-Rom, and Stryker holding significant market share. However, the emergence of innovative companies with technologically advanced products is increasing competition. While the market faces some restraints, such as high initial investment costs associated with advanced surgical tables and stringent regulatory approvals, these are outweighed by the significant growth drivers.
Looking ahead, the market is poised for continued expansion, primarily fueled by the ongoing development of minimally invasive surgical techniques and increasing adoption of robotic surgery. This trend necessitates the use of highly adaptable and technologically advanced surgical tables to support these procedures effectively. The market is also witnessing a shift towards modular and customizable surgical tables to meet the diverse needs of various surgical specialties. Regional variations in market growth are expected, with developed markets like North America and Europe exhibiting steady growth, while developing regions are anticipated to experience faster expansion due to increasing healthcare investments. Companies are increasingly focusing on strategic collaborations, mergers, and acquisitions to enhance their market presence and expand their product portfolios. Overall, the surgical tables market presents a promising investment opportunity with substantial growth potential in the coming years.
Surgical Tables Market Report: 2019-2033 - A Comprehensive Analysis of a Multi-Billion Dollar Industry
This comprehensive report provides a detailed analysis of the global surgical tables market, projecting a value exceeding $XX billion by 2033. The study period covers 2019-2033, with 2025 as the base and estimated year. The forecast period is 2025-2033, and the historical period analyzed is 2019-2024. This in-depth analysis will equip stakeholders with actionable insights, strategic recommendations, and a clear understanding of the market's evolving landscape.
Surgical Tables Market Structure & Competitive Dynamics
The global surgical tables market exhibits a moderately concentrated structure, with key players like Getinge, Hill-Rom, and Stryker commanding significant market share. The market's competitive dynamics are shaped by factors including continuous innovation in product design, technological advancements, stringent regulatory frameworks (e.g., FDA approvals), and the increasing prevalence of minimally invasive surgeries driving demand for specialized surgical tables. Substitutes, while limited, include adaptable operating room furniture, but specialized features of surgical tables maintain their dominance. End-user trends showcase a growing preference for advanced features like integrated imaging capabilities, enhanced ergonomics, and improved patient safety mechanisms. M&A activities in the sector have been moderate, with deal values averaging approximately $XX million annually over the past five years. This suggests a strategic focus on organic growth and technological advancements rather than large-scale acquisitions. Key players focus on expanding their product portfolios and geographical reach to maintain their competitive edge.
- Market Concentration: Moderately concentrated, with the top 5 players holding approximately XX% market share in 2024.
- Innovation Ecosystem: Robust, with significant investment in R&D focused on advanced materials, integrated technology, and enhanced ergonomics.
- Regulatory Landscape: Stringent, with compliance requirements influencing product development and market entry.
- M&A Activity: Moderate, with an average deal value of $XX million annually (2019-2024).
Surgical Tables Industry Trends & Insights
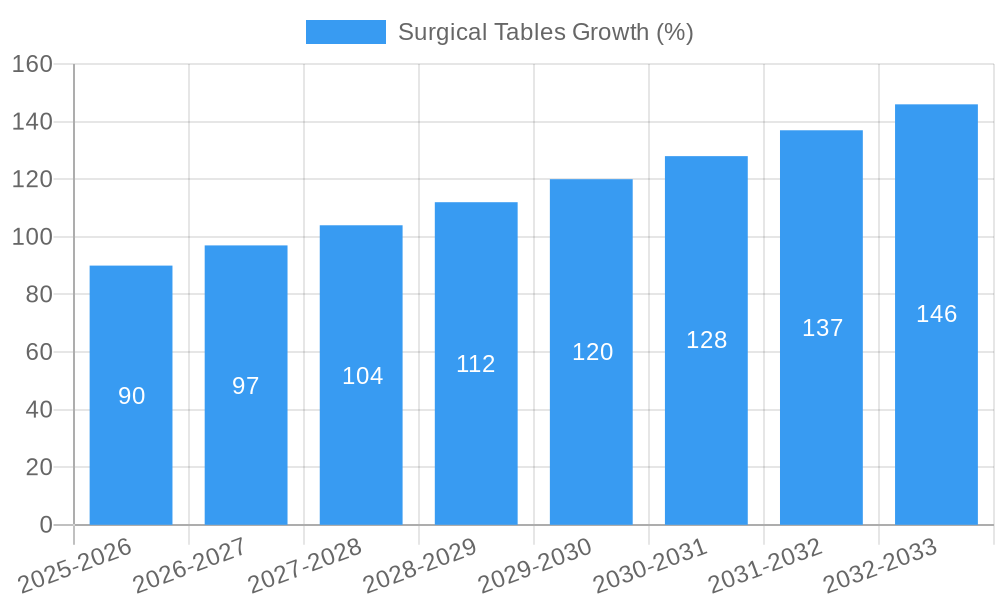
The global surgical tables market is experiencing robust growth, projected to achieve a CAGR of XX% during the forecast period (2025-2033). This growth is primarily driven by several factors including: the rising prevalence of chronic diseases, an aging global population requiring more surgical procedures, technological advancements leading to improved surgical outcomes and efficiency, and the increasing adoption of minimally invasive surgical techniques. Consumer preference leans towards advanced functionalities such as integrated imaging, improved ergonomics for surgical staff, and enhanced patient safety features. The market penetration rate of technologically advanced surgical tables is steadily increasing, reaching an estimated XX% in 2024 and projected to surpass XX% by 2033. Competitive dynamics are marked by continuous innovation, strategic partnerships, and geographic expansion.
Dominant Markets & Segments in Surgical Tables
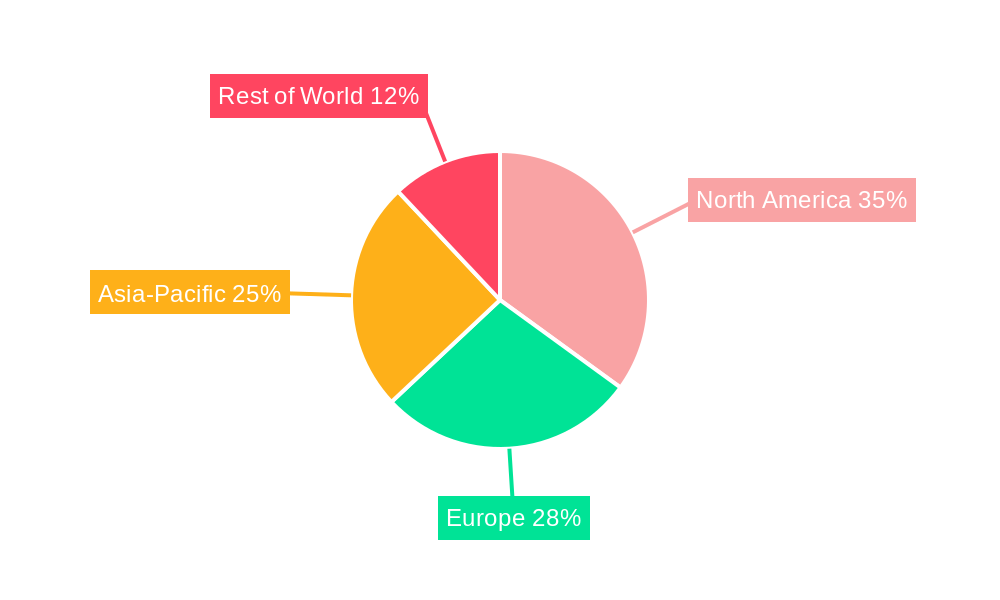
The North American region currently holds the largest market share in the surgical tables market, driven by factors including robust healthcare infrastructure, high healthcare expenditure, and a large number of surgical procedures performed annually. Within North America, the United States is the dominant market, followed by Canada. Key drivers contributing to this dominance include favorable government policies promoting healthcare innovation and access, a well-established distribution network, and a high concentration of leading surgical equipment manufacturers and research institutions.
- Key Drivers of North American Dominance:
- High healthcare expenditure per capita.
- Advanced healthcare infrastructure.
- Strong regulatory frameworks encouraging innovation.
- Large number of surgical procedures performed annually.
- High concentration of leading manufacturers and research institutions.
Europe is another key market, exhibiting significant growth, driven by increasing investment in healthcare infrastructure and technological advancements across several countries. The Asia-Pacific region is expected to witness the fastest growth in the coming years due to rising disposable income, increasing healthcare awareness, and expanding healthcare infrastructure across emerging economies.
Surgical Tables Product Innovations
Recent product innovations focus on enhanced ergonomics, improved patient safety, integration of advanced imaging technology, and modular designs for increased flexibility in various surgical settings. These innovations offer competitive advantages through improved surgical outcomes, reduced procedure times, and enhanced patient comfort. Technological trends point towards greater integration of digital technologies, such as AI-powered assistance and remote monitoring capabilities, further enhancing surgical precision and efficiency. Market fit is driven by the growing demand for sophisticated and versatile surgical tables catering to the needs of both surgeons and patients.
Report Segmentation & Scope
This report provides a detailed segmentation of the surgical tables market based on product type (e.g., orthopedic surgical tables, neurosurgical tables, laparoscopic surgical tables), application (e.g., general surgery, cardiovascular surgery, orthopedics), end-user (hospitals, ambulatory surgical centers), and geography (North America, Europe, Asia-Pacific, Rest of the World). Each segment's growth projections, market size, and competitive dynamics are thoroughly analyzed. For instance, the orthopedic surgical tables segment is projected to hold a significant market share due to the increasing prevalence of orthopedic surgeries. The growth of ambulatory surgical centers is expected to drive the growth of the segment related to these end users.
Key Drivers of Surgical Tables Growth
The surgical tables market is propelled by several key factors. The increasing prevalence of chronic diseases leading to a higher demand for surgical procedures is a primary driver. Technological advancements, such as the integration of imaging and robotic systems, enhance surgical precision and efficiency, further fueling market growth. Furthermore, supportive government regulations and initiatives aimed at improving healthcare infrastructure contribute to market expansion. Finally, the rising disposable income and increased healthcare awareness in emerging economies are further boosting demand for advanced surgical equipment, including surgical tables.
Challenges in the Surgical Tables Sector
The surgical tables market faces challenges including stringent regulatory hurdles for product approval, fluctuations in raw material costs impacting production costs, and intense competition from established and emerging players. Supply chain disruptions can affect the availability of components and increase manufacturing costs. These factors combined can influence market pricing and profitability for companies operating within the sector. The quantifiable impact of these challenges is estimated to constrain market growth by approximately XX% annually during the forecast period.
Leading Players in the Surgical Tables Market
- Getinge
- Hill-Rom
- Skytron
- Steris
- Stryker
- Mizuho
- Alvo
- Ufsk-Osys
- Medifa-hesse
- BiHealthcare
- AGA Sanitatsartikel
- Lojer
- Schmitz u. Sohne
- Schaerer Medical
- Brumaba
- Bender
- Merivaara
- Infinium Medical
- Image Diagnostics
- Mindray Medical
- Shanghai Pax Medical Instrument
Key Developments in Surgical Tables Sector
- 2022 Q4: Stryker launched a new line of surgical tables with enhanced imaging capabilities.
- 2023 Q1: Getinge acquired a smaller competitor specializing in minimally invasive surgical tables.
- 2023 Q3: Hill-Rom announced a strategic partnership to integrate AI-powered assistance into their surgical tables.
- 2024 Q2: Several companies introduced new modular surgical tables for enhanced flexibility. (Further specific developments can be added as data becomes available).
Strategic Surgical Tables Market Outlook
The surgical tables market presents significant growth potential driven by continued technological advancements, expanding healthcare infrastructure globally, and the increasing demand for sophisticated surgical procedures. Strategic opportunities exist for companies focusing on innovative product development, strategic partnerships, and expansion into emerging markets. A focus on incorporating digital technologies, enhancing ergonomics, and improving patient safety will be critical for achieving a competitive edge. The market's future outlook remains positive, with substantial growth anticipated throughout the forecast period.
Surgical Tables Segmentation
-
1. Application
- 1.1. Hospital
- 1.2. Emergency Center
- 1.3. Clinic
- 1.4. Educational Institution
- 1.5. Other
-
2. Types
- 2.1. General Surgery Tables
- 2.2. Imaging Tables
- 2.3. Neurology Tables
- 2.4. Orthopedic Tables
- 2.5. Otheer
Surgical Tables Segmentation By Geography
-
1. North America
- 1.1. United States
- 1.2. Canada
- 1.3. Mexico
-
2. South America
- 2.1. Brazil
- 2.2. Argentina
- 2.3. Rest of South America
-
3. Europe
- 3.1. United Kingdom
- 3.2. Germany
- 3.3. France
- 3.4. Italy
- 3.5. Spain
- 3.6. Russia
- 3.7. Benelux
- 3.8. Nordics
- 3.9. Rest of Europe
-
4. Middle East & Africa
- 4.1. Turkey
- 4.2. Israel
- 4.3. GCC
- 4.4. North Africa
- 4.5. South Africa
- 4.6. Rest of Middle East & Africa
-
5. Asia Pacific
- 5.1. China
- 5.2. India
- 5.3. Japan
- 5.4. South Korea
- 5.5. ASEAN
- 5.6. Oceania
- 5.7. Rest of Asia Pacific
Surgical Tables REPORT HIGHLIGHTS
| Aspects | Details |
|---|---|
| Study Period | 2019-2033 |
| Base Year | 2024 |
| Estimated Year | 2025 |
| Forecast Period | 2025-2033 |
| Historical Period | 2019-2024 |
| Growth Rate | CAGR of XX% from 2019-2033 |
| Segmentation |
|
Table of Contents
- 1. Introduction
- 1.1. Research Scope
- 1.2. Market Segmentation
- 1.3. Research Methodology
- 1.4. Definitions and Assumptions
- 2. Executive Summary
- 2.1. Introduction
- 3. Market Dynamics
- 3.1. Introduction
- 3.2. Market Drivers
- 3.3. Market Restrains
- 3.4. Market Trends
- 4. Market Factor Analysis
- 4.1. Porters Five Forces
- 4.2. Supply/Value Chain
- 4.3. PESTEL analysis
- 4.4. Market Entropy
- 4.5. Patent/Trademark Analysis
- 5. Global Surgical Tables Analysis, Insights and Forecast, 2019-2031
- 5.1. Market Analysis, Insights and Forecast - by Application
- 5.1.1. Hospital
- 5.1.2. Emergency Center
- 5.1.3. Clinic
- 5.1.4. Educational Institution
- 5.1.5. Other
- 5.2. Market Analysis, Insights and Forecast - by Types
- 5.2.1. General Surgery Tables
- 5.2.2. Imaging Tables
- 5.2.3. Neurology Tables
- 5.2.4. Orthopedic Tables
- 5.2.5. Otheer
- 5.3. Market Analysis, Insights and Forecast - by Region
- 5.3.1. North America
- 5.3.2. South America
- 5.3.3. Europe
- 5.3.4. Middle East & Africa
- 5.3.5. Asia Pacific
- 5.1. Market Analysis, Insights and Forecast - by Application
- 6. North America Surgical Tables Analysis, Insights and Forecast, 2019-2031
- 6.1. Market Analysis, Insights and Forecast - by Application
- 6.1.1. Hospital
- 6.1.2. Emergency Center
- 6.1.3. Clinic
- 6.1.4. Educational Institution
- 6.1.5. Other
- 6.2. Market Analysis, Insights and Forecast - by Types
- 6.2.1. General Surgery Tables
- 6.2.2. Imaging Tables
- 6.2.3. Neurology Tables
- 6.2.4. Orthopedic Tables
- 6.2.5. Otheer
- 6.1. Market Analysis, Insights and Forecast - by Application
- 7. South America Surgical Tables Analysis, Insights and Forecast, 2019-2031
- 7.1. Market Analysis, Insights and Forecast - by Application
- 7.1.1. Hospital
- 7.1.2. Emergency Center
- 7.1.3. Clinic
- 7.1.4. Educational Institution
- 7.1.5. Other
- 7.2. Market Analysis, Insights and Forecast - by Types
- 7.2.1. General Surgery Tables
- 7.2.2. Imaging Tables
- 7.2.3. Neurology Tables
- 7.2.4. Orthopedic Tables
- 7.2.5. Otheer
- 7.1. Market Analysis, Insights and Forecast - by Application
- 8. Europe Surgical Tables Analysis, Insights and Forecast, 2019-2031
- 8.1. Market Analysis, Insights and Forecast - by Application
- 8.1.1. Hospital
- 8.1.2. Emergency Center
- 8.1.3. Clinic
- 8.1.4. Educational Institution
- 8.1.5. Other
- 8.2. Market Analysis, Insights and Forecast - by Types
- 8.2.1. General Surgery Tables
- 8.2.2. Imaging Tables
- 8.2.3. Neurology Tables
- 8.2.4. Orthopedic Tables
- 8.2.5. Otheer
- 8.1. Market Analysis, Insights and Forecast - by Application
- 9. Middle East & Africa Surgical Tables Analysis, Insights and Forecast, 2019-2031
- 9.1. Market Analysis, Insights and Forecast - by Application
- 9.1.1. Hospital
- 9.1.2. Emergency Center
- 9.1.3. Clinic
- 9.1.4. Educational Institution
- 9.1.5. Other
- 9.2. Market Analysis, Insights and Forecast - by Types
- 9.2.1. General Surgery Tables
- 9.2.2. Imaging Tables
- 9.2.3. Neurology Tables
- 9.2.4. Orthopedic Tables
- 9.2.5. Otheer
- 9.1. Market Analysis, Insights and Forecast - by Application
- 10. Asia Pacific Surgical Tables Analysis, Insights and Forecast, 2019-2031
- 10.1. Market Analysis, Insights and Forecast - by Application
- 10.1.1. Hospital
- 10.1.2. Emergency Center
- 10.1.3. Clinic
- 10.1.4. Educational Institution
- 10.1.5. Other
- 10.2. Market Analysis, Insights and Forecast - by Types
- 10.2.1. General Surgery Tables
- 10.2.2. Imaging Tables
- 10.2.3. Neurology Tables
- 10.2.4. Orthopedic Tables
- 10.2.5. Otheer
- 10.1. Market Analysis, Insights and Forecast - by Application
- 11. Competitive Analysis
- 11.1. Global Market Share Analysis 2024
- 11.2. Company Profiles
- 11.2.1 Getinge
- 11.2.1.1. Overview
- 11.2.1.2. Products
- 11.2.1.3. SWOT Analysis
- 11.2.1.4. Recent Developments
- 11.2.1.5. Financials (Based on Availability)
- 11.2.2 Hill-Rom
- 11.2.2.1. Overview
- 11.2.2.2. Products
- 11.2.2.3. SWOT Analysis
- 11.2.2.4. Recent Developments
- 11.2.2.5. Financials (Based on Availability)
- 11.2.3 Skytron
- 11.2.3.1. Overview
- 11.2.3.2. Products
- 11.2.3.3. SWOT Analysis
- 11.2.3.4. Recent Developments
- 11.2.3.5. Financials (Based on Availability)
- 11.2.4 Steris
- 11.2.4.1. Overview
- 11.2.4.2. Products
- 11.2.4.3. SWOT Analysis
- 11.2.4.4. Recent Developments
- 11.2.4.5. Financials (Based on Availability)
- 11.2.5 Stryker
- 11.2.5.1. Overview
- 11.2.5.2. Products
- 11.2.5.3. SWOT Analysis
- 11.2.5.4. Recent Developments
- 11.2.5.5. Financials (Based on Availability)
- 11.2.6 Mizuho
- 11.2.6.1. Overview
- 11.2.6.2. Products
- 11.2.6.3. SWOT Analysis
- 11.2.6.4. Recent Developments
- 11.2.6.5. Financials (Based on Availability)
- 11.2.7 Alvo
- 11.2.7.1. Overview
- 11.2.7.2. Products
- 11.2.7.3. SWOT Analysis
- 11.2.7.4. Recent Developments
- 11.2.7.5. Financials (Based on Availability)
- 11.2.8 Ufsk-Osys
- 11.2.8.1. Overview
- 11.2.8.2. Products
- 11.2.8.3. SWOT Analysis
- 11.2.8.4. Recent Developments
- 11.2.8.5. Financials (Based on Availability)
- 11.2.9 Medifa-hesse
- 11.2.9.1. Overview
- 11.2.9.2. Products
- 11.2.9.3. SWOT Analysis
- 11.2.9.4. Recent Developments
- 11.2.9.5. Financials (Based on Availability)
- 11.2.10 BiHealthcare
- 11.2.10.1. Overview
- 11.2.10.2. Products
- 11.2.10.3. SWOT Analysis
- 11.2.10.4. Recent Developments
- 11.2.10.5. Financials (Based on Availability)
- 11.2.11 AGA Sanitatsartikel
- 11.2.11.1. Overview
- 11.2.11.2. Products
- 11.2.11.3. SWOT Analysis
- 11.2.11.4. Recent Developments
- 11.2.11.5. Financials (Based on Availability)
- 11.2.12 Lojer
- 11.2.12.1. Overview
- 11.2.12.2. Products
- 11.2.12.3. SWOT Analysis
- 11.2.12.4. Recent Developments
- 11.2.12.5. Financials (Based on Availability)
- 11.2.13 Schmitz u. Sohne
- 11.2.13.1. Overview
- 11.2.13.2. Products
- 11.2.13.3. SWOT Analysis
- 11.2.13.4. Recent Developments
- 11.2.13.5. Financials (Based on Availability)
- 11.2.14 Schaerer Medical
- 11.2.14.1. Overview
- 11.2.14.2. Products
- 11.2.14.3. SWOT Analysis
- 11.2.14.4. Recent Developments
- 11.2.14.5. Financials (Based on Availability)
- 11.2.15 Brumaba
- 11.2.15.1. Overview
- 11.2.15.2. Products
- 11.2.15.3. SWOT Analysis
- 11.2.15.4. Recent Developments
- 11.2.15.5. Financials (Based on Availability)
- 11.2.16 Bender
- 11.2.16.1. Overview
- 11.2.16.2. Products
- 11.2.16.3. SWOT Analysis
- 11.2.16.4. Recent Developments
- 11.2.16.5. Financials (Based on Availability)
- 11.2.17 Merivaara
- 11.2.17.1. Overview
- 11.2.17.2. Products
- 11.2.17.3. SWOT Analysis
- 11.2.17.4. Recent Developments
- 11.2.17.5. Financials (Based on Availability)
- 11.2.18 Infinium Medical
- 11.2.18.1. Overview
- 11.2.18.2. Products
- 11.2.18.3. SWOT Analysis
- 11.2.18.4. Recent Developments
- 11.2.18.5. Financials (Based on Availability)
- 11.2.19 Image Diagnostics
- 11.2.19.1. Overview
- 11.2.19.2. Products
- 11.2.19.3. SWOT Analysis
- 11.2.19.4. Recent Developments
- 11.2.19.5. Financials (Based on Availability)
- 11.2.20 Mindray Medical
- 11.2.20.1. Overview
- 11.2.20.2. Products
- 11.2.20.3. SWOT Analysis
- 11.2.20.4. Recent Developments
- 11.2.20.5. Financials (Based on Availability)
- 11.2.21 Shanghai Pax Medical Instrument
- 11.2.21.1. Overview
- 11.2.21.2. Products
- 11.2.21.3. SWOT Analysis
- 11.2.21.4. Recent Developments
- 11.2.21.5. Financials (Based on Availability)
- 11.2.1 Getinge
List of Figures
- Figure 1: Global Surgical Tables Revenue Breakdown (million, %) by Region 2024 & 2032
- Figure 2: Global Surgical Tables Volume Breakdown (K, %) by Region 2024 & 2032
- Figure 3: North America Surgical Tables Revenue (million), by Application 2024 & 2032
- Figure 4: North America Surgical Tables Volume (K), by Application 2024 & 2032
- Figure 5: North America Surgical Tables Revenue Share (%), by Application 2024 & 2032
- Figure 6: North America Surgical Tables Volume Share (%), by Application 2024 & 2032
- Figure 7: North America Surgical Tables Revenue (million), by Types 2024 & 2032
- Figure 8: North America Surgical Tables Volume (K), by Types 2024 & 2032
- Figure 9: North America Surgical Tables Revenue Share (%), by Types 2024 & 2032
- Figure 10: North America Surgical Tables Volume Share (%), by Types 2024 & 2032
- Figure 11: North America Surgical Tables Revenue (million), by Country 2024 & 2032
- Figure 12: North America Surgical Tables Volume (K), by Country 2024 & 2032
- Figure 13: North America Surgical Tables Revenue Share (%), by Country 2024 & 2032
- Figure 14: North America Surgical Tables Volume Share (%), by Country 2024 & 2032
- Figure 15: South America Surgical Tables Revenue (million), by Application 2024 & 2032
- Figure 16: South America Surgical Tables Volume (K), by Application 2024 & 2032
- Figure 17: South America Surgical Tables Revenue Share (%), by Application 2024 & 2032
- Figure 18: South America Surgical Tables Volume Share (%), by Application 2024 & 2032
- Figure 19: South America Surgical Tables Revenue (million), by Types 2024 & 2032
- Figure 20: South America Surgical Tables Volume (K), by Types 2024 & 2032
- Figure 21: South America Surgical Tables Revenue Share (%), by Types 2024 & 2032
- Figure 22: South America Surgical Tables Volume Share (%), by Types 2024 & 2032
- Figure 23: South America Surgical Tables Revenue (million), by Country 2024 & 2032
- Figure 24: South America Surgical Tables Volume (K), by Country 2024 & 2032
- Figure 25: South America Surgical Tables Revenue Share (%), by Country 2024 & 2032
- Figure 26: South America Surgical Tables Volume Share (%), by Country 2024 & 2032
- Figure 27: Europe Surgical Tables Revenue (million), by Application 2024 & 2032
- Figure 28: Europe Surgical Tables Volume (K), by Application 2024 & 2032
- Figure 29: Europe Surgical Tables Revenue Share (%), by Application 2024 & 2032
- Figure 30: Europe Surgical Tables Volume Share (%), by Application 2024 & 2032
- Figure 31: Europe Surgical Tables Revenue (million), by Types 2024 & 2032
- Figure 32: Europe Surgical Tables Volume (K), by Types 2024 & 2032
- Figure 33: Europe Surgical Tables Revenue Share (%), by Types 2024 & 2032
- Figure 34: Europe Surgical Tables Volume Share (%), by Types 2024 & 2032
- Figure 35: Europe Surgical Tables Revenue (million), by Country 2024 & 2032
- Figure 36: Europe Surgical Tables Volume (K), by Country 2024 & 2032
- Figure 37: Europe Surgical Tables Revenue Share (%), by Country 2024 & 2032
- Figure 38: Europe Surgical Tables Volume Share (%), by Country 2024 & 2032
- Figure 39: Middle East & Africa Surgical Tables Revenue (million), by Application 2024 & 2032
- Figure 40: Middle East & Africa Surgical Tables Volume (K), by Application 2024 & 2032
- Figure 41: Middle East & Africa Surgical Tables Revenue Share (%), by Application 2024 & 2032
- Figure 42: Middle East & Africa Surgical Tables Volume Share (%), by Application 2024 & 2032
- Figure 43: Middle East & Africa Surgical Tables Revenue (million), by Types 2024 & 2032
- Figure 44: Middle East & Africa Surgical Tables Volume (K), by Types 2024 & 2032
- Figure 45: Middle East & Africa Surgical Tables Revenue Share (%), by Types 2024 & 2032
- Figure 46: Middle East & Africa Surgical Tables Volume Share (%), by Types 2024 & 2032
- Figure 47: Middle East & Africa Surgical Tables Revenue (million), by Country 2024 & 2032
- Figure 48: Middle East & Africa Surgical Tables Volume (K), by Country 2024 & 2032
- Figure 49: Middle East & Africa Surgical Tables Revenue Share (%), by Country 2024 & 2032
- Figure 50: Middle East & Africa Surgical Tables Volume Share (%), by Country 2024 & 2032
- Figure 51: Asia Pacific Surgical Tables Revenue (million), by Application 2024 & 2032
- Figure 52: Asia Pacific Surgical Tables Volume (K), by Application 2024 & 2032
- Figure 53: Asia Pacific Surgical Tables Revenue Share (%), by Application 2024 & 2032
- Figure 54: Asia Pacific Surgical Tables Volume Share (%), by Application 2024 & 2032
- Figure 55: Asia Pacific Surgical Tables Revenue (million), by Types 2024 & 2032
- Figure 56: Asia Pacific Surgical Tables Volume (K), by Types 2024 & 2032
- Figure 57: Asia Pacific Surgical Tables Revenue Share (%), by Types 2024 & 2032
- Figure 58: Asia Pacific Surgical Tables Volume Share (%), by Types 2024 & 2032
- Figure 59: Asia Pacific Surgical Tables Revenue (million), by Country 2024 & 2032
- Figure 60: Asia Pacific Surgical Tables Volume (K), by Country 2024 & 2032
- Figure 61: Asia Pacific Surgical Tables Revenue Share (%), by Country 2024 & 2032
- Figure 62: Asia Pacific Surgical Tables Volume Share (%), by Country 2024 & 2032
List of Tables
- Table 1: Global Surgical Tables Revenue million Forecast, by Region 2019 & 2032
- Table 2: Global Surgical Tables Volume K Forecast, by Region 2019 & 2032
- Table 3: Global Surgical Tables Revenue million Forecast, by Application 2019 & 2032
- Table 4: Global Surgical Tables Volume K Forecast, by Application 2019 & 2032
- Table 5: Global Surgical Tables Revenue million Forecast, by Types 2019 & 2032
- Table 6: Global Surgical Tables Volume K Forecast, by Types 2019 & 2032
- Table 7: Global Surgical Tables Revenue million Forecast, by Region 2019 & 2032
- Table 8: Global Surgical Tables Volume K Forecast, by Region 2019 & 2032
- Table 9: Global Surgical Tables Revenue million Forecast, by Application 2019 & 2032
- Table 10: Global Surgical Tables Volume K Forecast, by Application 2019 & 2032
- Table 11: Global Surgical Tables Revenue million Forecast, by Types 2019 & 2032
- Table 12: Global Surgical Tables Volume K Forecast, by Types 2019 & 2032
- Table 13: Global Surgical Tables Revenue million Forecast, by Country 2019 & 2032
- Table 14: Global Surgical Tables Volume K Forecast, by Country 2019 & 2032
- Table 15: United States Surgical Tables Revenue (million) Forecast, by Application 2019 & 2032
- Table 16: United States Surgical Tables Volume (K) Forecast, by Application 2019 & 2032
- Table 17: Canada Surgical Tables Revenue (million) Forecast, by Application 2019 & 2032
- Table 18: Canada Surgical Tables Volume (K) Forecast, by Application 2019 & 2032
- Table 19: Mexico Surgical Tables Revenue (million) Forecast, by Application 2019 & 2032
- Table 20: Mexico Surgical Tables Volume (K) Forecast, by Application 2019 & 2032
- Table 21: Global Surgical Tables Revenue million Forecast, by Application 2019 & 2032
- Table 22: Global Surgical Tables Volume K Forecast, by Application 2019 & 2032
- Table 23: Global Surgical Tables Revenue million Forecast, by Types 2019 & 2032
- Table 24: Global Surgical Tables Volume K Forecast, by Types 2019 & 2032
- Table 25: Global Surgical Tables Revenue million Forecast, by Country 2019 & 2032
- Table 26: Global Surgical Tables Volume K Forecast, by Country 2019 & 2032
- Table 27: Brazil Surgical Tables Revenue (million) Forecast, by Application 2019 & 2032
- Table 28: Brazil Surgical Tables Volume (K) Forecast, by Application 2019 & 2032
- Table 29: Argentina Surgical Tables Revenue (million) Forecast, by Application 2019 & 2032
- Table 30: Argentina Surgical Tables Volume (K) Forecast, by Application 2019 & 2032
- Table 31: Rest of South America Surgical Tables Revenue (million) Forecast, by Application 2019 & 2032
- Table 32: Rest of South America Surgical Tables Volume (K) Forecast, by Application 2019 & 2032
- Table 33: Global Surgical Tables Revenue million Forecast, by Application 2019 & 2032
- Table 34: Global Surgical Tables Volume K Forecast, by Application 2019 & 2032
- Table 35: Global Surgical Tables Revenue million Forecast, by Types 2019 & 2032
- Table 36: Global Surgical Tables Volume K Forecast, by Types 2019 & 2032
- Table 37: Global Surgical Tables Revenue million Forecast, by Country 2019 & 2032
- Table 38: Global Surgical Tables Volume K Forecast, by Country 2019 & 2032
- Table 39: United Kingdom Surgical Tables Revenue (million) Forecast, by Application 2019 & 2032
- Table 40: United Kingdom Surgical Tables Volume (K) Forecast, by Application 2019 & 2032
- Table 41: Germany Surgical Tables Revenue (million) Forecast, by Application 2019 & 2032
- Table 42: Germany Surgical Tables Volume (K) Forecast, by Application 2019 & 2032
- Table 43: France Surgical Tables Revenue (million) Forecast, by Application 2019 & 2032
- Table 44: France Surgical Tables Volume (K) Forecast, by Application 2019 & 2032
- Table 45: Italy Surgical Tables Revenue (million) Forecast, by Application 2019 & 2032
- Table 46: Italy Surgical Tables Volume (K) Forecast, by Application 2019 & 2032
- Table 47: Spain Surgical Tables Revenue (million) Forecast, by Application 2019 & 2032
- Table 48: Spain Surgical Tables Volume (K) Forecast, by Application 2019 & 2032
- Table 49: Russia Surgical Tables Revenue (million) Forecast, by Application 2019 & 2032
- Table 50: Russia Surgical Tables Volume (K) Forecast, by Application 2019 & 2032
- Table 51: Benelux Surgical Tables Revenue (million) Forecast, by Application 2019 & 2032
- Table 52: Benelux Surgical Tables Volume (K) Forecast, by Application 2019 & 2032
- Table 53: Nordics Surgical Tables Revenue (million) Forecast, by Application 2019 & 2032
- Table 54: Nordics Surgical Tables Volume (K) Forecast, by Application 2019 & 2032
- Table 55: Rest of Europe Surgical Tables Revenue (million) Forecast, by Application 2019 & 2032
- Table 56: Rest of Europe Surgical Tables Volume (K) Forecast, by Application 2019 & 2032
- Table 57: Global Surgical Tables Revenue million Forecast, by Application 2019 & 2032
- Table 58: Global Surgical Tables Volume K Forecast, by Application 2019 & 2032
- Table 59: Global Surgical Tables Revenue million Forecast, by Types 2019 & 2032
- Table 60: Global Surgical Tables Volume K Forecast, by Types 2019 & 2032
- Table 61: Global Surgical Tables Revenue million Forecast, by Country 2019 & 2032
- Table 62: Global Surgical Tables Volume K Forecast, by Country 2019 & 2032
- Table 63: Turkey Surgical Tables Revenue (million) Forecast, by Application 2019 & 2032
- Table 64: Turkey Surgical Tables Volume (K) Forecast, by Application 2019 & 2032
- Table 65: Israel Surgical Tables Revenue (million) Forecast, by Application 2019 & 2032
- Table 66: Israel Surgical Tables Volume (K) Forecast, by Application 2019 & 2032
- Table 67: GCC Surgical Tables Revenue (million) Forecast, by Application 2019 & 2032
- Table 68: GCC Surgical Tables Volume (K) Forecast, by Application 2019 & 2032
- Table 69: North Africa Surgical Tables Revenue (million) Forecast, by Application 2019 & 2032
- Table 70: North Africa Surgical Tables Volume (K) Forecast, by Application 2019 & 2032
- Table 71: South Africa Surgical Tables Revenue (million) Forecast, by Application 2019 & 2032
- Table 72: South Africa Surgical Tables Volume (K) Forecast, by Application 2019 & 2032
- Table 73: Rest of Middle East & Africa Surgical Tables Revenue (million) Forecast, by Application 2019 & 2032
- Table 74: Rest of Middle East & Africa Surgical Tables Volume (K) Forecast, by Application 2019 & 2032
- Table 75: Global Surgical Tables Revenue million Forecast, by Application 2019 & 2032
- Table 76: Global Surgical Tables Volume K Forecast, by Application 2019 & 2032
- Table 77: Global Surgical Tables Revenue million Forecast, by Types 2019 & 2032
- Table 78: Global Surgical Tables Volume K Forecast, by Types 2019 & 2032
- Table 79: Global Surgical Tables Revenue million Forecast, by Country 2019 & 2032
- Table 80: Global Surgical Tables Volume K Forecast, by Country 2019 & 2032
- Table 81: China Surgical Tables Revenue (million) Forecast, by Application 2019 & 2032
- Table 82: China Surgical Tables Volume (K) Forecast, by Application 2019 & 2032
- Table 83: India Surgical Tables Revenue (million) Forecast, by Application 2019 & 2032
- Table 84: India Surgical Tables Volume (K) Forecast, by Application 2019 & 2032
- Table 85: Japan Surgical Tables Revenue (million) Forecast, by Application 2019 & 2032
- Table 86: Japan Surgical Tables Volume (K) Forecast, by Application 2019 & 2032
- Table 87: South Korea Surgical Tables Revenue (million) Forecast, by Application 2019 & 2032
- Table 88: South Korea Surgical Tables Volume (K) Forecast, by Application 2019 & 2032
- Table 89: ASEAN Surgical Tables Revenue (million) Forecast, by Application 2019 & 2032
- Table 90: ASEAN Surgical Tables Volume (K) Forecast, by Application 2019 & 2032
- Table 91: Oceania Surgical Tables Revenue (million) Forecast, by Application 2019 & 2032
- Table 92: Oceania Surgical Tables Volume (K) Forecast, by Application 2019 & 2032
- Table 93: Rest of Asia Pacific Surgical Tables Revenue (million) Forecast, by Application 2019 & 2032
- Table 94: Rest of Asia Pacific Surgical Tables Volume (K) Forecast, by Application 2019 & 2032
Frequently Asked Questions
1. What is the projected Compound Annual Growth Rate (CAGR) of the Surgical Tables?
The projected CAGR is approximately XX%.
2. Which companies are prominent players in the Surgical Tables?
Key companies in the market include Getinge, Hill-Rom, Skytron, Steris, Stryker, Mizuho, Alvo, Ufsk-Osys, Medifa-hesse, BiHealthcare, AGA Sanitatsartikel, Lojer, Schmitz u. Sohne, Schaerer Medical, Brumaba, Bender, Merivaara, Infinium Medical, Image Diagnostics, Mindray Medical, Shanghai Pax Medical Instrument.
3. What are the main segments of the Surgical Tables?
The market segments include Application, Types.
4. Can you provide details about the market size?
The market size is estimated to be USD XXX million as of 2022.
5. What are some drivers contributing to market growth?
N/A
6. What are the notable trends driving market growth?
N/A
7. Are there any restraints impacting market growth?
N/A
8. Can you provide examples of recent developments in the market?
N/A
9. What pricing options are available for accessing the report?
Pricing options include single-user, multi-user, and enterprise licenses priced at USD 3350.00, USD 5025.00, and USD 6700.00 respectively.
10. Is the market size provided in terms of value or volume?
The market size is provided in terms of value, measured in million and volume, measured in K.
11. Are there any specific market keywords associated with the report?
Yes, the market keyword associated with the report is "Surgical Tables," which aids in identifying and referencing the specific market segment covered.
12. How do I determine which pricing option suits my needs best?
The pricing options vary based on user requirements and access needs. Individual users may opt for single-user licenses, while businesses requiring broader access may choose multi-user or enterprise licenses for cost-effective access to the report.
13. Are there any additional resources or data provided in the Surgical Tables report?
While the report offers comprehensive insights, it's advisable to review the specific contents or supplementary materials provided to ascertain if additional resources or data are available.
14. How can I stay updated on further developments or reports in the Surgical Tables?
To stay informed about further developments, trends, and reports in the Surgical Tables, consider subscribing to industry newsletters, following relevant companies and organizations, or regularly checking reputable industry news sources and publications.
Methodology
Step 1 - Identification of Relevant Samples Size from Population Database


Step 2 - Approaches for Defining Global Market Size (Value, Volume* & Price*)

Note*: In applicable scenarios
Step 3 - Data Sources
Primary Research
- Web Analytics
- Survey Reports
- Research Institute
- Latest Research Reports
- Opinion Leaders
Secondary Research
- Annual Reports
- White Paper
- Latest Press Release
- Industry Association
- Paid Database
- Investor Presentations

Step 4 - Data Triangulation
Involves using different sources of information in order to increase the validity of a study
These sources are likely to be stakeholders in a program - participants, other researchers, program staff, other community members, and so on.
Then we put all data in single framework & apply various statistical tools to find out the dynamic on the market.
During the analysis stage, feedback from the stakeholder groups would be compared to determine areas of agreement as well as areas of divergence


