
Key Insights
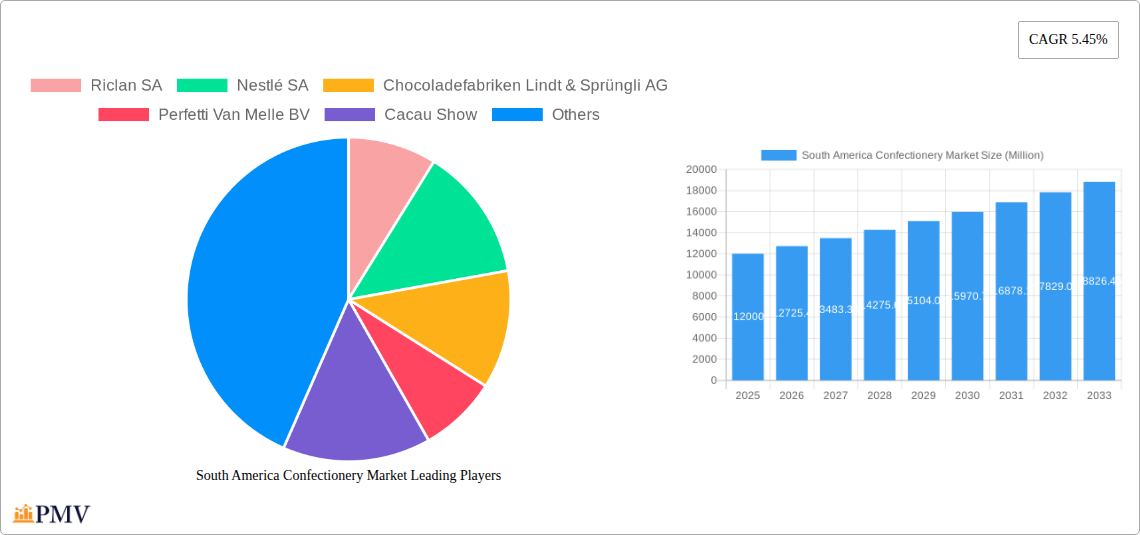
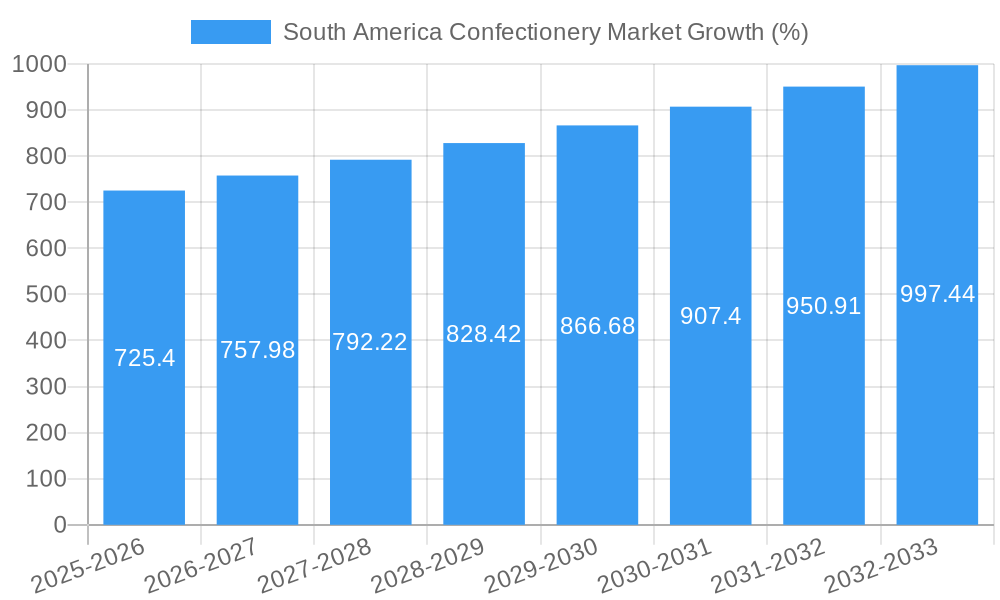
The South American confectionery market, valued at $12,000 million in 2025, is projected to experience robust growth, driven by rising disposable incomes, increasing urbanization, and a growing preference for convenient and indulgent snacks. The market's Compound Annual Growth Rate (CAGR) of 5.45% from 2025 to 2033 signifies a substantial expansion, with significant contributions from key countries like Brazil and Argentina. Growth is fueled by diverse product offerings, including chocolate, candies, and other confectionery items, catering to varied consumer preferences and demographics. The distribution landscape is dynamic, encompassing convenience stores, online retail, supermarkets/hypermarkets, and other channels, each offering unique opportunities for manufacturers and distributors. While the market faces challenges such as economic fluctuations and increasing health consciousness impacting consumer choices, the overall positive growth trajectory indicates a promising future for confectionery businesses in South America. Key players, including Nestlé, Lindt, Ferrero, and local giants like Arcor and Cacau Show, are strategically positioned to capitalize on the market’s expansion through product innovation, targeted marketing, and strong distribution networks. The "Rest of South America" segment is expected to witness significant growth, fueled by increasing middle-class populations and rising demand for premium confectionery products.
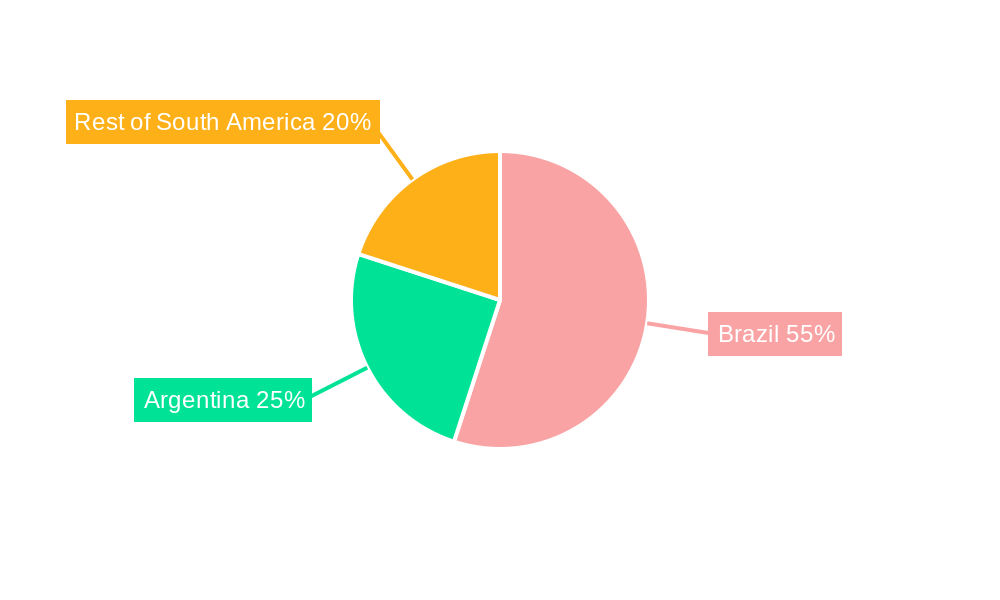
The competitive landscape is characterized by a mix of multinational corporations and regional players, leading to intense competition and the constant introduction of new products and flavors to capture market share. Brazil, as the largest economy in South America, constitutes the dominant market segment, accounting for a significant proportion of overall confectionery consumption. However, other South American countries are experiencing increasing demand, providing expansion opportunities for companies focusing on regional adaptation and local preferences. While challenges such as ingredient costs and fluctuating exchange rates may impact profitability, the sustained growth projection suggests long-term investment potential in the South American confectionery market. This presents compelling opportunities for established brands to expand their presence and for new entrants to carve out their niche through product innovation and strategic distribution partnerships.
South America Confectionery Market: A Comprehensive Report (2019-2033)
This comprehensive report provides an in-depth analysis of the South America confectionery market, offering invaluable insights for businesses operating in or planning to enter this dynamic sector. With a detailed examination of market structure, competitive dynamics, industry trends, and future projections, this report is an essential resource for strategic decision-making. The study period covers 2019-2033, with a base year of 2025 and a forecast period of 2025-2033. The market size is valued in Millions.
South America Confectionery Market Market Structure & Competitive Dynamics
The South American confectionery market exhibits a moderately concentrated structure, with both multinational giants and regional players vying for market share. Key players such as Nestlé SA, Mars Incorporated, and Mondelez International Inc. hold significant positions, leveraging extensive distribution networks and established brand recognition. However, regional players like Cacau Show and Arcor S A I C demonstrate robust local market penetration and strong brand loyalty.
The competitive landscape is characterized by intense innovation, with companies constantly introducing new flavors, formats, and product lines to cater to evolving consumer preferences. Regulatory frameworks vary across countries, impacting product labeling, ingredient regulations, and import/export procedures. Product substitutes, including healthier snacks and alternative sweet treats, pose a growing challenge. Mergers and acquisitions (M&A) play a significant role, exemplified by recent transactions like Ferrero’s acquisition of Dori Alimentos, altering market dynamics and concentration.
- Market Concentration: Moderately concentrated, with top 5 players holding approximately xx% market share in 2024.
- Innovation Ecosystems: Active, driven by consumer demand for novel products and healthier options.
- Regulatory Frameworks: Vary across countries, impacting product development and market access.
- M&A Activity: Significant, with deal values totaling xx Million in the past five years, significantly impacting market share. Examples include Ferrero's acquisition of Dori Alimentos.
South America Confectionery Market Industry Trends & Insights
The South American confectionery market is experiencing robust growth, driven by factors such as rising disposable incomes, changing consumption patterns, and increasing urbanization. The market exhibits a Compound Annual Growth Rate (CAGR) of xx% during the historical period (2019-2024) and is projected to maintain a CAGR of xx% during the forecast period (2025-2033). Market penetration of premium confectionery products is gradually increasing, particularly in urban areas. Technological advancements, such as improved manufacturing processes and innovative packaging solutions, are enhancing efficiency and product appeal. The rise of e-commerce presents new opportunities for distribution and market expansion. However, economic volatility in some regions and fluctuating raw material prices pose ongoing challenges to market growth.
Dominant Markets & Segments in South America Confectionery Market
Brazil is the dominant market in South America, accounting for xx% of the total market value in 2024 due to its large population and high confectionery consumption. Argentina follows as a significant market, while the Rest of South America exhibits substantial growth potential. The Supermarket/Hypermarket distribution channel holds the largest market share, primarily due to its wide reach and established infrastructure. Chocolate confections represent the dominant product segment, though the "Others" category (including gummies, candies, etc.) shows substantial growth potential driven by innovation and diversification.
- Key Drivers for Brazil: Large population, rising disposable incomes, strong retail infrastructure.
- Key Drivers for Argentina: Growing middle class, increasing urbanization.
- Key Drivers for Supermarket/Hypermarket Channel: Wide reach, established infrastructure, consumer preference.
- Key Drivers for Chocolate Segment: Established consumer preference, diverse product offerings.
South America Confectionery Market Product Innovations
Recent product innovations highlight a trend toward healthier options and customized experiences. The introduction of protein bars by The Hershey Company, for instance, caters to the growing health-conscious segment. Companies are also focusing on unique flavor profiles and convenient packaging formats to attract consumers. This also includes the incorporation of functional ingredients and sustainable sourcing practices. The market is witnessing a rise in organic and natural confectionery items.
Report Segmentation & Scope
This report segments the South American confectionery market by:
- Country: Argentina, Brazil, Rest of South America. Growth projections vary significantly across these regions, with Brazil demonstrating the most robust expansion.
- Distribution Channel: Convenience Stores, Online Retail Stores, Supermarket/Hypermarket, Others. Each channel presents distinct dynamics in terms of market size and growth trajectory.
- Confections: Chocolate, Others (gummies, hard candies, etc.). The "Others" segment exhibits dynamic growth.
Key Drivers of South America Confectionery Market Growth
Several factors fuel the market's growth: Rising disposable incomes in key markets are driving increased spending on discretionary items like confectionery. Urbanization is concentrating populations in areas with better retail access. The introduction of innovative products and flavors caters to evolving consumer tastes. Lastly, robust e-commerce growth offers new distribution channels.
Challenges in the South America Confectionery Market Sector
The South American confectionery market faces challenges such as economic volatility, impacting consumer spending. Fluctuating raw material prices can affect profitability. Increased competition from both local and international players necessitates continuous innovation. Stringent regulatory frameworks regarding ingredients and labeling can pose hurdles to manufacturers.
Leading Players in the South America Confectionery Market Market
- Riclan SA
- Nestlé SA
- Chocoladefabriken Lindt & Sprüngli AG
- Perfetti Van Melle BV
- Cacau Show
- Colombina SA
- Ferrero International SA
- Florestal Alimentos SA
- Mars Incorporated
- Barry Callebaut AG
- Arcor S A I C
- The Hershey Company
- Dori Alimentos SA
- Mondelēz International Inc
- Grupo de Inversiones Suramericana SA
- Kellogg Company
Key Developments in South America Confectionery Market Sector
- July 2023: Ferrero's acquisition of Dori Alimentos significantly expands its presence in the Brazilian market.
- April 2023: The Hershey Company's launch of a peanut butter and jelly flavored protein bar targets health-conscious consumers.
- January 2023: The Hershey Company introduces caffeinated protein bars, expanding its product portfolio.
Strategic South America Confectionery Market Market Outlook
The South American confectionery market holds significant potential for growth, driven by increasing consumption, evolving consumer preferences, and the rise of e-commerce. Companies that can adapt to these dynamics, innovate their product offerings, and leverage efficient distribution channels are well-positioned to capture market share. Strategic partnerships and acquisitions will continue to shape the competitive landscape, while a focus on sustainability and health-conscious options will be crucial for long-term success.
South America Confectionery Market Segmentation
-
1. Confections
-
1.1. Chocolate
-
1.1.1. By Confectionery Variant
- 1.1.1.1. Dark Chocolate
- 1.1.1.2. Milk and White Chocolate
-
1.1.1. By Confectionery Variant
-
1.2. Gums
- 1.2.1. Bubble Gum
-
1.2.2. Chewing Gum
-
1.2.2.1. By Sugar Content
- 1.2.2.1.1. Sugar Chewing Gum
- 1.2.2.1.2. Sugar-free Chewing Gum
-
1.2.2.1. By Sugar Content
-
1.3. Snack Bar
- 1.3.1. Cereal Bar
- 1.3.2. Fruit & Nut Bar
- 1.3.3. Protein Bar
-
1.4. Sugar Confectionery
- 1.4.1. Hard Candy
- 1.4.2. Lollipops
- 1.4.3. Mints
- 1.4.4. Pastilles, Gummies, and Jellies
- 1.4.5. Toffees and Nougats
- 1.4.6. Others
-
1.1. Chocolate
-
2. Distribution Channel
- 2.1. Convenience Store
- 2.2. Online Retail Store
- 2.3. Supermarket/Hypermarket
- 2.4. Others
South America Confectionery Market Segmentation By Geography
-
1. South America
- 1.1. Brazil
- 1.2. Argentina
- 1.3. Chile
- 1.4. Colombia
- 1.5. Peru
- 1.6. Venezuela
- 1.7. Ecuador
- 1.8. Bolivia
- 1.9. Paraguay
- 1.10. Uruguay
South America Confectionery Market REPORT HIGHLIGHTS
| Aspects | Details |
|---|---|
| Study Period | 2019-2033 |
| Base Year | 2024 |
| Estimated Year | 2025 |
| Forecast Period | 2025-2033 |
| Historical Period | 2019-2024 |
| Growth Rate | CAGR of 5.45% from 2019-2033 |
| Segmentation |
|
Table of Contents
- 1. Introduction
- 1.1. Research Scope
- 1.2. Market Segmentation
- 1.3. Research Methodology
- 1.4. Definitions and Assumptions
- 2. Executive Summary
- 2.1. Introduction
- 3. Market Dynamics
- 3.1. Introduction
- 3.2. Market Drivers
- 3.2.1. Increasing demand for meat alternatives
- 3.3. Market Restrains
- 3.3.1. Presence of numerous alternatives in the plant proteins
- 3.4. Market Trends
- 3.4.1. OTHER KEY INDUSTRY TRENDS COVERED IN THE REPORT
- 4. Market Factor Analysis
- 4.1. Porters Five Forces
- 4.2. Supply/Value Chain
- 4.3. PESTEL analysis
- 4.4. Market Entropy
- 4.5. Patent/Trademark Analysis
- 5. South America Confectionery Market Analysis, Insights and Forecast, 2019-2031
- 5.1. Market Analysis, Insights and Forecast - by Confections
- 5.1.1. Chocolate
- 5.1.1.1. By Confectionery Variant
- 5.1.1.1.1. Dark Chocolate
- 5.1.1.1.2. Milk and White Chocolate
- 5.1.1.1. By Confectionery Variant
- 5.1.2. Gums
- 5.1.2.1. Bubble Gum
- 5.1.2.2. Chewing Gum
- 5.1.2.2.1. By Sugar Content
- 5.1.2.2.1.1. Sugar Chewing Gum
- 5.1.2.2.1.2. Sugar-free Chewing Gum
- 5.1.2.2.1. By Sugar Content
- 5.1.3. Snack Bar
- 5.1.3.1. Cereal Bar
- 5.1.3.2. Fruit & Nut Bar
- 5.1.3.3. Protein Bar
- 5.1.4. Sugar Confectionery
- 5.1.4.1. Hard Candy
- 5.1.4.2. Lollipops
- 5.1.4.3. Mints
- 5.1.4.4. Pastilles, Gummies, and Jellies
- 5.1.4.5. Toffees and Nougats
- 5.1.4.6. Others
- 5.1.1. Chocolate
- 5.2. Market Analysis, Insights and Forecast - by Distribution Channel
- 5.2.1. Convenience Store
- 5.2.2. Online Retail Store
- 5.2.3. Supermarket/Hypermarket
- 5.2.4. Others
- 5.3. Market Analysis, Insights and Forecast - by Region
- 5.3.1. South America
- 5.1. Market Analysis, Insights and Forecast - by Confections
- 6. Brazil South America Confectionery Market Analysis, Insights and Forecast, 2019-2031
- 7. Argentina South America Confectionery Market Analysis, Insights and Forecast, 2019-2031
- 8. Rest of South America South America Confectionery Market Analysis, Insights and Forecast, 2019-2031
- 9. Competitive Analysis
- 9.1. Market Share Analysis 2024
- 9.2. Company Profiles
- 9.2.1 Riclan SA
- 9.2.1.1. Overview
- 9.2.1.2. Products
- 9.2.1.3. SWOT Analysis
- 9.2.1.4. Recent Developments
- 9.2.1.5. Financials (Based on Availability)
- 9.2.2 Nestlé SA
- 9.2.2.1. Overview
- 9.2.2.2. Products
- 9.2.2.3. SWOT Analysis
- 9.2.2.4. Recent Developments
- 9.2.2.5. Financials (Based on Availability)
- 9.2.3 Chocoladefabriken Lindt & Sprüngli AG
- 9.2.3.1. Overview
- 9.2.3.2. Products
- 9.2.3.3. SWOT Analysis
- 9.2.3.4. Recent Developments
- 9.2.3.5. Financials (Based on Availability)
- 9.2.4 Perfetti Van Melle BV
- 9.2.4.1. Overview
- 9.2.4.2. Products
- 9.2.4.3. SWOT Analysis
- 9.2.4.4. Recent Developments
- 9.2.4.5. Financials (Based on Availability)
- 9.2.5 Cacau Show
- 9.2.5.1. Overview
- 9.2.5.2. Products
- 9.2.5.3. SWOT Analysis
- 9.2.5.4. Recent Developments
- 9.2.5.5. Financials (Based on Availability)
- 9.2.6 Colombina SA
- 9.2.6.1. Overview
- 9.2.6.2. Products
- 9.2.6.3. SWOT Analysis
- 9.2.6.4. Recent Developments
- 9.2.6.5. Financials (Based on Availability)
- 9.2.7 Ferrero International SA
- 9.2.7.1. Overview
- 9.2.7.2. Products
- 9.2.7.3. SWOT Analysis
- 9.2.7.4. Recent Developments
- 9.2.7.5. Financials (Based on Availability)
- 9.2.8 Florestal Alimentos SA
- 9.2.8.1. Overview
- 9.2.8.2. Products
- 9.2.8.3. SWOT Analysis
- 9.2.8.4. Recent Developments
- 9.2.8.5. Financials (Based on Availability)
- 9.2.9 Mars Incorporated
- 9.2.9.1. Overview
- 9.2.9.2. Products
- 9.2.9.3. SWOT Analysis
- 9.2.9.4. Recent Developments
- 9.2.9.5. Financials (Based on Availability)
- 9.2.10 Barry Callebaut AG
- 9.2.10.1. Overview
- 9.2.10.2. Products
- 9.2.10.3. SWOT Analysis
- 9.2.10.4. Recent Developments
- 9.2.10.5. Financials (Based on Availability)
- 9.2.11 Arcor S A I C
- 9.2.11.1. Overview
- 9.2.11.2. Products
- 9.2.11.3. SWOT Analysis
- 9.2.11.4. Recent Developments
- 9.2.11.5. Financials (Based on Availability)
- 9.2.12 The Hershey Compan
- 9.2.12.1. Overview
- 9.2.12.2. Products
- 9.2.12.3. SWOT Analysis
- 9.2.12.4. Recent Developments
- 9.2.12.5. Financials (Based on Availability)
- 9.2.13 Dori Alimentos SA
- 9.2.13.1. Overview
- 9.2.13.2. Products
- 9.2.13.3. SWOT Analysis
- 9.2.13.4. Recent Developments
- 9.2.13.5. Financials (Based on Availability)
- 9.2.14 Mondelēz International Inc
- 9.2.14.1. Overview
- 9.2.14.2. Products
- 9.2.14.3. SWOT Analysis
- 9.2.14.4. Recent Developments
- 9.2.14.5. Financials (Based on Availability)
- 9.2.15 Grupo de Inversiones Suramericana SA
- 9.2.15.1. Overview
- 9.2.15.2. Products
- 9.2.15.3. SWOT Analysis
- 9.2.15.4. Recent Developments
- 9.2.15.5. Financials (Based on Availability)
- 9.2.16 Kellogg Company
- 9.2.16.1. Overview
- 9.2.16.2. Products
- 9.2.16.3. SWOT Analysis
- 9.2.16.4. Recent Developments
- 9.2.16.5. Financials (Based on Availability)
- 9.2.1 Riclan SA
List of Figures
- Figure 1: South America Confectionery Market Revenue Breakdown (Million, %) by Product 2024 & 2032
- Figure 2: South America Confectionery Market Share (%) by Company 2024
List of Tables
- Table 1: South America Confectionery Market Revenue Million Forecast, by Region 2019 & 2032
- Table 2: South America Confectionery Market Volume K Tons Forecast, by Region 2019 & 2032
- Table 3: South America Confectionery Market Revenue Million Forecast, by Confections 2019 & 2032
- Table 4: South America Confectionery Market Volume K Tons Forecast, by Confections 2019 & 2032
- Table 5: South America Confectionery Market Revenue Million Forecast, by Distribution Channel 2019 & 2032
- Table 6: South America Confectionery Market Volume K Tons Forecast, by Distribution Channel 2019 & 2032
- Table 7: South America Confectionery Market Revenue Million Forecast, by Region 2019 & 2032
- Table 8: South America Confectionery Market Volume K Tons Forecast, by Region 2019 & 2032
- Table 9: South America Confectionery Market Revenue Million Forecast, by Country 2019 & 2032
- Table 10: South America Confectionery Market Volume K Tons Forecast, by Country 2019 & 2032
- Table 11: Brazil South America Confectionery Market Revenue (Million) Forecast, by Application 2019 & 2032
- Table 12: Brazil South America Confectionery Market Volume (K Tons) Forecast, by Application 2019 & 2032
- Table 13: Argentina South America Confectionery Market Revenue (Million) Forecast, by Application 2019 & 2032
- Table 14: Argentina South America Confectionery Market Volume (K Tons) Forecast, by Application 2019 & 2032
- Table 15: Rest of South America South America Confectionery Market Revenue (Million) Forecast, by Application 2019 & 2032
- Table 16: Rest of South America South America Confectionery Market Volume (K Tons) Forecast, by Application 2019 & 2032
- Table 17: South America Confectionery Market Revenue Million Forecast, by Confections 2019 & 2032
- Table 18: South America Confectionery Market Volume K Tons Forecast, by Confections 2019 & 2032
- Table 19: South America Confectionery Market Revenue Million Forecast, by Distribution Channel 2019 & 2032
- Table 20: South America Confectionery Market Volume K Tons Forecast, by Distribution Channel 2019 & 2032
- Table 21: South America Confectionery Market Revenue Million Forecast, by Country 2019 & 2032
- Table 22: South America Confectionery Market Volume K Tons Forecast, by Country 2019 & 2032
- Table 23: Brazil South America Confectionery Market Revenue (Million) Forecast, by Application 2019 & 2032
- Table 24: Brazil South America Confectionery Market Volume (K Tons) Forecast, by Application 2019 & 2032
- Table 25: Argentina South America Confectionery Market Revenue (Million) Forecast, by Application 2019 & 2032
- Table 26: Argentina South America Confectionery Market Volume (K Tons) Forecast, by Application 2019 & 2032
- Table 27: Chile South America Confectionery Market Revenue (Million) Forecast, by Application 2019 & 2032
- Table 28: Chile South America Confectionery Market Volume (K Tons) Forecast, by Application 2019 & 2032
- Table 29: Colombia South America Confectionery Market Revenue (Million) Forecast, by Application 2019 & 2032
- Table 30: Colombia South America Confectionery Market Volume (K Tons) Forecast, by Application 2019 & 2032
- Table 31: Peru South America Confectionery Market Revenue (Million) Forecast, by Application 2019 & 2032
- Table 32: Peru South America Confectionery Market Volume (K Tons) Forecast, by Application 2019 & 2032
- Table 33: Venezuela South America Confectionery Market Revenue (Million) Forecast, by Application 2019 & 2032
- Table 34: Venezuela South America Confectionery Market Volume (K Tons) Forecast, by Application 2019 & 2032
- Table 35: Ecuador South America Confectionery Market Revenue (Million) Forecast, by Application 2019 & 2032
- Table 36: Ecuador South America Confectionery Market Volume (K Tons) Forecast, by Application 2019 & 2032
- Table 37: Bolivia South America Confectionery Market Revenue (Million) Forecast, by Application 2019 & 2032
- Table 38: Bolivia South America Confectionery Market Volume (K Tons) Forecast, by Application 2019 & 2032
- Table 39: Paraguay South America Confectionery Market Revenue (Million) Forecast, by Application 2019 & 2032
- Table 40: Paraguay South America Confectionery Market Volume (K Tons) Forecast, by Application 2019 & 2032
- Table 41: Uruguay South America Confectionery Market Revenue (Million) Forecast, by Application 2019 & 2032
- Table 42: Uruguay South America Confectionery Market Volume (K Tons) Forecast, by Application 2019 & 2032
Frequently Asked Questions
1. What is the projected Compound Annual Growth Rate (CAGR) of the South America Confectionery Market?
The projected CAGR is approximately 5.45%.
2. Which companies are prominent players in the South America Confectionery Market?
Key companies in the market include Riclan SA, Nestlé SA, Chocoladefabriken Lindt & Sprüngli AG, Perfetti Van Melle BV, Cacau Show, Colombina SA, Ferrero International SA, Florestal Alimentos SA, Mars Incorporated, Barry Callebaut AG, Arcor S A I C, The Hershey Compan, Dori Alimentos SA, Mondelēz International Inc, Grupo de Inversiones Suramericana SA, Kellogg Company.
3. What are the main segments of the South America Confectionery Market?
The market segments include Confections, Distribution Channel.
4. Can you provide details about the market size?
The market size is estimated to be USD 12000 Million as of 2022.
5. What are some drivers contributing to market growth?
Increasing demand for meat alternatives.
6. What are the notable trends driving market growth?
OTHER KEY INDUSTRY TRENDS COVERED IN THE REPORT.
7. Are there any restraints impacting market growth?
Presence of numerous alternatives in the plant proteins.
8. Can you provide examples of recent developments in the market?
July 2023: Ferrero's sister company, Ferrara Candy Co., announced the acquisition of Brazilian snacks company Dori Alimentos, which sells a variety of chocolate and sugar confectionery brands, including Dori, Pettiz, and Jubes.April 2023: Under the ONE brand, The Hershey Company launched the Peanut Butter & Jelly Flavored Protein Bar. The ONE Limited Edition Peanut Butter & Jelly flavored bars are packed with 20 g of protein, 1 g of sugar, and the familiar taste of peanut butter and strawberry jelly flavors.January 2023: The Hershey Company launched caffeinated protein bars. The range is available in two flavors, which include Vanilla Latte and Caramel Macchiato.
9. What pricing options are available for accessing the report?
Pricing options include single-user, multi-user, and enterprise licenses priced at USD 3800, USD 4500, and USD 5800 respectively.
10. Is the market size provided in terms of value or volume?
The market size is provided in terms of value, measured in Million and volume, measured in K Tons.
11. Are there any specific market keywords associated with the report?
Yes, the market keyword associated with the report is "South America Confectionery Market," which aids in identifying and referencing the specific market segment covered.
12. How do I determine which pricing option suits my needs best?
The pricing options vary based on user requirements and access needs. Individual users may opt for single-user licenses, while businesses requiring broader access may choose multi-user or enterprise licenses for cost-effective access to the report.
13. Are there any additional resources or data provided in the South America Confectionery Market report?
While the report offers comprehensive insights, it's advisable to review the specific contents or supplementary materials provided to ascertain if additional resources or data are available.
14. How can I stay updated on further developments or reports in the South America Confectionery Market?
To stay informed about further developments, trends, and reports in the South America Confectionery Market, consider subscribing to industry newsletters, following relevant companies and organizations, or regularly checking reputable industry news sources and publications.
Methodology
Step 1 - Identification of Relevant Samples Size from Population Database


Step 2 - Approaches for Defining Global Market Size (Value, Volume* & Price*)

Note*: In applicable scenarios
Step 3 - Data Sources
Primary Research
- Web Analytics
- Survey Reports
- Research Institute
- Latest Research Reports
- Opinion Leaders
Secondary Research
- Annual Reports
- White Paper
- Latest Press Release
- Industry Association
- Paid Database
- Investor Presentations

Step 4 - Data Triangulation
Involves using different sources of information in order to increase the validity of a study
These sources are likely to be stakeholders in a program - participants, other researchers, program staff, other community members, and so on.
Then we put all data in single framework & apply various statistical tools to find out the dynamic on the market.
During the analysis stage, feedback from the stakeholder groups would be compared to determine areas of agreement as well as areas of divergence


