

Key Insights
The global soft contact lens market is poised for substantial expansion, driven by the escalating prevalence of myopia, increasing disposable incomes, and a growing consumer demand for cosmetic contact lenses. The market, valued at $97.6 billion in 2025, is projected to grow at a Compound Annual Growth Rate (CAGR) of 6.21% from 2025 to 2033. This growth trajectory is propelled by technological innovations enhancing lens comfort, extended wearability, and superior vision correction. The proliferation of online retail channels further bolsters market penetration by offering consumers unparalleled convenience and transparent pricing. The adoption of advanced lens materials, such as silicone hydrogel, renowned for their exceptional oxygen permeability and reduced complication risks, is a key market driver.
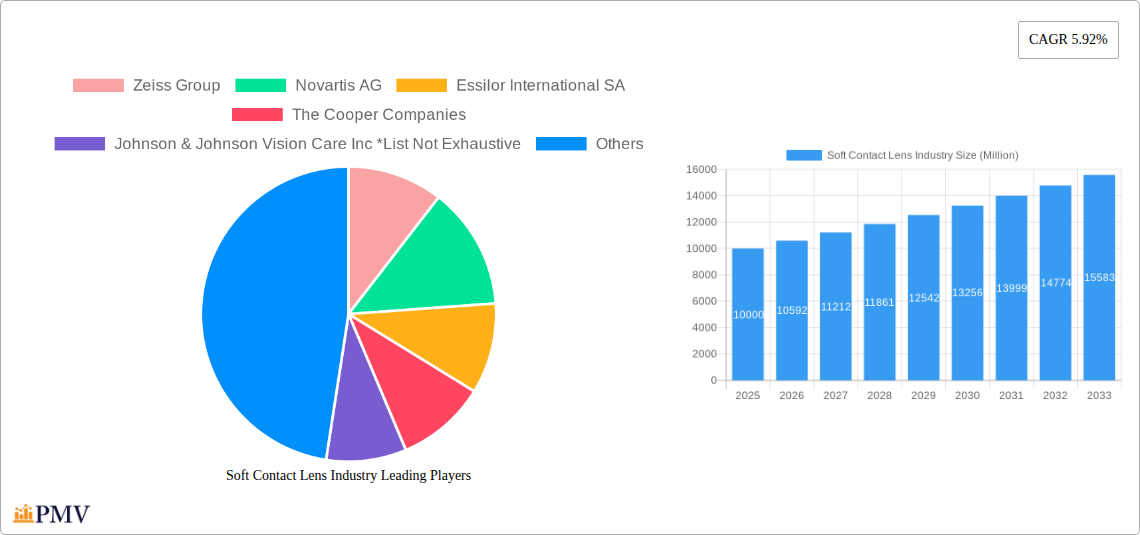
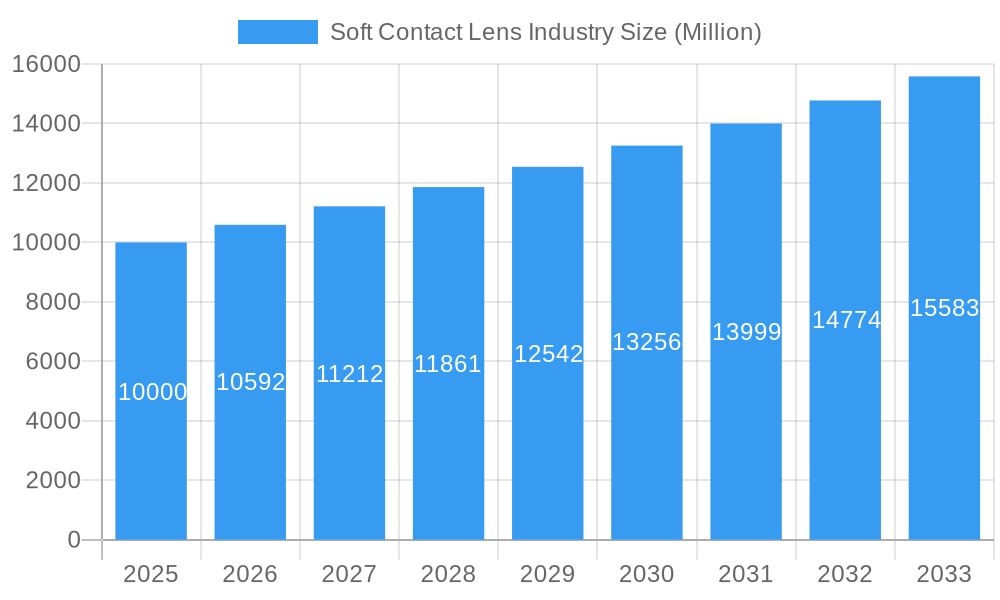
Soft Contact Lens Industry Market Size (In Billion)
Leading industry players, including Johnson & Johnson Vision Care, Alcon, CooperVision, and Essilor, are actively investing in research and development, fostering market advancement through novel product introductions and feature enhancements.
Soft Contact Lens Industry Company Market Share
Despite robust growth, the market confronts certain obstacles. The premium pricing of certain contact lenses can impede accessibility for some consumer demographics. Furthermore, potential risks associated with contact lens usage, such as infections and eye irritation, present a limitation. Navigating regulatory complexities and diverse regional healthcare reimbursement policies also influences market dynamics. To mitigate these challenges, manufacturers are prioritizing the development of more accessible price points and actively promoting proper hygiene practices and professional eye care consultation. Market segmentation by product type (e.g., daily disposables, monthly disposables), intended use (corrective vs. therapeutic), and distribution channels (online vs. offline) provides critical insights for strategic planning. The Asia-Pacific region, particularly China and India, is anticipated to exhibit considerable growth opportunities owing to the rising incidence of refractive errors and heightened awareness of vision health.
Soft Contact Lens Industry: Market Analysis & Forecast Report (2019-2033)
This comprehensive report provides an in-depth analysis of the global soft contact lens industry, offering invaluable insights for stakeholders seeking to navigate this dynamic market. The study period spans from 2019 to 2033, with a focus on the base year 2025 and a forecast period of 2025-2033. The report examines market size, growth drivers, challenges, competitive landscape, and future outlook, incorporating detailed segmentation across product type, usage, and distribution channels. The total market size is estimated to reach xx Million by 2033.
Soft Contact Lens Industry Market Structure & Competitive Dynamics
The global soft contact lens market exhibits a moderately consolidated structure, with key players like Zeiss Group, Novartis AG, Essilor International SA, The Cooper Companies, and Johnson & Johnson Vision Care Inc, Bausch Health Companies Inc, and Hoya Corporation holding significant market share. The market share of these companies is estimated to be xx%. Innovation plays a vital role, with companies continuously developing advanced materials and technologies to improve lens comfort, durability, and vision correction capabilities. Stringent regulatory frameworks govern the manufacturing and distribution of contact lenses, ensuring product safety and efficacy. The market also witnesses consistent M&A activity, with deal values exceeding xx Million in recent years. Examples include [insert specific M&A examples with values if available, otherwise state "Specific deal details are not publicly available."]. The rise of online retailers is reshaping distribution channels, while consumer preferences are increasingly leaning towards disposable lenses and technologically advanced products.
Soft Contact Lens Industry Industry Trends & Insights
The soft contact lens market is experiencing robust growth, driven by increasing myopia prevalence globally, rising disposable income in developing economies, and growing awareness regarding vision correction solutions. The Compound Annual Growth Rate (CAGR) from 2025 to 2033 is projected to be xx%. Market penetration, particularly in emerging markets, remains relatively low, presenting significant growth opportunities. Technological disruptions, such as the development of silicone hydrogel lenses and smart contact lenses, are reshaping the industry. Consumer preferences are shifting towards daily disposable lenses, driven by convenience and hygiene concerns. Intense competition among established players and the emergence of new entrants fuels innovation and price optimization. The increasing adoption of online sales channels significantly impacts distribution strategies and market reach. The shift toward personalized lens solutions is also a notable trend.
Dominant Markets & Segments in Soft Contact Lens Industry
Leading Region/Country: North America currently dominates the soft contact lens market, driven by high per capita income, advanced healthcare infrastructure, and high prevalence of refractive errors. Asia Pacific is expected to exhibit the fastest growth rate.
Dominant Product Type: Soft contact lenses constitute the largest segment, owing to their comfort, affordability, and wide availability. However, the hybrid and rigid gas permeable contact lens segments are experiencing notable growth due to increasing demand for specialized vision correction solutions.
Dominant Usage: Corrective contact lenses dominate the market, but the therapeutic contact lens segment is witnessing growth due to the rising prevalence of eye-related conditions requiring specific lens functionalities.
Dominant Distribution Channel: Spectacle stores remain the primary distribution channel, although online sales channels are rapidly gaining traction, providing convenience and competitive pricing.
Key Drivers:
- Developed healthcare infrastructure and high per capita income in North America and Europe contribute to higher adoption rates.
- Rising disposable incomes in developing economies are driving demand for improved vision correction.
- Increased awareness of vision care and the associated benefits of contact lenses are fueling market growth.
Soft Contact Lens Industry Product Innovations
Recent innovations focus on enhancing material properties to improve breathability, moisture retention, and comfort. Silicone hydrogel lenses offer superior oxygen permeability, minimizing eye discomfort and reducing complications. Smart contact lenses are emerging, with features such as glucose monitoring and pressure sensing, expanding the applications beyond vision correction. These innovations cater to evolving consumer demands and competitive pressures, creating a dynamic market landscape. The industry sees continued investments in material science and manufacturing processes to improve lens quality and reduce manufacturing costs.
Report Segmentation & Scope
This report provides a comprehensive market segmentation based on:
Product Type: Soft Contact Lenses, Hybrid Contact Lenses, Rigid Gas Permeable Contact Lenses, Others. The soft contact lens segment is projected to hold the largest market share, with xx Million in 2025, expected to grow to xx Million by 2033. Hybrid lenses are expected to grow at the highest CAGR.
Usage: Corrective Contact Lenses, Therapeutic Contact Lenses, Other Usages. Corrective lenses currently dominate, but the therapeutic segment is expected to show faster growth.
Distribution Channel: Spectacle Stores, Online Stores, Other Channels. Online channels are expected to increase their market share significantly.
Each segment's growth projections, market size estimations, and competitive dynamics are analyzed in detail within the report.
Key Drivers of Soft Contact Lens Industry Growth
The soft contact lens industry's growth is fueled by several factors: The increasing prevalence of refractive errors globally, particularly myopia, necessitates vision correction solutions. Technological advancements lead to the development of more comfortable, durable, and feature-rich contact lenses. Rising disposable incomes, particularly in emerging economies, broaden access to premium vision care products. Stringent regulatory frameworks ensure product safety and efficacy, building consumer trust and confidence.
Challenges in the Soft Contact Lens Industry Sector
The industry faces challenges including stringent regulatory approvals for new products, increasing competition from established players and new entrants, and potential supply chain disruptions that can impact manufacturing and distribution. Price sensitivity in certain markets also limits profitability. The risk of infection and other complications associated with contact lens use necessitates robust safety protocols and consumer education. These factors necessitate strategic adaptation to sustain profitable growth.
Leading Players in the Soft Contact Lens Industry Market
- Zeiss Group
- Novartis AG
- Essilor International SA
- The Cooper Companies
- Johnson & Johnson Vision Care Inc
- Bausch Health Companies Inc
- Hoya Corporation
Key Developments in Soft Contact Lens Industry Sector
- 2022 Q4: Johnson & Johnson Vision announced a new silicone hydrogel lens with improved comfort and oxygen permeability.
- 2023 Q1: Alcon launched a new daily disposable lens designed for astigmatism correction.
- [Insert other relevant developments with dates and quantifiable impacts if available. Otherwise, use “Further significant developments are not publicly available at this time.”]
Strategic Soft Contact Lens Industry Market Outlook
The soft contact lens market offers significant growth potential, driven by continued technological innovation, expanding global reach, and increasing awareness of vision care. Strategic opportunities lie in developing personalized lens solutions, expanding into emerging markets, and leveraging digital channels for effective marketing and distribution. Focus on sustainability and eco-friendly materials will also enhance market appeal. The market outlook remains positive, with significant growth projected over the next decade.
Soft Contact Lens Industry Segmentation
-
1. Product Type
- 1.1. Soft Contact Lens
- 1.2. Hybrid Contact Lens
- 1.3. Rigid Gas Permeable Contact Lens
- 1.4. Others
-
2. Usages
- 2.1. Corrective Contact Lens
- 2.2. Therapeutic Contact Lens
- 2.3. Other Usages
-
3. Distribution Channel
- 3.1. Spectacle Stores
- 3.2. Online Stores
- 3.3. Other channel
Soft Contact Lens Industry Segmentation By Geography
-
1. North America
- 1.1. United States
- 1.2. Canada
- 1.3. Mexico
- 1.4. Rest of North America
-
2. Europe
- 2.1. United Kingdom
- 2.2. Germany
- 2.3. France
- 2.4. Italy
- 2.5. Russia
- 2.6. Rest of Europe
-
3. Asia Pacific
- 3.1. China
- 3.2. Japan
- 3.3. India
- 3.4. Australia
- 3.5. Rest of Asia Pacific
-
4. South America
- 4.1. Brazil
- 4.2. Argentina
- 4.3. Rest of South America
-
5. Middle East and Africa
- 5.1. South Africa
- 5.2. United Arab Emirates
- 5.3. Rest of Middle East and Africa
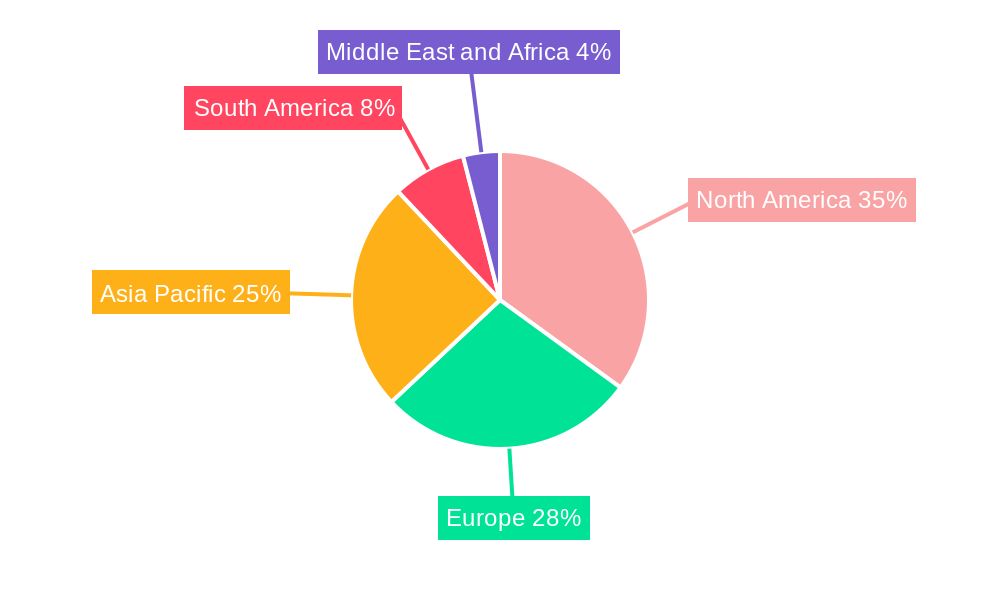
Soft Contact Lens Industry Regional Market Share
Geographic Coverage of Soft Contact Lens Industry
Soft Contact Lens Industry REPORT HIGHLIGHTS
| Aspects | Details |
|---|---|
| Study Period | 2020-2034 |
| Base Year | 2025 |
| Estimated Year | 2026 |
| Forecast Period | 2026-2034 |
| Historical Period | 2020-2025 |
| Growth Rate | CAGR of 6.21% from 2020-2034 |
| Segmentation |
|
Table of Contents
- 1. Introduction
- 1.1. Research Scope
- 1.2. Market Segmentation
- 1.3. Research Objective
- 1.4. Definitions and Assumptions
- 2. Executive Summary
- 2.1. Market Snapshot
- 3. Market Dynamics
- 3.1. Market Drivers
- 3.2. Market Restrains
- 3.3. Market Trends
- 3.4. Market Opportunities
- 4. Market Factor Analysis
- 4.1. Porters Five Forces
- 4.1.1. Bargaining Power of Suppliers
- 4.1.2. Bargaining Power of Buyers
- 4.1.3. Threat of New Entrants
- 4.1.4. Threat of Substitutes
- 4.1.5. Competitive Rivalry
- 4.2. PESTEL analysis
- 4.3. BCG Analysis
- 4.3.1. Stars (High Growth, High Market Share)
- 4.3.2. Cash Cows (Low Growth, High Market Share)
- 4.3.3. Question Mark (High Growth, Low Market Share)
- 4.3.4. Dogs (Low Growth, Low Market Share)
- 4.4. Ansoff Matrix Analysis
- 4.5. Supply Chain Analysis
- 4.6. Regulatory Landscape
- 4.7. Current Market Potential and Opportunity Assessment (TAM–SAM–SOM Framework)
- 4.8. PMV Analyst Note
- 4.1. Porters Five Forces
- 5. Market Analysis, Insights and Forecast 2021-2033
- 5.1. Market Analysis, Insights and Forecast - by Product Type
- 5.1.1. Soft Contact Lens
- 5.1.2. Hybrid Contact Lens
- 5.1.3. Rigid Gas Permeable Contact Lens
- 5.1.4. Others
- 5.2. Market Analysis, Insights and Forecast - by Usages
- 5.2.1. Corrective Contact Lens
- 5.2.2. Therapeutic Contact Lens
- 5.2.3. Other Usages
- 5.3. Market Analysis, Insights and Forecast - by Distribution Channel
- 5.3.1. Spectacle Stores
- 5.3.2. Online Stores
- 5.3.3. Other channel
- 5.4. Market Analysis, Insights and Forecast - by Region
- 5.4.1. North America
- 5.4.2. Europe
- 5.4.3. Asia Pacific
- 5.4.4. South America
- 5.4.5. Middle East and Africa
- 5.1. Market Analysis, Insights and Forecast - by Product Type
- 6. Global Soft Contact Lens Industry Analysis, Insights and Forecast, 2021-2033
- 6.1. Market Analysis, Insights and Forecast - by Product Type
- 6.1.1. Soft Contact Lens
- 6.1.2. Hybrid Contact Lens
- 6.1.3. Rigid Gas Permeable Contact Lens
- 6.1.4. Others
- 6.2. Market Analysis, Insights and Forecast - by Usages
- 6.2.1. Corrective Contact Lens
- 6.2.2. Therapeutic Contact Lens
- 6.2.3. Other Usages
- 6.3. Market Analysis, Insights and Forecast - by Distribution Channel
- 6.3.1. Spectacle Stores
- 6.3.2. Online Stores
- 6.3.3. Other channel
- 6.1. Market Analysis, Insights and Forecast - by Product Type
- 7. North America Soft Contact Lens Industry Analysis, Insights and Forecast, 2020-2032
- 7.1. Market Analysis, Insights and Forecast - by Product Type
- 7.1.1. Soft Contact Lens
- 7.1.2. Hybrid Contact Lens
- 7.1.3. Rigid Gas Permeable Contact Lens
- 7.1.4. Others
- 7.2. Market Analysis, Insights and Forecast - by Usages
- 7.2.1. Corrective Contact Lens
- 7.2.2. Therapeutic Contact Lens
- 7.2.3. Other Usages
- 7.3. Market Analysis, Insights and Forecast - by Distribution Channel
- 7.3.1. Spectacle Stores
- 7.3.2. Online Stores
- 7.3.3. Other channel
- 7.1. Market Analysis, Insights and Forecast - by Product Type
- 8. Europe Soft Contact Lens Industry Analysis, Insights and Forecast, 2020-2032
- 8.1. Market Analysis, Insights and Forecast - by Product Type
- 8.1.1. Soft Contact Lens
- 8.1.2. Hybrid Contact Lens
- 8.1.3. Rigid Gas Permeable Contact Lens
- 8.1.4. Others
- 8.2. Market Analysis, Insights and Forecast - by Usages
- 8.2.1. Corrective Contact Lens
- 8.2.2. Therapeutic Contact Lens
- 8.2.3. Other Usages
- 8.3. Market Analysis, Insights and Forecast - by Distribution Channel
- 8.3.1. Spectacle Stores
- 8.3.2. Online Stores
- 8.3.3. Other channel
- 8.1. Market Analysis, Insights and Forecast - by Product Type
- 9. Asia Pacific Soft Contact Lens Industry Analysis, Insights and Forecast, 2020-2032
- 9.1. Market Analysis, Insights and Forecast - by Product Type
- 9.1.1. Soft Contact Lens
- 9.1.2. Hybrid Contact Lens
- 9.1.3. Rigid Gas Permeable Contact Lens
- 9.1.4. Others
- 9.2. Market Analysis, Insights and Forecast - by Usages
- 9.2.1. Corrective Contact Lens
- 9.2.2. Therapeutic Contact Lens
- 9.2.3. Other Usages
- 9.3. Market Analysis, Insights and Forecast - by Distribution Channel
- 9.3.1. Spectacle Stores
- 9.3.2. Online Stores
- 9.3.3. Other channel
- 9.1. Market Analysis, Insights and Forecast - by Product Type
- 10. South America Soft Contact Lens Industry Analysis, Insights and Forecast, 2020-2032
- 10.1. Market Analysis, Insights and Forecast - by Product Type
- 10.1.1. Soft Contact Lens
- 10.1.2. Hybrid Contact Lens
- 10.1.3. Rigid Gas Permeable Contact Lens
- 10.1.4. Others
- 10.2. Market Analysis, Insights and Forecast - by Usages
- 10.2.1. Corrective Contact Lens
- 10.2.2. Therapeutic Contact Lens
- 10.2.3. Other Usages
- 10.3. Market Analysis, Insights and Forecast - by Distribution Channel
- 10.3.1. Spectacle Stores
- 10.3.2. Online Stores
- 10.3.3. Other channel
- 10.1. Market Analysis, Insights and Forecast - by Product Type
- 11. Middle East and Africa Soft Contact Lens Industry Analysis, Insights and Forecast, 2020-2032
- 11.1. Market Analysis, Insights and Forecast - by Product Type
- 11.1.1. Soft Contact Lens
- 11.1.2. Hybrid Contact Lens
- 11.1.3. Rigid Gas Permeable Contact Lens
- 11.1.4. Others
- 11.2. Market Analysis, Insights and Forecast - by Usages
- 11.2.1. Corrective Contact Lens
- 11.2.2. Therapeutic Contact Lens
- 11.2.3. Other Usages
- 11.3. Market Analysis, Insights and Forecast - by Distribution Channel
- 11.3.1. Spectacle Stores
- 11.3.2. Online Stores
- 11.3.3. Other channel
- 11.1. Market Analysis, Insights and Forecast - by Product Type
- 12. Competitive Analysis
- 12.1. Company Profiles
- 12.1.1 Zeiss Group
- 12.1.1.1. Company Overview
- 12.1.1.2. Products
- 12.1.1.3. Company Financials
- 12.1.1.4. SWOT Analysis
- 12.1.2 Novartis AG
- 12.1.2.1. Company Overview
- 12.1.2.2. Products
- 12.1.2.3. Company Financials
- 12.1.2.4. SWOT Analysis
- 12.1.3 Essilor International SA
- 12.1.3.1. Company Overview
- 12.1.3.2. Products
- 12.1.3.3. Company Financials
- 12.1.3.4. SWOT Analysis
- 12.1.4 The Cooper Companies
- 12.1.4.1. Company Overview
- 12.1.4.2. Products
- 12.1.4.3. Company Financials
- 12.1.4.4. SWOT Analysis
- 12.1.5 Johnson & Johnson Vision Care Inc *List Not Exhaustive
- 12.1.5.1. Company Overview
- 12.1.5.2. Products
- 12.1.5.3. Company Financials
- 12.1.5.4. SWOT Analysis
- 12.1.6 Bausch Health Companies Inc
- 12.1.6.1. Company Overview
- 12.1.6.2. Products
- 12.1.6.3. Company Financials
- 12.1.6.4. SWOT Analysis
- 12.1.7 Hoya Corporation
- 12.1.7.1. Company Overview
- 12.1.7.2. Products
- 12.1.7.3. Company Financials
- 12.1.7.4. SWOT Analysis
- 12.1.1 Zeiss Group
- 12.2. Market Entropy
- 12.2.1 Company's Key Areas Served
- 12.2.2 Recent Developments
- 12.3. Company Market Share Analysis 2025
- 12.3.1 Top 5 Companies Market Share Analysis
- 12.3.2 Top 3 Companies Market Share Analysis
- 12.4. List of Potential Customers
- 13. Research Methodology
List of Figures
- Figure 1: Global Soft Contact Lens Industry Revenue Breakdown (billion, %) by Region 2025 & 2033
- Figure 2: Global Soft Contact Lens Industry Volume Breakdown (K Units, %) by Region 2025 & 2033
- Figure 3: North America Soft Contact Lens Industry Revenue (billion), by Product Type 2025 & 2033
- Figure 4: North America Soft Contact Lens Industry Volume (K Units), by Product Type 2025 & 2033
- Figure 5: North America Soft Contact Lens Industry Revenue Share (%), by Product Type 2025 & 2033
- Figure 6: North America Soft Contact Lens Industry Volume Share (%), by Product Type 2025 & 2033
- Figure 7: North America Soft Contact Lens Industry Revenue (billion), by Usages 2025 & 2033
- Figure 8: North America Soft Contact Lens Industry Volume (K Units), by Usages 2025 & 2033
- Figure 9: North America Soft Contact Lens Industry Revenue Share (%), by Usages 2025 & 2033
- Figure 10: North America Soft Contact Lens Industry Volume Share (%), by Usages 2025 & 2033
- Figure 11: North America Soft Contact Lens Industry Revenue (billion), by Distribution Channel 2025 & 2033
- Figure 12: North America Soft Contact Lens Industry Volume (K Units), by Distribution Channel 2025 & 2033
- Figure 13: North America Soft Contact Lens Industry Revenue Share (%), by Distribution Channel 2025 & 2033
- Figure 14: North America Soft Contact Lens Industry Volume Share (%), by Distribution Channel 2025 & 2033
- Figure 15: North America Soft Contact Lens Industry Revenue (billion), by Country 2025 & 2033
- Figure 16: North America Soft Contact Lens Industry Volume (K Units), by Country 2025 & 2033
- Figure 17: North America Soft Contact Lens Industry Revenue Share (%), by Country 2025 & 2033
- Figure 18: North America Soft Contact Lens Industry Volume Share (%), by Country 2025 & 2033
- Figure 19: Europe Soft Contact Lens Industry Revenue (billion), by Product Type 2025 & 2033
- Figure 20: Europe Soft Contact Lens Industry Volume (K Units), by Product Type 2025 & 2033
- Figure 21: Europe Soft Contact Lens Industry Revenue Share (%), by Product Type 2025 & 2033
- Figure 22: Europe Soft Contact Lens Industry Volume Share (%), by Product Type 2025 & 2033
- Figure 23: Europe Soft Contact Lens Industry Revenue (billion), by Usages 2025 & 2033
- Figure 24: Europe Soft Contact Lens Industry Volume (K Units), by Usages 2025 & 2033
- Figure 25: Europe Soft Contact Lens Industry Revenue Share (%), by Usages 2025 & 2033
- Figure 26: Europe Soft Contact Lens Industry Volume Share (%), by Usages 2025 & 2033
- Figure 27: Europe Soft Contact Lens Industry Revenue (billion), by Distribution Channel 2025 & 2033
- Figure 28: Europe Soft Contact Lens Industry Volume (K Units), by Distribution Channel 2025 & 2033
- Figure 29: Europe Soft Contact Lens Industry Revenue Share (%), by Distribution Channel 2025 & 2033
- Figure 30: Europe Soft Contact Lens Industry Volume Share (%), by Distribution Channel 2025 & 2033
- Figure 31: Europe Soft Contact Lens Industry Revenue (billion), by Country 2025 & 2033
- Figure 32: Europe Soft Contact Lens Industry Volume (K Units), by Country 2025 & 2033
- Figure 33: Europe Soft Contact Lens Industry Revenue Share (%), by Country 2025 & 2033
- Figure 34: Europe Soft Contact Lens Industry Volume Share (%), by Country 2025 & 2033
- Figure 35: Asia Pacific Soft Contact Lens Industry Revenue (billion), by Product Type 2025 & 2033
- Figure 36: Asia Pacific Soft Contact Lens Industry Volume (K Units), by Product Type 2025 & 2033
- Figure 37: Asia Pacific Soft Contact Lens Industry Revenue Share (%), by Product Type 2025 & 2033
- Figure 38: Asia Pacific Soft Contact Lens Industry Volume Share (%), by Product Type 2025 & 2033
- Figure 39: Asia Pacific Soft Contact Lens Industry Revenue (billion), by Usages 2025 & 2033
- Figure 40: Asia Pacific Soft Contact Lens Industry Volume (K Units), by Usages 2025 & 2033
- Figure 41: Asia Pacific Soft Contact Lens Industry Revenue Share (%), by Usages 2025 & 2033
- Figure 42: Asia Pacific Soft Contact Lens Industry Volume Share (%), by Usages 2025 & 2033
- Figure 43: Asia Pacific Soft Contact Lens Industry Revenue (billion), by Distribution Channel 2025 & 2033
- Figure 44: Asia Pacific Soft Contact Lens Industry Volume (K Units), by Distribution Channel 2025 & 2033
- Figure 45: Asia Pacific Soft Contact Lens Industry Revenue Share (%), by Distribution Channel 2025 & 2033
- Figure 46: Asia Pacific Soft Contact Lens Industry Volume Share (%), by Distribution Channel 2025 & 2033
- Figure 47: Asia Pacific Soft Contact Lens Industry Revenue (billion), by Country 2025 & 2033
- Figure 48: Asia Pacific Soft Contact Lens Industry Volume (K Units), by Country 2025 & 2033
- Figure 49: Asia Pacific Soft Contact Lens Industry Revenue Share (%), by Country 2025 & 2033
- Figure 50: Asia Pacific Soft Contact Lens Industry Volume Share (%), by Country 2025 & 2033
- Figure 51: South America Soft Contact Lens Industry Revenue (billion), by Product Type 2025 & 2033
- Figure 52: South America Soft Contact Lens Industry Volume (K Units), by Product Type 2025 & 2033
- Figure 53: South America Soft Contact Lens Industry Revenue Share (%), by Product Type 2025 & 2033
- Figure 54: South America Soft Contact Lens Industry Volume Share (%), by Product Type 2025 & 2033
- Figure 55: South America Soft Contact Lens Industry Revenue (billion), by Usages 2025 & 2033
- Figure 56: South America Soft Contact Lens Industry Volume (K Units), by Usages 2025 & 2033
- Figure 57: South America Soft Contact Lens Industry Revenue Share (%), by Usages 2025 & 2033
- Figure 58: South America Soft Contact Lens Industry Volume Share (%), by Usages 2025 & 2033
- Figure 59: South America Soft Contact Lens Industry Revenue (billion), by Distribution Channel 2025 & 2033
- Figure 60: South America Soft Contact Lens Industry Volume (K Units), by Distribution Channel 2025 & 2033
- Figure 61: South America Soft Contact Lens Industry Revenue Share (%), by Distribution Channel 2025 & 2033
- Figure 62: South America Soft Contact Lens Industry Volume Share (%), by Distribution Channel 2025 & 2033
- Figure 63: South America Soft Contact Lens Industry Revenue (billion), by Country 2025 & 2033
- Figure 64: South America Soft Contact Lens Industry Volume (K Units), by Country 2025 & 2033
- Figure 65: South America Soft Contact Lens Industry Revenue Share (%), by Country 2025 & 2033
- Figure 66: South America Soft Contact Lens Industry Volume Share (%), by Country 2025 & 2033
- Figure 67: Middle East and Africa Soft Contact Lens Industry Revenue (billion), by Product Type 2025 & 2033
- Figure 68: Middle East and Africa Soft Contact Lens Industry Volume (K Units), by Product Type 2025 & 2033
- Figure 69: Middle East and Africa Soft Contact Lens Industry Revenue Share (%), by Product Type 2025 & 2033
- Figure 70: Middle East and Africa Soft Contact Lens Industry Volume Share (%), by Product Type 2025 & 2033
- Figure 71: Middle East and Africa Soft Contact Lens Industry Revenue (billion), by Usages 2025 & 2033
- Figure 72: Middle East and Africa Soft Contact Lens Industry Volume (K Units), by Usages 2025 & 2033
- Figure 73: Middle East and Africa Soft Contact Lens Industry Revenue Share (%), by Usages 2025 & 2033
- Figure 74: Middle East and Africa Soft Contact Lens Industry Volume Share (%), by Usages 2025 & 2033
- Figure 75: Middle East and Africa Soft Contact Lens Industry Revenue (billion), by Distribution Channel 2025 & 2033
- Figure 76: Middle East and Africa Soft Contact Lens Industry Volume (K Units), by Distribution Channel 2025 & 2033
- Figure 77: Middle East and Africa Soft Contact Lens Industry Revenue Share (%), by Distribution Channel 2025 & 2033
- Figure 78: Middle East and Africa Soft Contact Lens Industry Volume Share (%), by Distribution Channel 2025 & 2033
- Figure 79: Middle East and Africa Soft Contact Lens Industry Revenue (billion), by Country 2025 & 2033
- Figure 80: Middle East and Africa Soft Contact Lens Industry Volume (K Units), by Country 2025 & 2033
- Figure 81: Middle East and Africa Soft Contact Lens Industry Revenue Share (%), by Country 2025 & 2033
- Figure 82: Middle East and Africa Soft Contact Lens Industry Volume Share (%), by Country 2025 & 2033
List of Tables
- Table 1: Global Soft Contact Lens Industry Revenue billion Forecast, by Product Type 2020 & 2033
- Table 2: Global Soft Contact Lens Industry Volume K Units Forecast, by Product Type 2020 & 2033
- Table 3: Global Soft Contact Lens Industry Revenue billion Forecast, by Usages 2020 & 2033
- Table 4: Global Soft Contact Lens Industry Volume K Units Forecast, by Usages 2020 & 2033
- Table 5: Global Soft Contact Lens Industry Revenue billion Forecast, by Distribution Channel 2020 & 2033
- Table 6: Global Soft Contact Lens Industry Volume K Units Forecast, by Distribution Channel 2020 & 2033
- Table 7: Global Soft Contact Lens Industry Revenue billion Forecast, by Region 2020 & 2033
- Table 8: Global Soft Contact Lens Industry Volume K Units Forecast, by Region 2020 & 2033
- Table 9: Global Soft Contact Lens Industry Revenue billion Forecast, by Product Type 2020 & 2033
- Table 10: Global Soft Contact Lens Industry Volume K Units Forecast, by Product Type 2020 & 2033
- Table 11: Global Soft Contact Lens Industry Revenue billion Forecast, by Usages 2020 & 2033
- Table 12: Global Soft Contact Lens Industry Volume K Units Forecast, by Usages 2020 & 2033
- Table 13: Global Soft Contact Lens Industry Revenue billion Forecast, by Distribution Channel 2020 & 2033
- Table 14: Global Soft Contact Lens Industry Volume K Units Forecast, by Distribution Channel 2020 & 2033
- Table 15: Global Soft Contact Lens Industry Revenue billion Forecast, by Country 2020 & 2033
- Table 16: Global Soft Contact Lens Industry Volume K Units Forecast, by Country 2020 & 2033
- Table 17: United States Soft Contact Lens Industry Revenue (billion) Forecast, by Application 2020 & 2033
- Table 18: United States Soft Contact Lens Industry Volume (K Units) Forecast, by Application 2020 & 2033
- Table 19: Canada Soft Contact Lens Industry Revenue (billion) Forecast, by Application 2020 & 2033
- Table 20: Canada Soft Contact Lens Industry Volume (K Units) Forecast, by Application 2020 & 2033
- Table 21: Mexico Soft Contact Lens Industry Revenue (billion) Forecast, by Application 2020 & 2033
- Table 22: Mexico Soft Contact Lens Industry Volume (K Units) Forecast, by Application 2020 & 2033
- Table 23: Rest of North America Soft Contact Lens Industry Revenue (billion) Forecast, by Application 2020 & 2033
- Table 24: Rest of North America Soft Contact Lens Industry Volume (K Units) Forecast, by Application 2020 & 2033
- Table 25: Global Soft Contact Lens Industry Revenue billion Forecast, by Product Type 2020 & 2033
- Table 26: Global Soft Contact Lens Industry Volume K Units Forecast, by Product Type 2020 & 2033
- Table 27: Global Soft Contact Lens Industry Revenue billion Forecast, by Usages 2020 & 2033
- Table 28: Global Soft Contact Lens Industry Volume K Units Forecast, by Usages 2020 & 2033
- Table 29: Global Soft Contact Lens Industry Revenue billion Forecast, by Distribution Channel 2020 & 2033
- Table 30: Global Soft Contact Lens Industry Volume K Units Forecast, by Distribution Channel 2020 & 2033
- Table 31: Global Soft Contact Lens Industry Revenue billion Forecast, by Country 2020 & 2033
- Table 32: Global Soft Contact Lens Industry Volume K Units Forecast, by Country 2020 & 2033
- Table 33: United Kingdom Soft Contact Lens Industry Revenue (billion) Forecast, by Application 2020 & 2033
- Table 34: United Kingdom Soft Contact Lens Industry Volume (K Units) Forecast, by Application 2020 & 2033
- Table 35: Germany Soft Contact Lens Industry Revenue (billion) Forecast, by Application 2020 & 2033
- Table 36: Germany Soft Contact Lens Industry Volume (K Units) Forecast, by Application 2020 & 2033
- Table 37: France Soft Contact Lens Industry Revenue (billion) Forecast, by Application 2020 & 2033
- Table 38: France Soft Contact Lens Industry Volume (K Units) Forecast, by Application 2020 & 2033
- Table 39: Italy Soft Contact Lens Industry Revenue (billion) Forecast, by Application 2020 & 2033
- Table 40: Italy Soft Contact Lens Industry Volume (K Units) Forecast, by Application 2020 & 2033
- Table 41: Russia Soft Contact Lens Industry Revenue (billion) Forecast, by Application 2020 & 2033
- Table 42: Russia Soft Contact Lens Industry Volume (K Units) Forecast, by Application 2020 & 2033
- Table 43: Rest of Europe Soft Contact Lens Industry Revenue (billion) Forecast, by Application 2020 & 2033
- Table 44: Rest of Europe Soft Contact Lens Industry Volume (K Units) Forecast, by Application 2020 & 2033
- Table 45: Global Soft Contact Lens Industry Revenue billion Forecast, by Product Type 2020 & 2033
- Table 46: Global Soft Contact Lens Industry Volume K Units Forecast, by Product Type 2020 & 2033
- Table 47: Global Soft Contact Lens Industry Revenue billion Forecast, by Usages 2020 & 2033
- Table 48: Global Soft Contact Lens Industry Volume K Units Forecast, by Usages 2020 & 2033
- Table 49: Global Soft Contact Lens Industry Revenue billion Forecast, by Distribution Channel 2020 & 2033
- Table 50: Global Soft Contact Lens Industry Volume K Units Forecast, by Distribution Channel 2020 & 2033
- Table 51: Global Soft Contact Lens Industry Revenue billion Forecast, by Country 2020 & 2033
- Table 52: Global Soft Contact Lens Industry Volume K Units Forecast, by Country 2020 & 2033
- Table 53: China Soft Contact Lens Industry Revenue (billion) Forecast, by Application 2020 & 2033
- Table 54: China Soft Contact Lens Industry Volume (K Units) Forecast, by Application 2020 & 2033
- Table 55: Japan Soft Contact Lens Industry Revenue (billion) Forecast, by Application 2020 & 2033
- Table 56: Japan Soft Contact Lens Industry Volume (K Units) Forecast, by Application 2020 & 2033
- Table 57: India Soft Contact Lens Industry Revenue (billion) Forecast, by Application 2020 & 2033
- Table 58: India Soft Contact Lens Industry Volume (K Units) Forecast, by Application 2020 & 2033
- Table 59: Australia Soft Contact Lens Industry Revenue (billion) Forecast, by Application 2020 & 2033
- Table 60: Australia Soft Contact Lens Industry Volume (K Units) Forecast, by Application 2020 & 2033
- Table 61: Rest of Asia Pacific Soft Contact Lens Industry Revenue (billion) Forecast, by Application 2020 & 2033
- Table 62: Rest of Asia Pacific Soft Contact Lens Industry Volume (K Units) Forecast, by Application 2020 & 2033
- Table 63: Global Soft Contact Lens Industry Revenue billion Forecast, by Product Type 2020 & 2033
- Table 64: Global Soft Contact Lens Industry Volume K Units Forecast, by Product Type 2020 & 2033
- Table 65: Global Soft Contact Lens Industry Revenue billion Forecast, by Usages 2020 & 2033
- Table 66: Global Soft Contact Lens Industry Volume K Units Forecast, by Usages 2020 & 2033
- Table 67: Global Soft Contact Lens Industry Revenue billion Forecast, by Distribution Channel 2020 & 2033
- Table 68: Global Soft Contact Lens Industry Volume K Units Forecast, by Distribution Channel 2020 & 2033
- Table 69: Global Soft Contact Lens Industry Revenue billion Forecast, by Country 2020 & 2033
- Table 70: Global Soft Contact Lens Industry Volume K Units Forecast, by Country 2020 & 2033
- Table 71: Brazil Soft Contact Lens Industry Revenue (billion) Forecast, by Application 2020 & 2033
- Table 72: Brazil Soft Contact Lens Industry Volume (K Units) Forecast, by Application 2020 & 2033
- Table 73: Argentina Soft Contact Lens Industry Revenue (billion) Forecast, by Application 2020 & 2033
- Table 74: Argentina Soft Contact Lens Industry Volume (K Units) Forecast, by Application 2020 & 2033
- Table 75: Rest of South America Soft Contact Lens Industry Revenue (billion) Forecast, by Application 2020 & 2033
- Table 76: Rest of South America Soft Contact Lens Industry Volume (K Units) Forecast, by Application 2020 & 2033
- Table 77: Global Soft Contact Lens Industry Revenue billion Forecast, by Product Type 2020 & 2033
- Table 78: Global Soft Contact Lens Industry Volume K Units Forecast, by Product Type 2020 & 2033
- Table 79: Global Soft Contact Lens Industry Revenue billion Forecast, by Usages 2020 & 2033
- Table 80: Global Soft Contact Lens Industry Volume K Units Forecast, by Usages 2020 & 2033
- Table 81: Global Soft Contact Lens Industry Revenue billion Forecast, by Distribution Channel 2020 & 2033
- Table 82: Global Soft Contact Lens Industry Volume K Units Forecast, by Distribution Channel 2020 & 2033
- Table 83: Global Soft Contact Lens Industry Revenue billion Forecast, by Country 2020 & 2033
- Table 84: Global Soft Contact Lens Industry Volume K Units Forecast, by Country 2020 & 2033
- Table 85: South Africa Soft Contact Lens Industry Revenue (billion) Forecast, by Application 2020 & 2033
- Table 86: South Africa Soft Contact Lens Industry Volume (K Units) Forecast, by Application 2020 & 2033
- Table 87: United Arab Emirates Soft Contact Lens Industry Revenue (billion) Forecast, by Application 2020 & 2033
- Table 88: United Arab Emirates Soft Contact Lens Industry Volume (K Units) Forecast, by Application 2020 & 2033
- Table 89: Rest of Middle East and Africa Soft Contact Lens Industry Revenue (billion) Forecast, by Application 2020 & 2033
- Table 90: Rest of Middle East and Africa Soft Contact Lens Industry Volume (K Units) Forecast, by Application 2020 & 2033
Frequently Asked Questions
1. What is the projected Compound Annual Growth Rate (CAGR) of the Soft Contact Lens Industry?
The projected CAGR is approximately 6.21%.
2. Which companies are prominent players in the Soft Contact Lens Industry?
Key companies in the market include Zeiss Group, Novartis AG, Essilor International SA, The Cooper Companies, Johnson & Johnson Vision Care Inc *List Not Exhaustive, Bausch Health Companies Inc, Hoya Corporation.
3. What are the main segments of the Soft Contact Lens Industry?
The market segments include Product Type, Usages, Distribution Channel.
4. Can you provide details about the market size?
The market size is estimated to be USD 97.6 billion as of 2022.
5. What are some drivers contributing to market growth?
Increasing Sports Participation is Boosting the Market Growth; Increasing Innovation and Upgradation in Merchandizing Products.
6. What are the notable trends driving market growth?
Rigid Gas Permeable Contact Lenses Segment is Expected to Exhibit the Fastest Growth Rate over the Forecast Period.
7. Are there any restraints impacting market growth?
Availability of Counterfeit Sports Merchandise Products.
8. Can you provide examples of recent developments in the market?
N/A
9. What pricing options are available for accessing the report?
Pricing options include single-user, multi-user, and enterprise licenses priced at USD 4750, USD 5250, and USD 8750 respectively.
10. Is the market size provided in terms of value or volume?
The market size is provided in terms of value, measured in billion and volume, measured in K Units.
11. Are there any specific market keywords associated with the report?
Yes, the market keyword associated with the report is "Soft Contact Lens Industry," which aids in identifying and referencing the specific market segment covered.
12. How do I determine which pricing option suits my needs best?
The pricing options vary based on user requirements and access needs. Individual users may opt for single-user licenses, while businesses requiring broader access may choose multi-user or enterprise licenses for cost-effective access to the report.
13. Are there any additional resources or data provided in the Soft Contact Lens Industry report?
While the report offers comprehensive insights, it's advisable to review the specific contents or supplementary materials provided to ascertain if additional resources or data are available.
14. How can I stay updated on further developments or reports in the Soft Contact Lens Industry?
To stay informed about further developments, trends, and reports in the Soft Contact Lens Industry, consider subscribing to industry newsletters, following relevant companies and organizations, or regularly checking reputable industry news sources and publications.
Methodology
Step 1 - Identification of Relevant Samples Size from Population Database


Step 2 - Approaches for Defining Global Market Size (Value, Volume* & Price*)

Note*: In applicable scenarios
Step 3 - Data Sources
Primary Research
- Web Analytics
- Survey Reports
- Research Institute
- Latest Research Reports
- Opinion Leaders
Secondary Research
- Annual Reports
- White Paper
- Latest Press Release
- Industry Association
- Paid Database
- Investor Presentations

Step 4 - Data Triangulation
Involves using different sources of information in order to increase the validity of a study
These sources are likely to be stakeholders in a program - participants, other researchers, program staff, other community members, and so on.
Then we put all data in single framework & apply various statistical tools to find out the dynamic on the market.
During the analysis stage, feedback from the stakeholder groups would be compared to determine areas of agreement as well as areas of divergence