
Key Insights
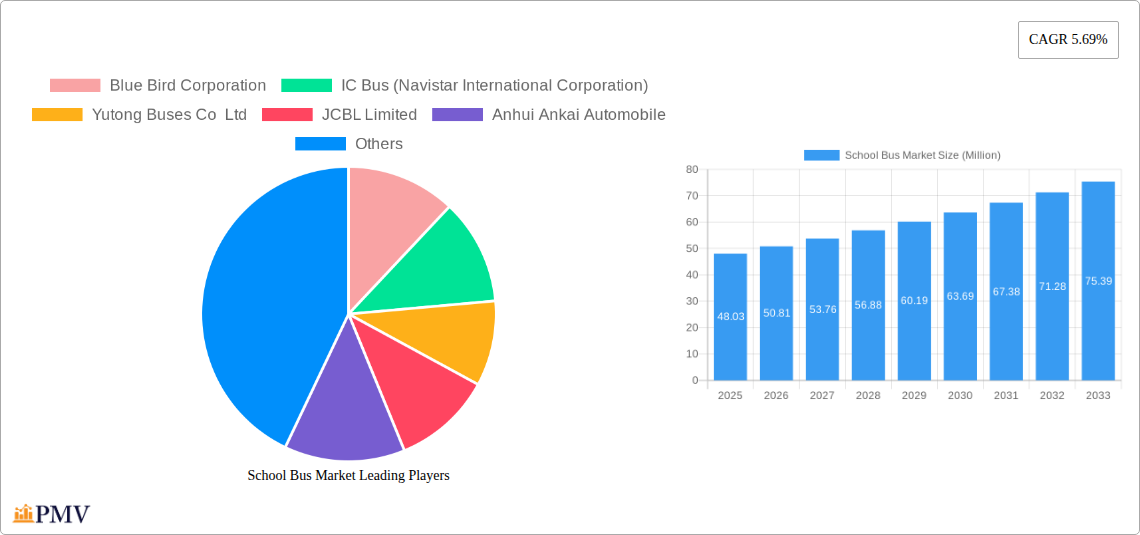
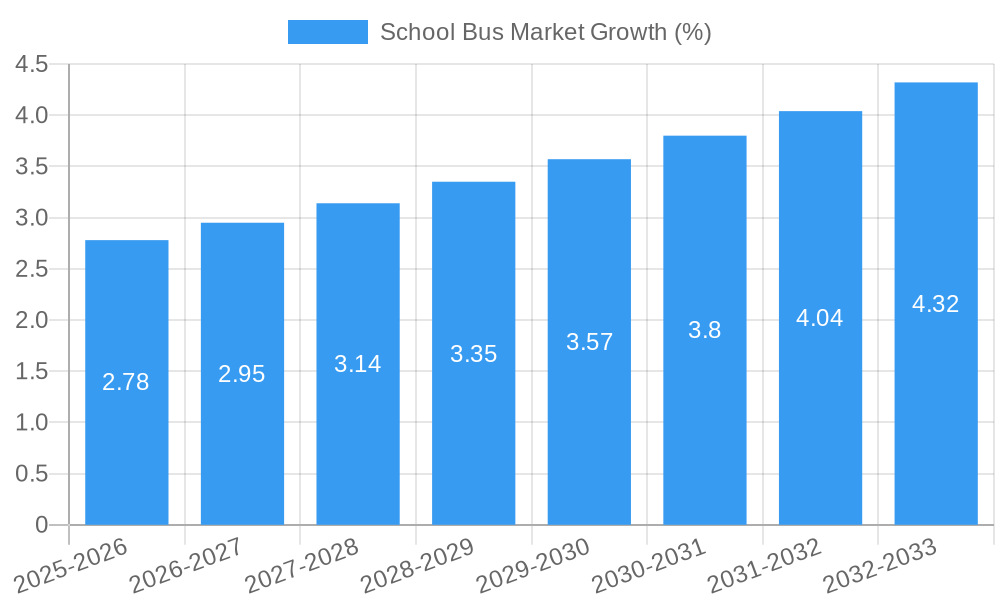
The global school bus market, valued at $48.03 million in 2025, is projected to experience robust growth, driven by increasing school-age populations, rising government initiatives promoting safe and reliable transportation for students, and a growing preference for specialized school buses offering enhanced safety features and comfort. The market's Compound Annual Growth Rate (CAGR) of 5.69% from 2025 to 2033 indicates a significant expansion over the forecast period. Key segments driving this growth include the electric and hybrid propulsion type, reflecting a global shift towards sustainable transportation solutions and stricter emission regulations. The demand for larger capacity school buses (Type B, C, and D) is also expected to increase, driven by the needs of larger school districts and growing student populations. Geographic expansion is another significant factor, with developing economies in Asia-Pacific showing substantial potential for growth, fueled by increasing urbanization and improving infrastructure. While challenges remain, such as fluctuating fuel prices impacting internal combustion engine (ICE) bus costs and the high initial investment associated with electric buses, the overall market outlook remains positive due to the long-term benefits of safety, sustainability, and improved student transportation.
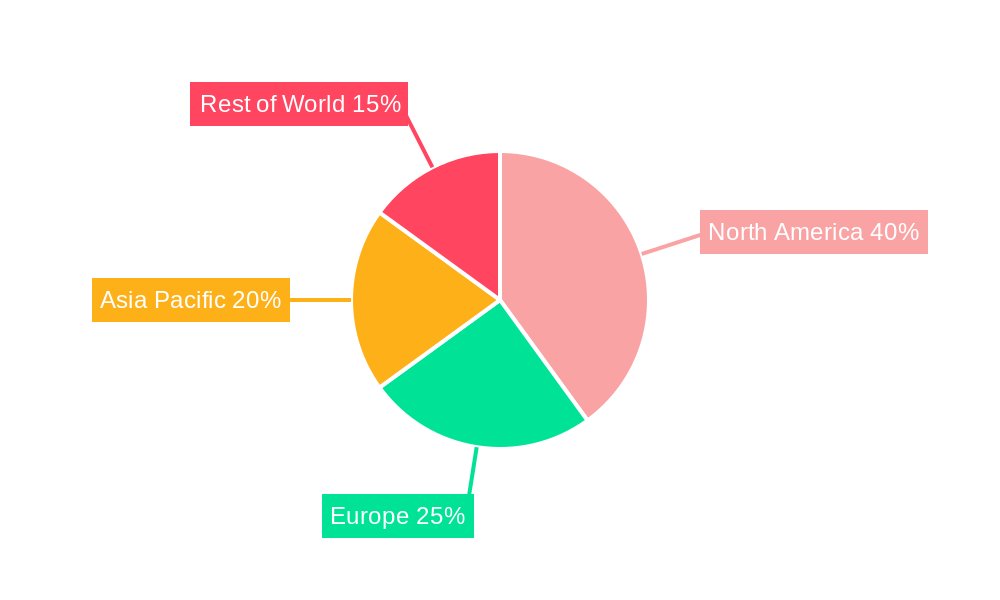
The competitive landscape is characterized by a mix of established players like Blue Bird Corporation and Thomas Built Buses, alongside emerging companies specializing in electric buses, such as Lion Electric Company. These companies are continually innovating to meet evolving market demands, focusing on advancements in safety technology, fuel efficiency, and reduced emissions. The market's segmentation by propulsion type (ICE, CNG/LNG, Electric/Hybrid) and capacity design type (Type A, B, C, D) provides a nuanced understanding of the diverse needs and preferences within the school bus market. Regional variations in market growth are expected, with North America and Europe maintaining significant market shares due to established infrastructure and stringent safety regulations. However, the Asia-Pacific region is projected to witness the fastest growth rate due to its expanding school-age population and increasing investments in public transportation. The market's growth trajectory is expected to be influenced by government policies, technological advancements, and economic conditions in different regions.
School Bus Market: A Comprehensive Report (2019-2033)
This comprehensive report provides an in-depth analysis of the global school bus market, encompassing market size, segmentation, competitive landscape, and future growth prospects. The study period covers 2019-2033, with 2025 as the base year and forecast extending to 2033. The report offers invaluable insights for industry stakeholders, including manufacturers, suppliers, investors, and government agencies. The market is valued at xx Million in 2025 and is projected to reach xx Million by 2033, exhibiting a CAGR of xx% during the forecast period.
School Bus Market Structure & Competitive Dynamics
The global school bus market exhibits a moderately consolidated structure, with several major players vying for market share. Market concentration is influenced by factors such as economies of scale, technological advancements, and regulatory compliance. Innovation ecosystems are driven by investments in electric and hybrid propulsion systems, advanced safety features, and improved fuel efficiency technologies. Regulatory frameworks, particularly concerning emissions standards and safety regulations, significantly impact market dynamics. Product substitutes, such as ride-sharing services, are posing incremental challenges, especially in urban areas. End-user trends, primarily driven by increasing safety concerns and environmental awareness, are fueling the demand for safer and more sustainable school bus solutions. M&A activities in the industry have been moderate, with deal values ranging from xx Million to xx Million in recent years, primarily focused on consolidating market positions and acquiring specialized technologies.
- Market Share: Blue Bird Corporation holds approximately xx% market share, followed by IC Bus (Navistar International Corporation) with xx%, and Yutong Buses Co Ltd with xx%. Other significant players include JCBL Limited, Anhui Ankai Automobile, and Thomas Built Buses Inc.
- M&A Activity: The past five years have seen xx major M&A deals, with a total value of approximately xx Million.
School Bus Market Industry Trends & Insights
The school bus market is experiencing significant transformation driven by several key factors. Stringent emission regulations worldwide are accelerating the adoption of electric and hybrid school buses, leading to a substantial shift in propulsion technology preferences. Technological disruptions, particularly in battery technology and autonomous driving systems, are shaping the future of school bus design and operations. Consumer preferences are increasingly focused on safety features, such as advanced driver-assistance systems (ADAS) and improved passenger restraint systems, along with enhanced sustainability and environmental friendliness. Competitive dynamics are characterized by intense rivalry among established players and the emergence of new entrants focusing on electric and autonomous solutions. This competitive landscape drives innovation and pushes prices downward, benefiting consumers. The market's overall growth is primarily fueled by increasing student enrollment in schools, government initiatives promoting greener transportation, and rising safety concerns.
Dominant Markets & Segments in School Bus Market
The North American region currently dominates the global school bus market, driven by robust school bus fleets and supportive government regulations. Within this region, the United States holds the largest market share, followed by Canada. Key drivers for this dominance include substantial investments in school infrastructure, relatively higher disposable income levels, and a well-established school bus transportation system. In terms of segments, the Internal Combustion Engine (ICE) segment currently holds the largest market share within the propulsion type category, although the electric and hybrid segment is witnessing the fastest growth rate, driven by environmental concerns and government incentives. The Type C school bus segment dominates by capacity design type, due to its suitability for carrying a larger number of students.
- Key Drivers for North American Dominance:
- Strong governmental support for school transportation
- Established school bus infrastructure
- High levels of student enrollment
- Favorable economic conditions
- Key Drivers for Electric/Hybrid Segment Growth:
- Stringent emission regulations
- Government incentives and subsidies
- Growing environmental awareness
School Bus Market Product Innovations
Recent product developments are largely focused on improving safety, fuel efficiency, and environmental performance. The introduction of electric and hybrid school buses with enhanced battery technology and extended ranges is transforming the market. Advanced safety features such as collision avoidance systems, electronic stability control, and driver-monitoring systems are becoming increasingly common. These innovations aim to improve operational efficiency, reduce environmental impact, and enhance passenger safety. The successful market fit for these new products depends on several factors, such as cost-effectiveness, regulatory compliance, and consumer acceptance.
Report Segmentation & Scope
This report segments the school bus market by propulsion type (Internal Combustion Engine (ICE), Compressed Natural Gas (CNG)/Liquified Natural Gas (LNG), Electric and Hybrid) and by capacity design type (Type A, Type B, Type C, Type D). Each segment is thoroughly analyzed, providing insights into market size, growth projections, and competitive dynamics. The ICE segment is expected to witness a decline in market share over the forecast period, while the electric and hybrid segment is poised for significant expansion. Similarly, Type C buses will likely retain their market dominance, but the growth of electric versions across all types will influence the overall market.
Key Drivers of School Bus Market Growth
The growth of the school bus market is primarily driven by several key factors. Technological advancements, especially in electric and hybrid technologies, are improving the efficiency and environmental performance of school buses. Economic factors, such as increasing government spending on education and infrastructure development, are contributing to market expansion. Stringent environmental regulations promoting the adoption of cleaner transportation solutions are further boosting demand. Finally, rising safety concerns and the need for reliable and secure student transportation are driving the adoption of advanced safety technologies in school buses.
Challenges in the School Bus Market Sector
The school bus market faces several significant challenges. Regulatory hurdles, particularly concerning emission standards and safety regulations, can impede market growth. Supply chain disruptions, especially concerning battery components and other critical materials, can impact production and availability. Competitive pressures, including price competition and the emergence of new technologies, can affect profitability. These challenges, if not properly addressed, could significantly affect the market's overall growth trajectory.
Leading Players in the School Bus Market Market
- Blue Bird Corporation
- IC Bus (Navistar International Corporation)
- Yutong Buses Co Ltd
- JCBL Limited
- Anhui Ankai Automobile
- Thomas Built Buses Inc
- Lion Electric Company
- Collins Bus Corporation
- Tata Motor
Key Developments in School Bus Market Sector
- December 2023: GreenPower Motor Company secures first orders for its all-electric Type A Nano BEAST school bus in the New York market.
- October 2023: GreenPower unveils the Mega BEAST, a Type D electric school bus with a 140-mile range.
- September 2023: Phoenix Motor Inc. receives an order for ten all-electric Type-A school buses for the District of Columbia.
Strategic School Bus Market Outlook
The school bus market presents significant growth opportunities over the next decade. The ongoing shift towards electric and hybrid propulsion systems, coupled with the integration of advanced safety features, is expected to drive market expansion. Government initiatives promoting sustainable transportation and investments in school infrastructure will further contribute to market growth. Companies focusing on innovation, technological advancements, and cost-effective solutions are well-positioned to capitalize on these opportunities.
School Bus Market Segmentation
-
1. Propulsion Type
- 1.1. Internal Combustion Engine (ICE)
- 1.2. Compress
- 1.3. Electric and Hybrid
-
2. Capacity Design Type
- 2.1. Type A
- 2.2. Type B
- 2.3. Type C
- 2.4. Type D
School Bus Market Segmentation By Geography
-
1. North America
- 1.1. United States
- 1.2. Canada
- 1.3. Mexico
- 1.4. Rest of North America
-
2. Europe
- 2.1. Germany
- 2.2. United Kingdom
- 2.3. France
- 2.4. Russia
- 2.5. Spain
- 2.6. Rest of Europe
-
3. Asia Pacific
- 3.1. China
- 3.2. India
- 3.3. Japan
- 3.4. South Korea
- 3.5. Rest of Asia Pacific
-
4. Rest of the World
- 4.1. South America
- 4.2. Middle East and Africa
School Bus Market REPORT HIGHLIGHTS
| Aspects | Details |
|---|---|
| Study Period | 2019-2033 |
| Base Year | 2024 |
| Estimated Year | 2025 |
| Forecast Period | 2025-2033 |
| Historical Period | 2019-2024 |
| Growth Rate | CAGR of 5.69% from 2019-2033 |
| Segmentation |
|
Table of Contents
- 1. Introduction
- 1.1. Research Scope
- 1.2. Market Segmentation
- 1.3. Research Methodology
- 1.4. Definitions and Assumptions
- 2. Executive Summary
- 2.1. Introduction
- 3. Market Dynamics
- 3.1. Introduction
- 3.2. Market Drivers
- 3.2.1. Government Initiatives Worldwide Supporting Education Infrastructure are Propelling Growth
- 3.3. Market Restrains
- 3.3.1. Stringent Regulatory Compliance Standards Related to Emissions and Safety Present Hurdles
- 3.4. Market Trends
- 3.4.1. Growing Sales of Electric School Buses to Witness Growth in Coming Years
- 4. Market Factor Analysis
- 4.1. Porters Five Forces
- 4.2. Supply/Value Chain
- 4.3. PESTEL analysis
- 4.4. Market Entropy
- 4.5. Patent/Trademark Analysis
- 5. Global School Bus Market Analysis, Insights and Forecast, 2019-2031
- 5.1. Market Analysis, Insights and Forecast - by Propulsion Type
- 5.1.1. Internal Combustion Engine (ICE)
- 5.1.2. Compress
- 5.1.3. Electric and Hybrid
- 5.2. Market Analysis, Insights and Forecast - by Capacity Design Type
- 5.2.1. Type A
- 5.2.2. Type B
- 5.2.3. Type C
- 5.2.4. Type D
- 5.3. Market Analysis, Insights and Forecast - by Region
- 5.3.1. North America
- 5.3.2. Europe
- 5.3.3. Asia Pacific
- 5.3.4. Rest of the World
- 5.1. Market Analysis, Insights and Forecast - by Propulsion Type
- 6. North America School Bus Market Analysis, Insights and Forecast, 2019-2031
- 6.1. Market Analysis, Insights and Forecast - by Propulsion Type
- 6.1.1. Internal Combustion Engine (ICE)
- 6.1.2. Compress
- 6.1.3. Electric and Hybrid
- 6.2. Market Analysis, Insights and Forecast - by Capacity Design Type
- 6.2.1. Type A
- 6.2.2. Type B
- 6.2.3. Type C
- 6.2.4. Type D
- 6.1. Market Analysis, Insights and Forecast - by Propulsion Type
- 7. Europe School Bus Market Analysis, Insights and Forecast, 2019-2031
- 7.1. Market Analysis, Insights and Forecast - by Propulsion Type
- 7.1.1. Internal Combustion Engine (ICE)
- 7.1.2. Compress
- 7.1.3. Electric and Hybrid
- 7.2. Market Analysis, Insights and Forecast - by Capacity Design Type
- 7.2.1. Type A
- 7.2.2. Type B
- 7.2.3. Type C
- 7.2.4. Type D
- 7.1. Market Analysis, Insights and Forecast - by Propulsion Type
- 8. Asia Pacific School Bus Market Analysis, Insights and Forecast, 2019-2031
- 8.1. Market Analysis, Insights and Forecast - by Propulsion Type
- 8.1.1. Internal Combustion Engine (ICE)
- 8.1.2. Compress
- 8.1.3. Electric and Hybrid
- 8.2. Market Analysis, Insights and Forecast - by Capacity Design Type
- 8.2.1. Type A
- 8.2.2. Type B
- 8.2.3. Type C
- 8.2.4. Type D
- 8.1. Market Analysis, Insights and Forecast - by Propulsion Type
- 9. Rest of the World School Bus Market Analysis, Insights and Forecast, 2019-2031
- 9.1. Market Analysis, Insights and Forecast - by Propulsion Type
- 9.1.1. Internal Combustion Engine (ICE)
- 9.1.2. Compress
- 9.1.3. Electric and Hybrid
- 9.2. Market Analysis, Insights and Forecast - by Capacity Design Type
- 9.2.1. Type A
- 9.2.2. Type B
- 9.2.3. Type C
- 9.2.4. Type D
- 9.1. Market Analysis, Insights and Forecast - by Propulsion Type
- 10. North America School Bus Market Analysis, Insights and Forecast, 2019-2031
- 10.1. Market Analysis, Insights and Forecast - By Country/Sub-region
- 10.1.1 United States
- 10.1.2 Canada
- 10.1.3 Mexico
- 10.1.4 Rest of North America
- 11. Europe School Bus Market Analysis, Insights and Forecast, 2019-2031
- 11.1. Market Analysis, Insights and Forecast - By Country/Sub-region
- 11.1.1 Germany
- 11.1.2 United Kingdom
- 11.1.3 France
- 11.1.4 Russia
- 11.1.5 Spain
- 11.1.6 Rest of Europe
- 12. Asia Pacific School Bus Market Analysis, Insights and Forecast, 2019-2031
- 12.1. Market Analysis, Insights and Forecast - By Country/Sub-region
- 12.1.1 China
- 12.1.2 India
- 12.1.3 Japan
- 12.1.4 South Korea
- 12.1.5 Rest of Asia Pacific
- 13. Rest of the World School Bus Market Analysis, Insights and Forecast, 2019-2031
- 13.1. Market Analysis, Insights and Forecast - By Country/Sub-region
- 13.1.1 South America
- 13.1.2 Middle East and Africa
- 14. Competitive Analysis
- 14.1. Global Market Share Analysis 2024
- 14.2. Company Profiles
- 14.2.1 Blue Bird Corporation
- 14.2.1.1. Overview
- 14.2.1.2. Products
- 14.2.1.3. SWOT Analysis
- 14.2.1.4. Recent Developments
- 14.2.1.5. Financials (Based on Availability)
- 14.2.2 IC Bus (Navistar International Corporation)
- 14.2.2.1. Overview
- 14.2.2.2. Products
- 14.2.2.3. SWOT Analysis
- 14.2.2.4. Recent Developments
- 14.2.2.5. Financials (Based on Availability)
- 14.2.3 Yutong Buses Co Ltd
- 14.2.3.1. Overview
- 14.2.3.2. Products
- 14.2.3.3. SWOT Analysis
- 14.2.3.4. Recent Developments
- 14.2.3.5. Financials (Based on Availability)
- 14.2.4 JCBL Limited
- 14.2.4.1. Overview
- 14.2.4.2. Products
- 14.2.4.3. SWOT Analysis
- 14.2.4.4. Recent Developments
- 14.2.4.5. Financials (Based on Availability)
- 14.2.5 Anhui Ankai Automobile
- 14.2.5.1. Overview
- 14.2.5.2. Products
- 14.2.5.3. SWOT Analysis
- 14.2.5.4. Recent Developments
- 14.2.5.5. Financials (Based on Availability)
- 14.2.6 Thomas Built Buses Inc
- 14.2.6.1. Overview
- 14.2.6.2. Products
- 14.2.6.3. SWOT Analysis
- 14.2.6.4. Recent Developments
- 14.2.6.5. Financials (Based on Availability)
- 14.2.7 Lion Electric Company
- 14.2.7.1. Overview
- 14.2.7.2. Products
- 14.2.7.3. SWOT Analysis
- 14.2.7.4. Recent Developments
- 14.2.7.5. Financials (Based on Availability)
- 14.2.8 Collins Bus Corporation
- 14.2.8.1. Overview
- 14.2.8.2. Products
- 14.2.8.3. SWOT Analysis
- 14.2.8.4. Recent Developments
- 14.2.8.5. Financials (Based on Availability)
- 14.2.9 Tata Motor
- 14.2.9.1. Overview
- 14.2.9.2. Products
- 14.2.9.3. SWOT Analysis
- 14.2.9.4. Recent Developments
- 14.2.9.5. Financials (Based on Availability)
- 14.2.1 Blue Bird Corporation
List of Figures
- Figure 1: Global School Bus Market Revenue Breakdown (Million, %) by Region 2024 & 2032
- Figure 2: North America School Bus Market Revenue (Million), by Country 2024 & 2032
- Figure 3: North America School Bus Market Revenue Share (%), by Country 2024 & 2032
- Figure 4: Europe School Bus Market Revenue (Million), by Country 2024 & 2032
- Figure 5: Europe School Bus Market Revenue Share (%), by Country 2024 & 2032
- Figure 6: Asia Pacific School Bus Market Revenue (Million), by Country 2024 & 2032
- Figure 7: Asia Pacific School Bus Market Revenue Share (%), by Country 2024 & 2032
- Figure 8: Rest of the World School Bus Market Revenue (Million), by Country 2024 & 2032
- Figure 9: Rest of the World School Bus Market Revenue Share (%), by Country 2024 & 2032
- Figure 10: North America School Bus Market Revenue (Million), by Propulsion Type 2024 & 2032
- Figure 11: North America School Bus Market Revenue Share (%), by Propulsion Type 2024 & 2032
- Figure 12: North America School Bus Market Revenue (Million), by Capacity Design Type 2024 & 2032
- Figure 13: North America School Bus Market Revenue Share (%), by Capacity Design Type 2024 & 2032
- Figure 14: North America School Bus Market Revenue (Million), by Country 2024 & 2032
- Figure 15: North America School Bus Market Revenue Share (%), by Country 2024 & 2032
- Figure 16: Europe School Bus Market Revenue (Million), by Propulsion Type 2024 & 2032
- Figure 17: Europe School Bus Market Revenue Share (%), by Propulsion Type 2024 & 2032
- Figure 18: Europe School Bus Market Revenue (Million), by Capacity Design Type 2024 & 2032
- Figure 19: Europe School Bus Market Revenue Share (%), by Capacity Design Type 2024 & 2032
- Figure 20: Europe School Bus Market Revenue (Million), by Country 2024 & 2032
- Figure 21: Europe School Bus Market Revenue Share (%), by Country 2024 & 2032
- Figure 22: Asia Pacific School Bus Market Revenue (Million), by Propulsion Type 2024 & 2032
- Figure 23: Asia Pacific School Bus Market Revenue Share (%), by Propulsion Type 2024 & 2032
- Figure 24: Asia Pacific School Bus Market Revenue (Million), by Capacity Design Type 2024 & 2032
- Figure 25: Asia Pacific School Bus Market Revenue Share (%), by Capacity Design Type 2024 & 2032
- Figure 26: Asia Pacific School Bus Market Revenue (Million), by Country 2024 & 2032
- Figure 27: Asia Pacific School Bus Market Revenue Share (%), by Country 2024 & 2032
- Figure 28: Rest of the World School Bus Market Revenue (Million), by Propulsion Type 2024 & 2032
- Figure 29: Rest of the World School Bus Market Revenue Share (%), by Propulsion Type 2024 & 2032
- Figure 30: Rest of the World School Bus Market Revenue (Million), by Capacity Design Type 2024 & 2032
- Figure 31: Rest of the World School Bus Market Revenue Share (%), by Capacity Design Type 2024 & 2032
- Figure 32: Rest of the World School Bus Market Revenue (Million), by Country 2024 & 2032
- Figure 33: Rest of the World School Bus Market Revenue Share (%), by Country 2024 & 2032
List of Tables
- Table 1: Global School Bus Market Revenue Million Forecast, by Region 2019 & 2032
- Table 2: Global School Bus Market Revenue Million Forecast, by Propulsion Type 2019 & 2032
- Table 3: Global School Bus Market Revenue Million Forecast, by Capacity Design Type 2019 & 2032
- Table 4: Global School Bus Market Revenue Million Forecast, by Region 2019 & 2032
- Table 5: Global School Bus Market Revenue Million Forecast, by Country 2019 & 2032
- Table 6: United States School Bus Market Revenue (Million) Forecast, by Application 2019 & 2032
- Table 7: Canada School Bus Market Revenue (Million) Forecast, by Application 2019 & 2032
- Table 8: Mexico School Bus Market Revenue (Million) Forecast, by Application 2019 & 2032
- Table 9: Rest of North America School Bus Market Revenue (Million) Forecast, by Application 2019 & 2032
- Table 10: Global School Bus Market Revenue Million Forecast, by Country 2019 & 2032
- Table 11: Germany School Bus Market Revenue (Million) Forecast, by Application 2019 & 2032
- Table 12: United Kingdom School Bus Market Revenue (Million) Forecast, by Application 2019 & 2032
- Table 13: France School Bus Market Revenue (Million) Forecast, by Application 2019 & 2032
- Table 14: Russia School Bus Market Revenue (Million) Forecast, by Application 2019 & 2032
- Table 15: Spain School Bus Market Revenue (Million) Forecast, by Application 2019 & 2032
- Table 16: Rest of Europe School Bus Market Revenue (Million) Forecast, by Application 2019 & 2032
- Table 17: Global School Bus Market Revenue Million Forecast, by Country 2019 & 2032
- Table 18: China School Bus Market Revenue (Million) Forecast, by Application 2019 & 2032
- Table 19: India School Bus Market Revenue (Million) Forecast, by Application 2019 & 2032
- Table 20: Japan School Bus Market Revenue (Million) Forecast, by Application 2019 & 2032
- Table 21: South Korea School Bus Market Revenue (Million) Forecast, by Application 2019 & 2032
- Table 22: Rest of Asia Pacific School Bus Market Revenue (Million) Forecast, by Application 2019 & 2032
- Table 23: Global School Bus Market Revenue Million Forecast, by Country 2019 & 2032
- Table 24: South America School Bus Market Revenue (Million) Forecast, by Application 2019 & 2032
- Table 25: Middle East and Africa School Bus Market Revenue (Million) Forecast, by Application 2019 & 2032
- Table 26: Global School Bus Market Revenue Million Forecast, by Propulsion Type 2019 & 2032
- Table 27: Global School Bus Market Revenue Million Forecast, by Capacity Design Type 2019 & 2032
- Table 28: Global School Bus Market Revenue Million Forecast, by Country 2019 & 2032
- Table 29: United States School Bus Market Revenue (Million) Forecast, by Application 2019 & 2032
- Table 30: Canada School Bus Market Revenue (Million) Forecast, by Application 2019 & 2032
- Table 31: Mexico School Bus Market Revenue (Million) Forecast, by Application 2019 & 2032
- Table 32: Rest of North America School Bus Market Revenue (Million) Forecast, by Application 2019 & 2032
- Table 33: Global School Bus Market Revenue Million Forecast, by Propulsion Type 2019 & 2032
- Table 34: Global School Bus Market Revenue Million Forecast, by Capacity Design Type 2019 & 2032
- Table 35: Global School Bus Market Revenue Million Forecast, by Country 2019 & 2032
- Table 36: Germany School Bus Market Revenue (Million) Forecast, by Application 2019 & 2032
- Table 37: United Kingdom School Bus Market Revenue (Million) Forecast, by Application 2019 & 2032
- Table 38: France School Bus Market Revenue (Million) Forecast, by Application 2019 & 2032
- Table 39: Russia School Bus Market Revenue (Million) Forecast, by Application 2019 & 2032
- Table 40: Spain School Bus Market Revenue (Million) Forecast, by Application 2019 & 2032
- Table 41: Rest of Europe School Bus Market Revenue (Million) Forecast, by Application 2019 & 2032
- Table 42: Global School Bus Market Revenue Million Forecast, by Propulsion Type 2019 & 2032
- Table 43: Global School Bus Market Revenue Million Forecast, by Capacity Design Type 2019 & 2032
- Table 44: Global School Bus Market Revenue Million Forecast, by Country 2019 & 2032
- Table 45: China School Bus Market Revenue (Million) Forecast, by Application 2019 & 2032
- Table 46: India School Bus Market Revenue (Million) Forecast, by Application 2019 & 2032
- Table 47: Japan School Bus Market Revenue (Million) Forecast, by Application 2019 & 2032
- Table 48: South Korea School Bus Market Revenue (Million) Forecast, by Application 2019 & 2032
- Table 49: Rest of Asia Pacific School Bus Market Revenue (Million) Forecast, by Application 2019 & 2032
- Table 50: Global School Bus Market Revenue Million Forecast, by Propulsion Type 2019 & 2032
- Table 51: Global School Bus Market Revenue Million Forecast, by Capacity Design Type 2019 & 2032
- Table 52: Global School Bus Market Revenue Million Forecast, by Country 2019 & 2032
- Table 53: South America School Bus Market Revenue (Million) Forecast, by Application 2019 & 2032
- Table 54: Middle East and Africa School Bus Market Revenue (Million) Forecast, by Application 2019 & 2032
Frequently Asked Questions
1. What is the projected Compound Annual Growth Rate (CAGR) of the School Bus Market?
The projected CAGR is approximately 5.69%.
2. Which companies are prominent players in the School Bus Market?
Key companies in the market include Blue Bird Corporation, IC Bus (Navistar International Corporation), Yutong Buses Co Ltd, JCBL Limited, Anhui Ankai Automobile, Thomas Built Buses Inc, Lion Electric Company, Collins Bus Corporation, Tata Motor.
3. What are the main segments of the School Bus Market?
The market segments include Propulsion Type, Capacity Design Type.
4. Can you provide details about the market size?
The market size is estimated to be USD 48.03 Million as of 2022.
5. What are some drivers contributing to market growth?
Government Initiatives Worldwide Supporting Education Infrastructure are Propelling Growth.
6. What are the notable trends driving market growth?
Growing Sales of Electric School Buses to Witness Growth in Coming Years.
7. Are there any restraints impacting market growth?
Stringent Regulatory Compliance Standards Related to Emissions and Safety Present Hurdles.
8. Can you provide examples of recent developments in the market?
Dec 2023: GreenPower Motor Company announced its first orders for the Type A all-electric, purpose-built, zero-emission Nano BEAST school bus for the New York market through its dealer Leonard Bus Sales.
9. What pricing options are available for accessing the report?
Pricing options include single-user, multi-user, and enterprise licenses priced at USD 4750, USD 5250, and USD 8750 respectively.
10. Is the market size provided in terms of value or volume?
The market size is provided in terms of value, measured in Million.
11. Are there any specific market keywords associated with the report?
Yes, the market keyword associated with the report is "School Bus Market," which aids in identifying and referencing the specific market segment covered.
12. How do I determine which pricing option suits my needs best?
The pricing options vary based on user requirements and access needs. Individual users may opt for single-user licenses, while businesses requiring broader access may choose multi-user or enterprise licenses for cost-effective access to the report.
13. Are there any additional resources or data provided in the School Bus Market report?
While the report offers comprehensive insights, it's advisable to review the specific contents or supplementary materials provided to ascertain if additional resources or data are available.
14. How can I stay updated on further developments or reports in the School Bus Market?
To stay informed about further developments, trends, and reports in the School Bus Market, consider subscribing to industry newsletters, following relevant companies and organizations, or regularly checking reputable industry news sources and publications.
Methodology
Step 1 - Identification of Relevant Samples Size from Population Database


Step 2 - Approaches for Defining Global Market Size (Value, Volume* & Price*)

Note*: In applicable scenarios
Step 3 - Data Sources
Primary Research
- Web Analytics
- Survey Reports
- Research Institute
- Latest Research Reports
- Opinion Leaders
Secondary Research
- Annual Reports
- White Paper
- Latest Press Release
- Industry Association
- Paid Database
- Investor Presentations

Step 4 - Data Triangulation
Involves using different sources of information in order to increase the validity of a study
These sources are likely to be stakeholders in a program - participants, other researchers, program staff, other community members, and so on.
Then we put all data in single framework & apply various statistical tools to find out the dynamic on the market.
During the analysis stage, feedback from the stakeholder groups would be compared to determine areas of agreement as well as areas of divergence


