
Key Insights
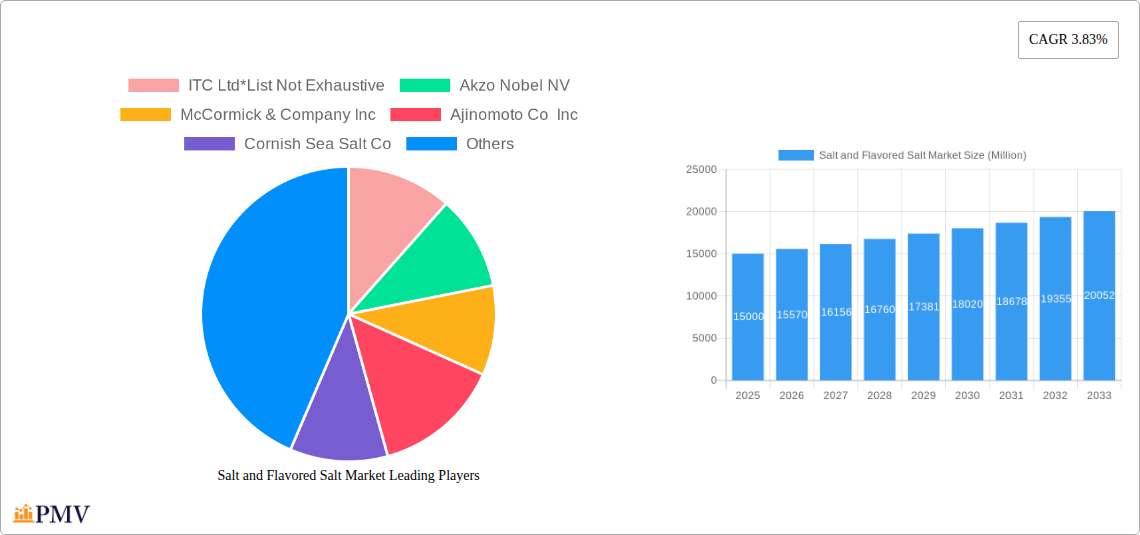
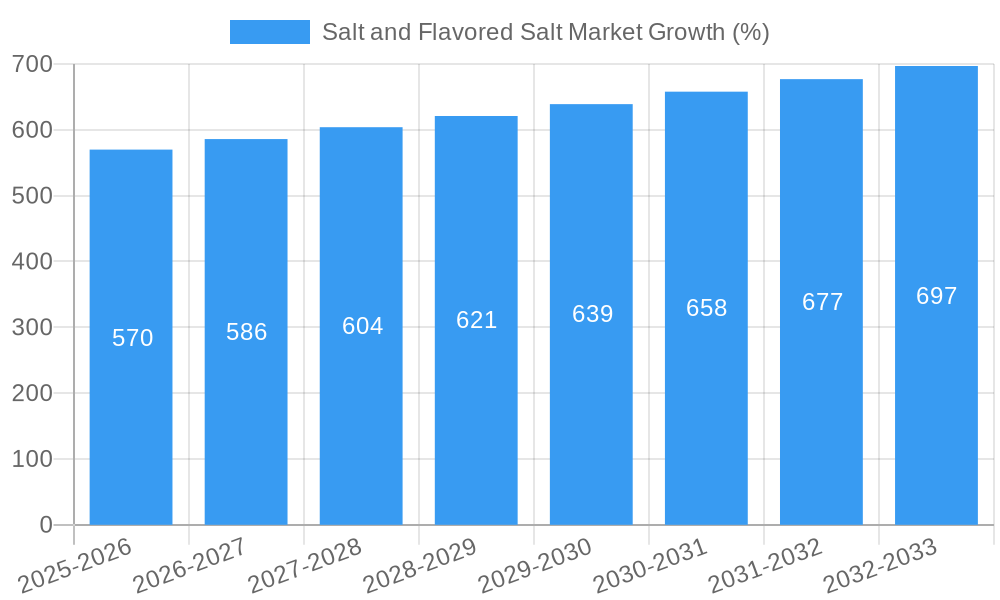
The global salt and flavored salt market is experiencing steady growth, projected to reach a substantial size over the forecast period (2025-2033). A compound annual growth rate (CAGR) of 3.83% indicates consistent expansion driven by several key factors. Increasing consumer demand for convenient and flavorful food options fuels the popularity of flavored salts, particularly in processed foods and home cooking. The growing popularity of diverse cuisines, including Asian, Mexican, and Mediterranean, contributes to the market's growth as these culinary traditions often incorporate unique salt blends. Furthermore, the health and wellness trend, while impacting some aspects of the food industry, has a neutral to positive effect on the salt market; premium and specialty salts, such as Himalayan pink salt or smoked salts, are often marketed for their perceived health benefits and unique flavor profiles. The market segmentation reveals a preference for table salt, which constitutes the largest segment, but flavored salts show a higher growth rate, indicating significant future potential. Distribution channels are diverse, with supermarkets and hypermarkets dominating, while convenience stores and online channels are exhibiting increasing significance. Leading players include established multinational corporations and specialized smaller companies focusing on artisanal or niche products. This competitive landscape leads to continuous product innovation and expands consumer choices.
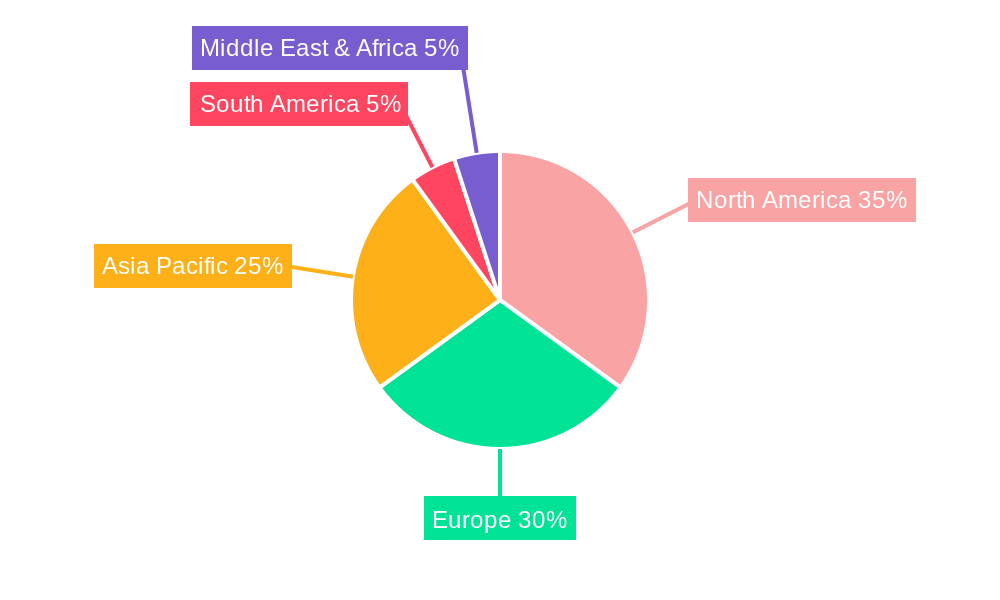
Geographic expansion plays a vital role in the overall market growth. North America and Europe currently hold significant market share, driven by established food processing industries and high per capita consumption. However, emerging markets in Asia-Pacific, particularly India and China, are rapidly gaining traction, fueled by increasing disposable incomes and evolving dietary preferences. While the market faces challenges like price fluctuations of raw materials and stringent regulatory compliance, the overall growth outlook remains positive. The market is expected to continue its steady expansion, driven by factors like growing demand, expanding product range, and increasing geographic reach, presenting promising opportunities for industry players.
Salt and Flavored Salt Market: A Comprehensive Market Analysis (2019-2033)
This comprehensive report provides an in-depth analysis of the global Salt and Flavored Salt market, offering valuable insights for businesses, investors, and industry stakeholders. The study period covers 2019-2033, with 2025 as the base and estimated year, and a forecast period of 2025-2033. The historical period analyzed is 2019-2024. The report delves into market segmentation, competitive dynamics, growth drivers, challenges, and future outlook, providing a 360-degree view of this dynamic market. Expected market value for 2025 is estimated to be xx Million.
Salt and Flavored Salt Market Structure & Competitive Dynamics
The global salt and flavored salt market exhibits a moderately concentrated structure, with several large multinational corporations and regional players vying for market share. The market's competitive landscape is characterized by intense rivalry, driven by factors such as product differentiation, pricing strategies, and brand recognition. Innovation plays a crucial role, with companies continuously developing new flavors, formulations, and packaging solutions to attract consumers. Regulatory frameworks related to food safety and labeling significantly influence market operations. Product substitutes, such as herbs and spices, pose some competition, particularly in niche segments. End-user trends, including increasing health consciousness and demand for gourmet products, are also shaping market dynamics. M&A activities have been relatively moderate in recent years, with deal values averaging xx Million. Key players such as ITC Ltd, Akzo Nobel NV, McCormick & Company Inc, and Ajinomoto Co Inc hold significant market share, while smaller, specialized companies cater to niche segments like gourmet salts.
- Market Concentration: Moderately concentrated, with a few major players and numerous smaller companies.
- Innovation Ecosystem: Active, with ongoing development of new flavors, formats, and functional attributes.
- Regulatory Framework: Significant impact, especially related to food safety, labeling, and iodization regulations.
- Product Substitutes: Limited, with herbs and spices representing the main alternative.
- End-User Trends: Increasing demand for gourmet and specialty salts, driven by changing consumer preferences.
- M&A Activity: Moderate, with deal values averaging xx Million in recent years.
Salt and Flavored Salt Market Industry Trends & Insights
The global salt and flavored salt market is experiencing robust growth, driven by several key factors. Rising disposable incomes in emerging economies, coupled with evolving consumer preferences towards convenient and flavorful food options, are fueling demand. The market's CAGR during the forecast period (2025-2033) is projected to be xx%. This growth is further propelled by increasing demand for processed and packaged foods, which rely heavily on salt as a preservative and flavor enhancer. Technological advancements in salt production and processing, including automation and improved efficiency, also contribute to market expansion. Market penetration in certain regions, particularly in developing countries, remains high, offering considerable potential for growth. However, growing health concerns surrounding high sodium intake and stringent regulations pose significant challenges to market expansion. Furthermore, competitive pressures among market players influence pricing and innovation strategies, impacting overall market dynamics. The market penetration of flavored salts is expected to witness significant growth over the forecast period, primarily driven by the rising popularity of ready-to-eat meals, changing culinary trends, and increased demand for convenience foods.
Dominant Markets & Segments in Salt and Flavored Salt Market
The North American region currently dominates the salt and flavored salt market, driven by high consumption rates and strong demand for specialty and gourmet products. Within the market segmentation, table salt remains the largest segment by volume, followed by flavored salts, which are experiencing the fastest growth rate. The supermarkets/hypermarkets distribution channel holds the largest share of the market, reflecting the widespread availability of salt products in large retail chains. However, convenience stores are also witnessing increased demand, reflecting the trend of on-the-go consumption.
- Leading Region: North America
- Dominant Segment (Type): Table Salt
- Fastest-Growing Segment (Type): Flavored Salt
- Dominant Distribution Channel: Supermarkets/Hypermarkets
Key Drivers for Dominant Regions and Segments:
- North America: High per capita consumption, strong demand for gourmet salts, well-established retail infrastructure.
- Table Salt: Essential ingredient in food processing and household consumption.
- Flavored Salt: Growing popularity of convenience foods, restaurant use, and increasing culinary sophistication.
- Supermarkets/Hypermarkets: Wide product availability, strong distribution networks.
Salt and Flavored Salt Market Product Innovations
Recent innovations in the salt and flavored salt market focus on enhanced functionality, convenience, and unique flavor profiles. This includes the introduction of salts with added minerals and vitamins, low-sodium options, specialty salts with infused herbs and spices, and innovative packaging formats. Technological advancements are driving the development of new flavor combinations and improved processing techniques for enhanced quality and consistency. These innovations aim to cater to the evolving consumer preferences for healthier, more flavorful, and convenient food options. For example, the launch of Tata Salt Immuno highlights the focus on functional benefits, while truffle-infused salts exemplify the trend towards gourmet and premium products.
Report Segmentation & Scope
This report segments the salt and flavored salt market by type and distribution channel.
By Type:
Table Salt: The largest segment, representing xx Million in 2025, projected to grow at a CAGR of xx% during the forecast period. Market competition is intense, with major players focusing on price competitiveness and brand building.
Seasoned Salt: A growing segment with a market size of xx Million in 2025 and a projected CAGR of xx%. This segment benefits from diverse flavor profiles and increasing demand for convenience.
Flavored Salt: This high-growth segment is projected to reach xx Million by 2025, driven by innovation and evolving culinary trends. Competition is relatively high, with several players focusing on unique flavor combinations.
Garlic Salt, Lime and Lemon Salt, Smoked Salt, Jalapeno Salt, Other Flavored Salts: These niche segments collectively represent a significant market opportunity, driven by increasing consumer demand for specialty flavors.
By Distribution Channel:
Supermarkets/Hypermarkets: The dominant channel, accounting for the largest market share in 2025 and expected to maintain its leading position.
Convenience Stores: A growing channel, reflecting the increasing demand for convenient food options.
Departmental Stores: A smaller but steadily growing channel, catering to consumers seeking premium and specialty products.
Other Distribution Channels: Includes online retailers, direct-to-consumer sales, and specialized food stores.
Key Drivers of Salt and Flavored Salt Market Growth
Several factors drive the growth of the salt and flavored salt market. These include the increasing demand for processed and convenience foods, rising disposable incomes in emerging economies, changing consumer preferences towards gourmet and specialty foods, and technological advancements in salt production and processing. Government regulations promoting iodization also contribute to market expansion, while the growing awareness of health and wellness is pushing the development of low-sodium and functional salt options. Furthermore, the expansion of the food service industry and the rising popularity of ethnic cuisines drive the demand for a wide variety of flavored salts.
Challenges in the Salt and Flavored Salt Market Sector
The salt and flavored salt market faces several challenges, including fluctuating raw material prices, stringent regulatory compliance regarding food safety and labeling, and increasing competition from both large multinational companies and smaller, specialized firms. Supply chain disruptions and the growing concern about the health implications of high sodium intake, along with pressure to reduce reliance on salt as a food preservative, pose additional hurdles to market growth. These factors can significantly impact production costs and profitability, requiring companies to adopt innovative strategies to mitigate these challenges.
Leading Players in the Salt and Flavored Salt Market Market
- ITC Ltd
- Akzo Nobel NV
- McCormick & Company Inc
- Ajinomoto Co Inc
- Cornish Sea Salt Co
- K+S AG
- Saltworks Inc
- United Salt Corporation
- Tata Chemicals Limited
- INFOSA
Key Developments in Salt and Flavored Salt Market Sector
- May 2021: Tanteo Tequila launched Jalapeño, Chipotle, Habanero, and Citrus flavored margarita salts.
- April 2022: Tata Salt launched Tata Salt Immuno, a zinc-fortified salt.
- November 2022: Truff launched Truff Black Truffle Salt.
Strategic Salt and Flavored Salt Market Outlook
The future of the salt and flavored salt market is promising, with substantial growth opportunities anticipated across various segments and geographies. Strategic partnerships, mergers and acquisitions, and continuous innovation in product development and distribution channels will play a crucial role in shaping market dynamics. Companies focusing on health-conscious products, unique flavor profiles, and sustainable sourcing practices are expected to gain a competitive edge. Expanding into emerging markets and leveraging e-commerce platforms will also be essential for achieving sustained growth in this dynamic market.
Salt and Flavored Salt Market Segmentation
-
1. Product Type
- 1.1. Table Salt
-
1.2. Flavored and Seasoned Salt
- 1.2.1. Truffle Salt
- 1.2.2. Garlic Salt
- 1.2.3. Lime and Lemon Salt
- 1.2.4. Smoked Salt
- 1.2.5. Jalapeno Salt
- 1.2.6. Other Flavored and Seasoned Salt
-
2. Distribution Channel
- 2.1. Supermarkets/Hypermarkets
- 2.2. Convenience/Grocery Stores
- 2.3. Online Retail Stores
- 2.4. Other Distribution Channels
Salt and Flavored Salt Market Segmentation By Geography
-
1. North America
- 1.1. United States
- 1.2. Canada
- 1.3. Mexico
- 1.4. Rest of North America
-
2. Europe
- 2.1. Germany
- 2.2. United Kingdom
- 2.3. France
- 2.4. Russia
- 2.5. Italy
- 2.6. Spain
- 2.7. Rest of Europe
-
3. Asia Pacific
- 3.1. India
- 3.2. China
- 3.3. Australia
- 3.4. Japan
- 3.5. Rest of Asia Pacific
-
4. South America
- 4.1. Brazil
- 4.2. Argentina
- 4.3. Rest of South America
- 5. Middle East
-
6. South Africa
- 6.1. Saudi Arabia
- 6.2. Rest of Middle East
Salt and Flavored Salt Market REPORT HIGHLIGHTS
| Aspects | Details |
|---|---|
| Study Period | 2019-2033 |
| Base Year | 2024 |
| Estimated Year | 2025 |
| Forecast Period | 2025-2033 |
| Historical Period | 2019-2024 |
| Growth Rate | CAGR of 3.83% from 2019-2033 |
| Segmentation |
|
Table of Contents
- 1. Introduction
- 1.1. Research Scope
- 1.2. Market Segmentation
- 1.3. Research Methodology
- 1.4. Definitions and Assumptions
- 2. Executive Summary
- 2.1. Introduction
- 3. Market Dynamics
- 3.1. Introduction
- 3.2. Market Drivers
- 3.2.1. Increasing Incidences of Food Allergies; Favorable Government Initiatives and Regulations for Food Safety
- 3.3. Market Restrains
- 3.3.1. Inconsistencies Involved in Food Allergen Declarations
- 3.4. Market Trends
- 3.4.1. Increasing Demand for Organic and Flavored Salt is Driving the Market Growth
- 4. Market Factor Analysis
- 4.1. Porters Five Forces
- 4.2. Supply/Value Chain
- 4.3. PESTEL analysis
- 4.4. Market Entropy
- 4.5. Patent/Trademark Analysis
- 5. Global Salt and Flavored Salt Market Analysis, Insights and Forecast, 2019-2031
- 5.1. Market Analysis, Insights and Forecast - by Product Type
- 5.1.1. Table Salt
- 5.1.2. Flavored and Seasoned Salt
- 5.1.2.1. Truffle Salt
- 5.1.2.2. Garlic Salt
- 5.1.2.3. Lime and Lemon Salt
- 5.1.2.4. Smoked Salt
- 5.1.2.5. Jalapeno Salt
- 5.1.2.6. Other Flavored and Seasoned Salt
- 5.2. Market Analysis, Insights and Forecast - by Distribution Channel
- 5.2.1. Supermarkets/Hypermarkets
- 5.2.2. Convenience/Grocery Stores
- 5.2.3. Online Retail Stores
- 5.2.4. Other Distribution Channels
- 5.3. Market Analysis, Insights and Forecast - by Region
- 5.3.1. North America
- 5.3.2. Europe
- 5.3.3. Asia Pacific
- 5.3.4. South America
- 5.3.5. Middle East
- 5.3.6. South Africa
- 5.1. Market Analysis, Insights and Forecast - by Product Type
- 6. North America Salt and Flavored Salt Market Analysis, Insights and Forecast, 2019-2031
- 6.1. Market Analysis, Insights and Forecast - by Product Type
- 6.1.1. Table Salt
- 6.1.2. Flavored and Seasoned Salt
- 6.1.2.1. Truffle Salt
- 6.1.2.2. Garlic Salt
- 6.1.2.3. Lime and Lemon Salt
- 6.1.2.4. Smoked Salt
- 6.1.2.5. Jalapeno Salt
- 6.1.2.6. Other Flavored and Seasoned Salt
- 6.2. Market Analysis, Insights and Forecast - by Distribution Channel
- 6.2.1. Supermarkets/Hypermarkets
- 6.2.2. Convenience/Grocery Stores
- 6.2.3. Online Retail Stores
- 6.2.4. Other Distribution Channels
- 6.1. Market Analysis, Insights and Forecast - by Product Type
- 7. Europe Salt and Flavored Salt Market Analysis, Insights and Forecast, 2019-2031
- 7.1. Market Analysis, Insights and Forecast - by Product Type
- 7.1.1. Table Salt
- 7.1.2. Flavored and Seasoned Salt
- 7.1.2.1. Truffle Salt
- 7.1.2.2. Garlic Salt
- 7.1.2.3. Lime and Lemon Salt
- 7.1.2.4. Smoked Salt
- 7.1.2.5. Jalapeno Salt
- 7.1.2.6. Other Flavored and Seasoned Salt
- 7.2. Market Analysis, Insights and Forecast - by Distribution Channel
- 7.2.1. Supermarkets/Hypermarkets
- 7.2.2. Convenience/Grocery Stores
- 7.2.3. Online Retail Stores
- 7.2.4. Other Distribution Channels
- 7.1. Market Analysis, Insights and Forecast - by Product Type
- 8. Asia Pacific Salt and Flavored Salt Market Analysis, Insights and Forecast, 2019-2031
- 8.1. Market Analysis, Insights and Forecast - by Product Type
- 8.1.1. Table Salt
- 8.1.2. Flavored and Seasoned Salt
- 8.1.2.1. Truffle Salt
- 8.1.2.2. Garlic Salt
- 8.1.2.3. Lime and Lemon Salt
- 8.1.2.4. Smoked Salt
- 8.1.2.5. Jalapeno Salt
- 8.1.2.6. Other Flavored and Seasoned Salt
- 8.2. Market Analysis, Insights and Forecast - by Distribution Channel
- 8.2.1. Supermarkets/Hypermarkets
- 8.2.2. Convenience/Grocery Stores
- 8.2.3. Online Retail Stores
- 8.2.4. Other Distribution Channels
- 8.1. Market Analysis, Insights and Forecast - by Product Type
- 9. South America Salt and Flavored Salt Market Analysis, Insights and Forecast, 2019-2031
- 9.1. Market Analysis, Insights and Forecast - by Product Type
- 9.1.1. Table Salt
- 9.1.2. Flavored and Seasoned Salt
- 9.1.2.1. Truffle Salt
- 9.1.2.2. Garlic Salt
- 9.1.2.3. Lime and Lemon Salt
- 9.1.2.4. Smoked Salt
- 9.1.2.5. Jalapeno Salt
- 9.1.2.6. Other Flavored and Seasoned Salt
- 9.2. Market Analysis, Insights and Forecast - by Distribution Channel
- 9.2.1. Supermarkets/Hypermarkets
- 9.2.2. Convenience/Grocery Stores
- 9.2.3. Online Retail Stores
- 9.2.4. Other Distribution Channels
- 9.1. Market Analysis, Insights and Forecast - by Product Type
- 10. Middle East Salt and Flavored Salt Market Analysis, Insights and Forecast, 2019-2031
- 10.1. Market Analysis, Insights and Forecast - by Product Type
- 10.1.1. Table Salt
- 10.1.2. Flavored and Seasoned Salt
- 10.1.2.1. Truffle Salt
- 10.1.2.2. Garlic Salt
- 10.1.2.3. Lime and Lemon Salt
- 10.1.2.4. Smoked Salt
- 10.1.2.5. Jalapeno Salt
- 10.1.2.6. Other Flavored and Seasoned Salt
- 10.2. Market Analysis, Insights and Forecast - by Distribution Channel
- 10.2.1. Supermarkets/Hypermarkets
- 10.2.2. Convenience/Grocery Stores
- 10.2.3. Online Retail Stores
- 10.2.4. Other Distribution Channels
- 10.1. Market Analysis, Insights and Forecast - by Product Type
- 11. South Africa Salt and Flavored Salt Market Analysis, Insights and Forecast, 2019-2031
- 11.1. Market Analysis, Insights and Forecast - by Product Type
- 11.1.1. Table Salt
- 11.1.2. Flavored and Seasoned Salt
- 11.1.2.1. Truffle Salt
- 11.1.2.2. Garlic Salt
- 11.1.2.3. Lime and Lemon Salt
- 11.1.2.4. Smoked Salt
- 11.1.2.5. Jalapeno Salt
- 11.1.2.6. Other Flavored and Seasoned Salt
- 11.2. Market Analysis, Insights and Forecast - by Distribution Channel
- 11.2.1. Supermarkets/Hypermarkets
- 11.2.2. Convenience/Grocery Stores
- 11.2.3. Online Retail Stores
- 11.2.4. Other Distribution Channels
- 11.1. Market Analysis, Insights and Forecast - by Product Type
- 12. North America Salt and Flavored Salt Market Analysis, Insights and Forecast, 2019-2031
- 12.1. Market Analysis, Insights and Forecast - By Country/Sub-region
- 12.1.1 United States
- 12.1.2 Canada
- 12.1.3 Mexico
- 12.1.4 Rest of North America
- 13. Europe Salt and Flavored Salt Market Analysis, Insights and Forecast, 2019-2031
- 13.1. Market Analysis, Insights and Forecast - By Country/Sub-region
- 13.1.1 Germany
- 13.1.2 United Kingdom
- 13.1.3 France
- 13.1.4 Russia
- 13.1.5 Italy
- 13.1.6 Spain
- 13.1.7 Rest of Europe
- 14. Asia Pacific Salt and Flavored Salt Market Analysis, Insights and Forecast, 2019-2031
- 14.1. Market Analysis, Insights and Forecast - By Country/Sub-region
- 14.1.1 India
- 14.1.2 China
- 14.1.3 Australia
- 14.1.4 Japan
- 14.1.5 Rest of Asia Pacific
- 15. South America Salt and Flavored Salt Market Analysis, Insights and Forecast, 2019-2031
- 15.1. Market Analysis, Insights and Forecast - By Country/Sub-region
- 15.1.1 Brazil
- 15.1.2 Argentina
- 15.1.3 Rest of South America
- 16. Middle East & Africa Salt and Flavored Salt Market Analysis, Insights and Forecast, 2019-2031
- 16.1. Market Analysis, Insights and Forecast - By Country/Sub-region
- 16.1.1 UAE
- 16.1.2 South Africa
- 16.1.3 Saudi Arabia
- 16.1.4 Rest of MEA
- 17. Competitive Analysis
- 17.1. Global Market Share Analysis 2024
- 17.2. Company Profiles
- 17.2.1 ITC Ltd*List Not Exhaustive
- 17.2.1.1. Overview
- 17.2.1.2. Products
- 17.2.1.3. SWOT Analysis
- 17.2.1.4. Recent Developments
- 17.2.1.5. Financials (Based on Availability)
- 17.2.2 Akzo Nobel NV
- 17.2.2.1. Overview
- 17.2.2.2. Products
- 17.2.2.3. SWOT Analysis
- 17.2.2.4. Recent Developments
- 17.2.2.5. Financials (Based on Availability)
- 17.2.3 McCormick & Company Inc
- 17.2.3.1. Overview
- 17.2.3.2. Products
- 17.2.3.3. SWOT Analysis
- 17.2.3.4. Recent Developments
- 17.2.3.5. Financials (Based on Availability)
- 17.2.4 Ajinomoto Co Inc
- 17.2.4.1. Overview
- 17.2.4.2. Products
- 17.2.4.3. SWOT Analysis
- 17.2.4.4. Recent Developments
- 17.2.4.5. Financials (Based on Availability)
- 17.2.5 Cornish Sea Salt Co
- 17.2.5.1. Overview
- 17.2.5.2. Products
- 17.2.5.3. SWOT Analysis
- 17.2.5.4. Recent Developments
- 17.2.5.5. Financials (Based on Availability)
- 17.2.6 K+S AG
- 17.2.6.1. Overview
- 17.2.6.2. Products
- 17.2.6.3. SWOT Analysis
- 17.2.6.4. Recent Developments
- 17.2.6.5. Financials (Based on Availability)
- 17.2.7 Saltworks Inc
- 17.2.7.1. Overview
- 17.2.7.2. Products
- 17.2.7.3. SWOT Analysis
- 17.2.7.4. Recent Developments
- 17.2.7.5. Financials (Based on Availability)
- 17.2.8 United Salt Corporation
- 17.2.8.1. Overview
- 17.2.8.2. Products
- 17.2.8.3. SWOT Analysis
- 17.2.8.4. Recent Developments
- 17.2.8.5. Financials (Based on Availability)
- 17.2.9 Tata Chemicals Limited
- 17.2.9.1. Overview
- 17.2.9.2. Products
- 17.2.9.3. SWOT Analysis
- 17.2.9.4. Recent Developments
- 17.2.9.5. Financials (Based on Availability)
- 17.2.10 INFOSA
- 17.2.10.1. Overview
- 17.2.10.2. Products
- 17.2.10.3. SWOT Analysis
- 17.2.10.4. Recent Developments
- 17.2.10.5. Financials (Based on Availability)
- 17.2.1 ITC Ltd*List Not Exhaustive
List of Figures
- Figure 1: Global Salt and Flavored Salt Market Revenue Breakdown (Million, %) by Region 2024 & 2032
- Figure 2: Global Salt and Flavored Salt Market Volume Breakdown (K Tons, %) by Region 2024 & 2032
- Figure 3: North America Salt and Flavored Salt Market Revenue (Million), by Country 2024 & 2032
- Figure 4: North America Salt and Flavored Salt Market Volume (K Tons), by Country 2024 & 2032
- Figure 5: North America Salt and Flavored Salt Market Revenue Share (%), by Country 2024 & 2032
- Figure 6: North America Salt and Flavored Salt Market Volume Share (%), by Country 2024 & 2032
- Figure 7: Europe Salt and Flavored Salt Market Revenue (Million), by Country 2024 & 2032
- Figure 8: Europe Salt and Flavored Salt Market Volume (K Tons), by Country 2024 & 2032
- Figure 9: Europe Salt and Flavored Salt Market Revenue Share (%), by Country 2024 & 2032
- Figure 10: Europe Salt and Flavored Salt Market Volume Share (%), by Country 2024 & 2032
- Figure 11: Asia Pacific Salt and Flavored Salt Market Revenue (Million), by Country 2024 & 2032
- Figure 12: Asia Pacific Salt and Flavored Salt Market Volume (K Tons), by Country 2024 & 2032
- Figure 13: Asia Pacific Salt and Flavored Salt Market Revenue Share (%), by Country 2024 & 2032
- Figure 14: Asia Pacific Salt and Flavored Salt Market Volume Share (%), by Country 2024 & 2032
- Figure 15: South America Salt and Flavored Salt Market Revenue (Million), by Country 2024 & 2032
- Figure 16: South America Salt and Flavored Salt Market Volume (K Tons), by Country 2024 & 2032
- Figure 17: South America Salt and Flavored Salt Market Revenue Share (%), by Country 2024 & 2032
- Figure 18: South America Salt and Flavored Salt Market Volume Share (%), by Country 2024 & 2032
- Figure 19: Middle East & Africa Salt and Flavored Salt Market Revenue (Million), by Country 2024 & 2032
- Figure 20: Middle East & Africa Salt and Flavored Salt Market Volume (K Tons), by Country 2024 & 2032
- Figure 21: Middle East & Africa Salt and Flavored Salt Market Revenue Share (%), by Country 2024 & 2032
- Figure 22: Middle East & Africa Salt and Flavored Salt Market Volume Share (%), by Country 2024 & 2032
- Figure 23: North America Salt and Flavored Salt Market Revenue (Million), by Product Type 2024 & 2032
- Figure 24: North America Salt and Flavored Salt Market Volume (K Tons), by Product Type 2024 & 2032
- Figure 25: North America Salt and Flavored Salt Market Revenue Share (%), by Product Type 2024 & 2032
- Figure 26: North America Salt and Flavored Salt Market Volume Share (%), by Product Type 2024 & 2032
- Figure 27: North America Salt and Flavored Salt Market Revenue (Million), by Distribution Channel 2024 & 2032
- Figure 28: North America Salt and Flavored Salt Market Volume (K Tons), by Distribution Channel 2024 & 2032
- Figure 29: North America Salt and Flavored Salt Market Revenue Share (%), by Distribution Channel 2024 & 2032
- Figure 30: North America Salt and Flavored Salt Market Volume Share (%), by Distribution Channel 2024 & 2032
- Figure 31: North America Salt and Flavored Salt Market Revenue (Million), by Country 2024 & 2032
- Figure 32: North America Salt and Flavored Salt Market Volume (K Tons), by Country 2024 & 2032
- Figure 33: North America Salt and Flavored Salt Market Revenue Share (%), by Country 2024 & 2032
- Figure 34: North America Salt and Flavored Salt Market Volume Share (%), by Country 2024 & 2032
- Figure 35: Europe Salt and Flavored Salt Market Revenue (Million), by Product Type 2024 & 2032
- Figure 36: Europe Salt and Flavored Salt Market Volume (K Tons), by Product Type 2024 & 2032
- Figure 37: Europe Salt and Flavored Salt Market Revenue Share (%), by Product Type 2024 & 2032
- Figure 38: Europe Salt and Flavored Salt Market Volume Share (%), by Product Type 2024 & 2032
- Figure 39: Europe Salt and Flavored Salt Market Revenue (Million), by Distribution Channel 2024 & 2032
- Figure 40: Europe Salt and Flavored Salt Market Volume (K Tons), by Distribution Channel 2024 & 2032
- Figure 41: Europe Salt and Flavored Salt Market Revenue Share (%), by Distribution Channel 2024 & 2032
- Figure 42: Europe Salt and Flavored Salt Market Volume Share (%), by Distribution Channel 2024 & 2032
- Figure 43: Europe Salt and Flavored Salt Market Revenue (Million), by Country 2024 & 2032
- Figure 44: Europe Salt and Flavored Salt Market Volume (K Tons), by Country 2024 & 2032
- Figure 45: Europe Salt and Flavored Salt Market Revenue Share (%), by Country 2024 & 2032
- Figure 46: Europe Salt and Flavored Salt Market Volume Share (%), by Country 2024 & 2032
- Figure 47: Asia Pacific Salt and Flavored Salt Market Revenue (Million), by Product Type 2024 & 2032
- Figure 48: Asia Pacific Salt and Flavored Salt Market Volume (K Tons), by Product Type 2024 & 2032
- Figure 49: Asia Pacific Salt and Flavored Salt Market Revenue Share (%), by Product Type 2024 & 2032
- Figure 50: Asia Pacific Salt and Flavored Salt Market Volume Share (%), by Product Type 2024 & 2032
- Figure 51: Asia Pacific Salt and Flavored Salt Market Revenue (Million), by Distribution Channel 2024 & 2032
- Figure 52: Asia Pacific Salt and Flavored Salt Market Volume (K Tons), by Distribution Channel 2024 & 2032
- Figure 53: Asia Pacific Salt and Flavored Salt Market Revenue Share (%), by Distribution Channel 2024 & 2032
- Figure 54: Asia Pacific Salt and Flavored Salt Market Volume Share (%), by Distribution Channel 2024 & 2032
- Figure 55: Asia Pacific Salt and Flavored Salt Market Revenue (Million), by Country 2024 & 2032
- Figure 56: Asia Pacific Salt and Flavored Salt Market Volume (K Tons), by Country 2024 & 2032
- Figure 57: Asia Pacific Salt and Flavored Salt Market Revenue Share (%), by Country 2024 & 2032
- Figure 58: Asia Pacific Salt and Flavored Salt Market Volume Share (%), by Country 2024 & 2032
- Figure 59: South America Salt and Flavored Salt Market Revenue (Million), by Product Type 2024 & 2032
- Figure 60: South America Salt and Flavored Salt Market Volume (K Tons), by Product Type 2024 & 2032
- Figure 61: South America Salt and Flavored Salt Market Revenue Share (%), by Product Type 2024 & 2032
- Figure 62: South America Salt and Flavored Salt Market Volume Share (%), by Product Type 2024 & 2032
- Figure 63: South America Salt and Flavored Salt Market Revenue (Million), by Distribution Channel 2024 & 2032
- Figure 64: South America Salt and Flavored Salt Market Volume (K Tons), by Distribution Channel 2024 & 2032
- Figure 65: South America Salt and Flavored Salt Market Revenue Share (%), by Distribution Channel 2024 & 2032
- Figure 66: South America Salt and Flavored Salt Market Volume Share (%), by Distribution Channel 2024 & 2032
- Figure 67: South America Salt and Flavored Salt Market Revenue (Million), by Country 2024 & 2032
- Figure 68: South America Salt and Flavored Salt Market Volume (K Tons), by Country 2024 & 2032
- Figure 69: South America Salt and Flavored Salt Market Revenue Share (%), by Country 2024 & 2032
- Figure 70: South America Salt and Flavored Salt Market Volume Share (%), by Country 2024 & 2032
- Figure 71: Middle East Salt and Flavored Salt Market Revenue (Million), by Product Type 2024 & 2032
- Figure 72: Middle East Salt and Flavored Salt Market Volume (K Tons), by Product Type 2024 & 2032
- Figure 73: Middle East Salt and Flavored Salt Market Revenue Share (%), by Product Type 2024 & 2032
- Figure 74: Middle East Salt and Flavored Salt Market Volume Share (%), by Product Type 2024 & 2032
- Figure 75: Middle East Salt and Flavored Salt Market Revenue (Million), by Distribution Channel 2024 & 2032
- Figure 76: Middle East Salt and Flavored Salt Market Volume (K Tons), by Distribution Channel 2024 & 2032
- Figure 77: Middle East Salt and Flavored Salt Market Revenue Share (%), by Distribution Channel 2024 & 2032
- Figure 78: Middle East Salt and Flavored Salt Market Volume Share (%), by Distribution Channel 2024 & 2032
- Figure 79: Middle East Salt and Flavored Salt Market Revenue (Million), by Country 2024 & 2032
- Figure 80: Middle East Salt and Flavored Salt Market Volume (K Tons), by Country 2024 & 2032
- Figure 81: Middle East Salt and Flavored Salt Market Revenue Share (%), by Country 2024 & 2032
- Figure 82: Middle East Salt and Flavored Salt Market Volume Share (%), by Country 2024 & 2032
- Figure 83: South Africa Salt and Flavored Salt Market Revenue (Million), by Product Type 2024 & 2032
- Figure 84: South Africa Salt and Flavored Salt Market Volume (K Tons), by Product Type 2024 & 2032
- Figure 85: South Africa Salt and Flavored Salt Market Revenue Share (%), by Product Type 2024 & 2032
- Figure 86: South Africa Salt and Flavored Salt Market Volume Share (%), by Product Type 2024 & 2032
- Figure 87: South Africa Salt and Flavored Salt Market Revenue (Million), by Distribution Channel 2024 & 2032
- Figure 88: South Africa Salt and Flavored Salt Market Volume (K Tons), by Distribution Channel 2024 & 2032
- Figure 89: South Africa Salt and Flavored Salt Market Revenue Share (%), by Distribution Channel 2024 & 2032
- Figure 90: South Africa Salt and Flavored Salt Market Volume Share (%), by Distribution Channel 2024 & 2032
- Figure 91: South Africa Salt and Flavored Salt Market Revenue (Million), by Country 2024 & 2032
- Figure 92: South Africa Salt and Flavored Salt Market Volume (K Tons), by Country 2024 & 2032
- Figure 93: South Africa Salt and Flavored Salt Market Revenue Share (%), by Country 2024 & 2032
- Figure 94: South Africa Salt and Flavored Salt Market Volume Share (%), by Country 2024 & 2032
List of Tables
- Table 1: Global Salt and Flavored Salt Market Revenue Million Forecast, by Region 2019 & 2032
- Table 2: Global Salt and Flavored Salt Market Volume K Tons Forecast, by Region 2019 & 2032
- Table 3: Global Salt and Flavored Salt Market Revenue Million Forecast, by Product Type 2019 & 2032
- Table 4: Global Salt and Flavored Salt Market Volume K Tons Forecast, by Product Type 2019 & 2032
- Table 5: Global Salt and Flavored Salt Market Revenue Million Forecast, by Distribution Channel 2019 & 2032
- Table 6: Global Salt and Flavored Salt Market Volume K Tons Forecast, by Distribution Channel 2019 & 2032
- Table 7: Global Salt and Flavored Salt Market Revenue Million Forecast, by Region 2019 & 2032
- Table 8: Global Salt and Flavored Salt Market Volume K Tons Forecast, by Region 2019 & 2032
- Table 9: Global Salt and Flavored Salt Market Revenue Million Forecast, by Country 2019 & 2032
- Table 10: Global Salt and Flavored Salt Market Volume K Tons Forecast, by Country 2019 & 2032
- Table 11: United States Salt and Flavored Salt Market Revenue (Million) Forecast, by Application 2019 & 2032
- Table 12: United States Salt and Flavored Salt Market Volume (K Tons) Forecast, by Application 2019 & 2032
- Table 13: Canada Salt and Flavored Salt Market Revenue (Million) Forecast, by Application 2019 & 2032
- Table 14: Canada Salt and Flavored Salt Market Volume (K Tons) Forecast, by Application 2019 & 2032
- Table 15: Mexico Salt and Flavored Salt Market Revenue (Million) Forecast, by Application 2019 & 2032
- Table 16: Mexico Salt and Flavored Salt Market Volume (K Tons) Forecast, by Application 2019 & 2032
- Table 17: Rest of North America Salt and Flavored Salt Market Revenue (Million) Forecast, by Application 2019 & 2032
- Table 18: Rest of North America Salt and Flavored Salt Market Volume (K Tons) Forecast, by Application 2019 & 2032
- Table 19: Global Salt and Flavored Salt Market Revenue Million Forecast, by Country 2019 & 2032
- Table 20: Global Salt and Flavored Salt Market Volume K Tons Forecast, by Country 2019 & 2032
- Table 21: Germany Salt and Flavored Salt Market Revenue (Million) Forecast, by Application 2019 & 2032
- Table 22: Germany Salt and Flavored Salt Market Volume (K Tons) Forecast, by Application 2019 & 2032
- Table 23: United Kingdom Salt and Flavored Salt Market Revenue (Million) Forecast, by Application 2019 & 2032
- Table 24: United Kingdom Salt and Flavored Salt Market Volume (K Tons) Forecast, by Application 2019 & 2032
- Table 25: France Salt and Flavored Salt Market Revenue (Million) Forecast, by Application 2019 & 2032
- Table 26: France Salt and Flavored Salt Market Volume (K Tons) Forecast, by Application 2019 & 2032
- Table 27: Russia Salt and Flavored Salt Market Revenue (Million) Forecast, by Application 2019 & 2032
- Table 28: Russia Salt and Flavored Salt Market Volume (K Tons) Forecast, by Application 2019 & 2032
- Table 29: Italy Salt and Flavored Salt Market Revenue (Million) Forecast, by Application 2019 & 2032
- Table 30: Italy Salt and Flavored Salt Market Volume (K Tons) Forecast, by Application 2019 & 2032
- Table 31: Spain Salt and Flavored Salt Market Revenue (Million) Forecast, by Application 2019 & 2032
- Table 32: Spain Salt and Flavored Salt Market Volume (K Tons) Forecast, by Application 2019 & 2032
- Table 33: Rest of Europe Salt and Flavored Salt Market Revenue (Million) Forecast, by Application 2019 & 2032
- Table 34: Rest of Europe Salt and Flavored Salt Market Volume (K Tons) Forecast, by Application 2019 & 2032
- Table 35: Global Salt and Flavored Salt Market Revenue Million Forecast, by Country 2019 & 2032
- Table 36: Global Salt and Flavored Salt Market Volume K Tons Forecast, by Country 2019 & 2032
- Table 37: India Salt and Flavored Salt Market Revenue (Million) Forecast, by Application 2019 & 2032
- Table 38: India Salt and Flavored Salt Market Volume (K Tons) Forecast, by Application 2019 & 2032
- Table 39: China Salt and Flavored Salt Market Revenue (Million) Forecast, by Application 2019 & 2032
- Table 40: China Salt and Flavored Salt Market Volume (K Tons) Forecast, by Application 2019 & 2032
- Table 41: Australia Salt and Flavored Salt Market Revenue (Million) Forecast, by Application 2019 & 2032
- Table 42: Australia Salt and Flavored Salt Market Volume (K Tons) Forecast, by Application 2019 & 2032
- Table 43: Japan Salt and Flavored Salt Market Revenue (Million) Forecast, by Application 2019 & 2032
- Table 44: Japan Salt and Flavored Salt Market Volume (K Tons) Forecast, by Application 2019 & 2032
- Table 45: Rest of Asia Pacific Salt and Flavored Salt Market Revenue (Million) Forecast, by Application 2019 & 2032
- Table 46: Rest of Asia Pacific Salt and Flavored Salt Market Volume (K Tons) Forecast, by Application 2019 & 2032
- Table 47: Global Salt and Flavored Salt Market Revenue Million Forecast, by Country 2019 & 2032
- Table 48: Global Salt and Flavored Salt Market Volume K Tons Forecast, by Country 2019 & 2032
- Table 49: Brazil Salt and Flavored Salt Market Revenue (Million) Forecast, by Application 2019 & 2032
- Table 50: Brazil Salt and Flavored Salt Market Volume (K Tons) Forecast, by Application 2019 & 2032
- Table 51: Argentina Salt and Flavored Salt Market Revenue (Million) Forecast, by Application 2019 & 2032
- Table 52: Argentina Salt and Flavored Salt Market Volume (K Tons) Forecast, by Application 2019 & 2032
- Table 53: Rest of South America Salt and Flavored Salt Market Revenue (Million) Forecast, by Application 2019 & 2032
- Table 54: Rest of South America Salt and Flavored Salt Market Volume (K Tons) Forecast, by Application 2019 & 2032
- Table 55: Global Salt and Flavored Salt Market Revenue Million Forecast, by Country 2019 & 2032
- Table 56: Global Salt and Flavored Salt Market Volume K Tons Forecast, by Country 2019 & 2032
- Table 57: UAE Salt and Flavored Salt Market Revenue (Million) Forecast, by Application 2019 & 2032
- Table 58: UAE Salt and Flavored Salt Market Volume (K Tons) Forecast, by Application 2019 & 2032
- Table 59: South Africa Salt and Flavored Salt Market Revenue (Million) Forecast, by Application 2019 & 2032
- Table 60: South Africa Salt and Flavored Salt Market Volume (K Tons) Forecast, by Application 2019 & 2032
- Table 61: Saudi Arabia Salt and Flavored Salt Market Revenue (Million) Forecast, by Application 2019 & 2032
- Table 62: Saudi Arabia Salt and Flavored Salt Market Volume (K Tons) Forecast, by Application 2019 & 2032
- Table 63: Rest of MEA Salt and Flavored Salt Market Revenue (Million) Forecast, by Application 2019 & 2032
- Table 64: Rest of MEA Salt and Flavored Salt Market Volume (K Tons) Forecast, by Application 2019 & 2032
- Table 65: Global Salt and Flavored Salt Market Revenue Million Forecast, by Product Type 2019 & 2032
- Table 66: Global Salt and Flavored Salt Market Volume K Tons Forecast, by Product Type 2019 & 2032
- Table 67: Global Salt and Flavored Salt Market Revenue Million Forecast, by Distribution Channel 2019 & 2032
- Table 68: Global Salt and Flavored Salt Market Volume K Tons Forecast, by Distribution Channel 2019 & 2032
- Table 69: Global Salt and Flavored Salt Market Revenue Million Forecast, by Country 2019 & 2032
- Table 70: Global Salt and Flavored Salt Market Volume K Tons Forecast, by Country 2019 & 2032
- Table 71: United States Salt and Flavored Salt Market Revenue (Million) Forecast, by Application 2019 & 2032
- Table 72: United States Salt and Flavored Salt Market Volume (K Tons) Forecast, by Application 2019 & 2032
- Table 73: Canada Salt and Flavored Salt Market Revenue (Million) Forecast, by Application 2019 & 2032
- Table 74: Canada Salt and Flavored Salt Market Volume (K Tons) Forecast, by Application 2019 & 2032
- Table 75: Mexico Salt and Flavored Salt Market Revenue (Million) Forecast, by Application 2019 & 2032
- Table 76: Mexico Salt and Flavored Salt Market Volume (K Tons) Forecast, by Application 2019 & 2032
- Table 77: Rest of North America Salt and Flavored Salt Market Revenue (Million) Forecast, by Application 2019 & 2032
- Table 78: Rest of North America Salt and Flavored Salt Market Volume (K Tons) Forecast, by Application 2019 & 2032
- Table 79: Global Salt and Flavored Salt Market Revenue Million Forecast, by Product Type 2019 & 2032
- Table 80: Global Salt and Flavored Salt Market Volume K Tons Forecast, by Product Type 2019 & 2032
- Table 81: Global Salt and Flavored Salt Market Revenue Million Forecast, by Distribution Channel 2019 & 2032
- Table 82: Global Salt and Flavored Salt Market Volume K Tons Forecast, by Distribution Channel 2019 & 2032
- Table 83: Global Salt and Flavored Salt Market Revenue Million Forecast, by Country 2019 & 2032
- Table 84: Global Salt and Flavored Salt Market Volume K Tons Forecast, by Country 2019 & 2032
- Table 85: Germany Salt and Flavored Salt Market Revenue (Million) Forecast, by Application 2019 & 2032
- Table 86: Germany Salt and Flavored Salt Market Volume (K Tons) Forecast, by Application 2019 & 2032
- Table 87: United Kingdom Salt and Flavored Salt Market Revenue (Million) Forecast, by Application 2019 & 2032
- Table 88: United Kingdom Salt and Flavored Salt Market Volume (K Tons) Forecast, by Application 2019 & 2032
- Table 89: France Salt and Flavored Salt Market Revenue (Million) Forecast, by Application 2019 & 2032
- Table 90: France Salt and Flavored Salt Market Volume (K Tons) Forecast, by Application 2019 & 2032
- Table 91: Russia Salt and Flavored Salt Market Revenue (Million) Forecast, by Application 2019 & 2032
- Table 92: Russia Salt and Flavored Salt Market Volume (K Tons) Forecast, by Application 2019 & 2032
- Table 93: Italy Salt and Flavored Salt Market Revenue (Million) Forecast, by Application 2019 & 2032
- Table 94: Italy Salt and Flavored Salt Market Volume (K Tons) Forecast, by Application 2019 & 2032
- Table 95: Spain Salt and Flavored Salt Market Revenue (Million) Forecast, by Application 2019 & 2032
- Table 96: Spain Salt and Flavored Salt Market Volume (K Tons) Forecast, by Application 2019 & 2032
- Table 97: Rest of Europe Salt and Flavored Salt Market Revenue (Million) Forecast, by Application 2019 & 2032
- Table 98: Rest of Europe Salt and Flavored Salt Market Volume (K Tons) Forecast, by Application 2019 & 2032
- Table 99: Global Salt and Flavored Salt Market Revenue Million Forecast, by Product Type 2019 & 2032
- Table 100: Global Salt and Flavored Salt Market Volume K Tons Forecast, by Product Type 2019 & 2032
- Table 101: Global Salt and Flavored Salt Market Revenue Million Forecast, by Distribution Channel 2019 & 2032
- Table 102: Global Salt and Flavored Salt Market Volume K Tons Forecast, by Distribution Channel 2019 & 2032
- Table 103: Global Salt and Flavored Salt Market Revenue Million Forecast, by Country 2019 & 2032
- Table 104: Global Salt and Flavored Salt Market Volume K Tons Forecast, by Country 2019 & 2032
- Table 105: India Salt and Flavored Salt Market Revenue (Million) Forecast, by Application 2019 & 2032
- Table 106: India Salt and Flavored Salt Market Volume (K Tons) Forecast, by Application 2019 & 2032
- Table 107: China Salt and Flavored Salt Market Revenue (Million) Forecast, by Application 2019 & 2032
- Table 108: China Salt and Flavored Salt Market Volume (K Tons) Forecast, by Application 2019 & 2032
- Table 109: Australia Salt and Flavored Salt Market Revenue (Million) Forecast, by Application 2019 & 2032
- Table 110: Australia Salt and Flavored Salt Market Volume (K Tons) Forecast, by Application 2019 & 2032
- Table 111: Japan Salt and Flavored Salt Market Revenue (Million) Forecast, by Application 2019 & 2032
- Table 112: Japan Salt and Flavored Salt Market Volume (K Tons) Forecast, by Application 2019 & 2032
- Table 113: Rest of Asia Pacific Salt and Flavored Salt Market Revenue (Million) Forecast, by Application 2019 & 2032
- Table 114: Rest of Asia Pacific Salt and Flavored Salt Market Volume (K Tons) Forecast, by Application 2019 & 2032
- Table 115: Global Salt and Flavored Salt Market Revenue Million Forecast, by Product Type 2019 & 2032
- Table 116: Global Salt and Flavored Salt Market Volume K Tons Forecast, by Product Type 2019 & 2032
- Table 117: Global Salt and Flavored Salt Market Revenue Million Forecast, by Distribution Channel 2019 & 2032
- Table 118: Global Salt and Flavored Salt Market Volume K Tons Forecast, by Distribution Channel 2019 & 2032
- Table 119: Global Salt and Flavored Salt Market Revenue Million Forecast, by Country 2019 & 2032
- Table 120: Global Salt and Flavored Salt Market Volume K Tons Forecast, by Country 2019 & 2032
- Table 121: Brazil Salt and Flavored Salt Market Revenue (Million) Forecast, by Application 2019 & 2032
- Table 122: Brazil Salt and Flavored Salt Market Volume (K Tons) Forecast, by Application 2019 & 2032
- Table 123: Argentina Salt and Flavored Salt Market Revenue (Million) Forecast, by Application 2019 & 2032
- Table 124: Argentina Salt and Flavored Salt Market Volume (K Tons) Forecast, by Application 2019 & 2032
- Table 125: Rest of South America Salt and Flavored Salt Market Revenue (Million) Forecast, by Application 2019 & 2032
- Table 126: Rest of South America Salt and Flavored Salt Market Volume (K Tons) Forecast, by Application 2019 & 2032
- Table 127: Global Salt and Flavored Salt Market Revenue Million Forecast, by Product Type 2019 & 2032
- Table 128: Global Salt and Flavored Salt Market Volume K Tons Forecast, by Product Type 2019 & 2032
- Table 129: Global Salt and Flavored Salt Market Revenue Million Forecast, by Distribution Channel 2019 & 2032
- Table 130: Global Salt and Flavored Salt Market Volume K Tons Forecast, by Distribution Channel 2019 & 2032
- Table 131: Global Salt and Flavored Salt Market Revenue Million Forecast, by Country 2019 & 2032
- Table 132: Global Salt and Flavored Salt Market Volume K Tons Forecast, by Country 2019 & 2032
- Table 133: Global Salt and Flavored Salt Market Revenue Million Forecast, by Product Type 2019 & 2032
- Table 134: Global Salt and Flavored Salt Market Volume K Tons Forecast, by Product Type 2019 & 2032
- Table 135: Global Salt and Flavored Salt Market Revenue Million Forecast, by Distribution Channel 2019 & 2032
- Table 136: Global Salt and Flavored Salt Market Volume K Tons Forecast, by Distribution Channel 2019 & 2032
- Table 137: Global Salt and Flavored Salt Market Revenue Million Forecast, by Country 2019 & 2032
- Table 138: Global Salt and Flavored Salt Market Volume K Tons Forecast, by Country 2019 & 2032
- Table 139: Saudi Arabia Salt and Flavored Salt Market Revenue (Million) Forecast, by Application 2019 & 2032
- Table 140: Saudi Arabia Salt and Flavored Salt Market Volume (K Tons) Forecast, by Application 2019 & 2032
- Table 141: Rest of Middle East Salt and Flavored Salt Market Revenue (Million) Forecast, by Application 2019 & 2032
- Table 142: Rest of Middle East Salt and Flavored Salt Market Volume (K Tons) Forecast, by Application 2019 & 2032
Frequently Asked Questions
1. What is the projected Compound Annual Growth Rate (CAGR) of the Salt and Flavored Salt Market?
The projected CAGR is approximately 3.83%.
2. Which companies are prominent players in the Salt and Flavored Salt Market?
Key companies in the market include ITC Ltd*List Not Exhaustive, Akzo Nobel NV, McCormick & Company Inc, Ajinomoto Co Inc, Cornish Sea Salt Co, K+S AG, Saltworks Inc, United Salt Corporation, Tata Chemicals Limited, INFOSA.
3. What are the main segments of the Salt and Flavored Salt Market?
The market segments include Product Type, Distribution Channel.
4. Can you provide details about the market size?
The market size is estimated to be USD XX Million as of 2022.
5. What are some drivers contributing to market growth?
Increasing Incidences of Food Allergies; Favorable Government Initiatives and Regulations for Food Safety.
6. What are the notable trends driving market growth?
Increasing Demand for Organic and Flavored Salt is Driving the Market Growth.
7. Are there any restraints impacting market growth?
Inconsistencies Involved in Food Allergen Declarations.
8. Can you provide examples of recent developments in the market?
November 2022: Truff, the truffle brand known for reimagining and elevating pantry staples, ventured into seasonings with the introduction of Truff Black Truffle Salt. The new product features a blend of fine and coarse sea salt finished with a purposeful amount of black truffles.
9. What pricing options are available for accessing the report?
Pricing options include single-user, multi-user, and enterprise licenses priced at USD 4750, USD 5250, and USD 8750 respectively.
10. Is the market size provided in terms of value or volume?
The market size is provided in terms of value, measured in Million and volume, measured in K Tons.
11. Are there any specific market keywords associated with the report?
Yes, the market keyword associated with the report is "Salt and Flavored Salt Market," which aids in identifying and referencing the specific market segment covered.
12. How do I determine which pricing option suits my needs best?
The pricing options vary based on user requirements and access needs. Individual users may opt for single-user licenses, while businesses requiring broader access may choose multi-user or enterprise licenses for cost-effective access to the report.
13. Are there any additional resources or data provided in the Salt and Flavored Salt Market report?
While the report offers comprehensive insights, it's advisable to review the specific contents or supplementary materials provided to ascertain if additional resources or data are available.
14. How can I stay updated on further developments or reports in the Salt and Flavored Salt Market?
To stay informed about further developments, trends, and reports in the Salt and Flavored Salt Market, consider subscribing to industry newsletters, following relevant companies and organizations, or regularly checking reputable industry news sources and publications.
Methodology
Step 1 - Identification of Relevant Samples Size from Population Database


Step 2 - Approaches for Defining Global Market Size (Value, Volume* & Price*)

Note*: In applicable scenarios
Step 3 - Data Sources
Primary Research
- Web Analytics
- Survey Reports
- Research Institute
- Latest Research Reports
- Opinion Leaders
Secondary Research
- Annual Reports
- White Paper
- Latest Press Release
- Industry Association
- Paid Database
- Investor Presentations

Step 4 - Data Triangulation
Involves using different sources of information in order to increase the validity of a study
These sources are likely to be stakeholders in a program - participants, other researchers, program staff, other community members, and so on.
Then we put all data in single framework & apply various statistical tools to find out the dynamic on the market.
During the analysis stage, feedback from the stakeholder groups would be compared to determine areas of agreement as well as areas of divergence


