
Key Insights
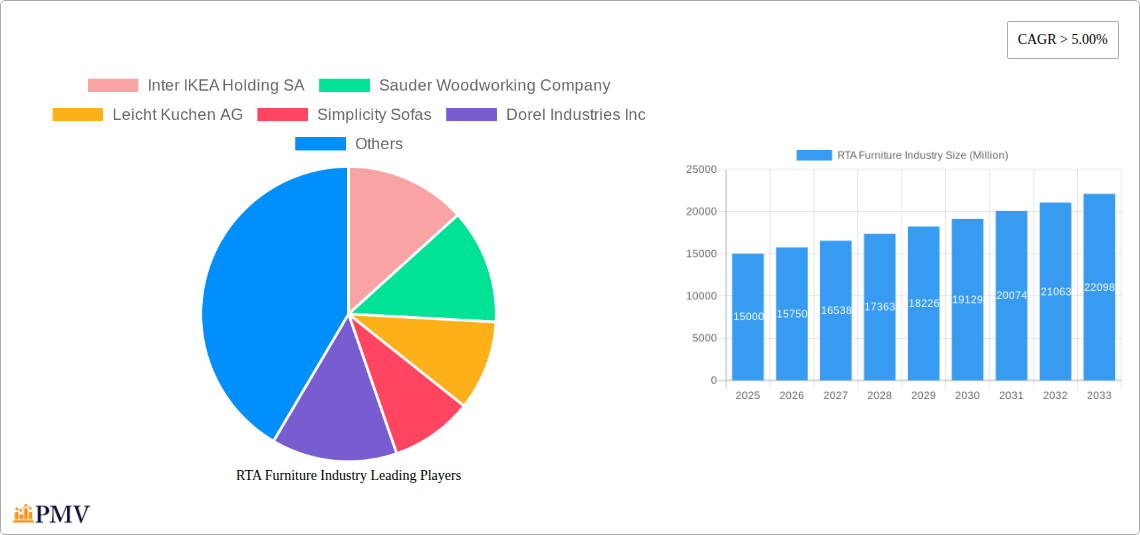
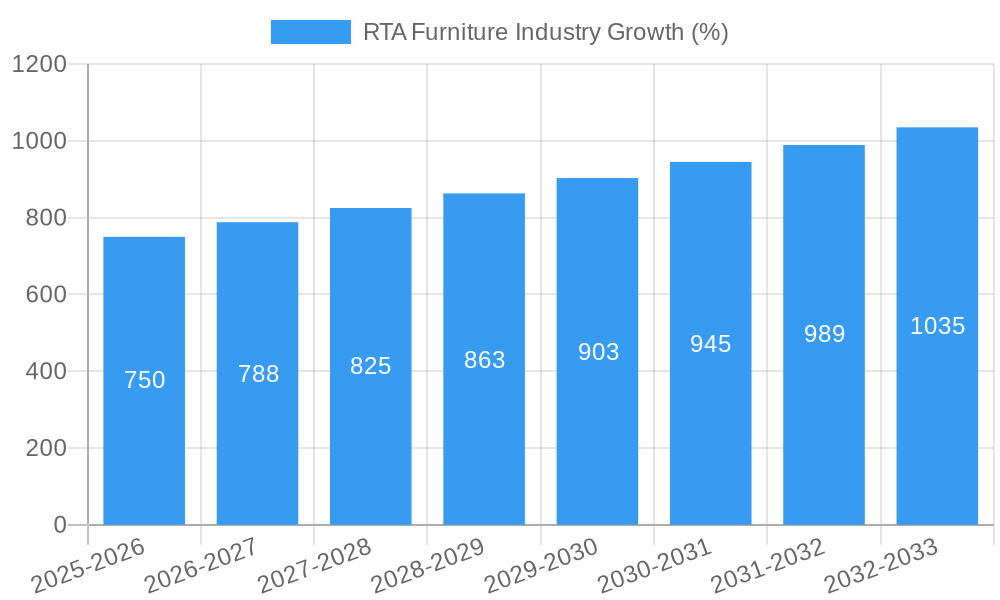
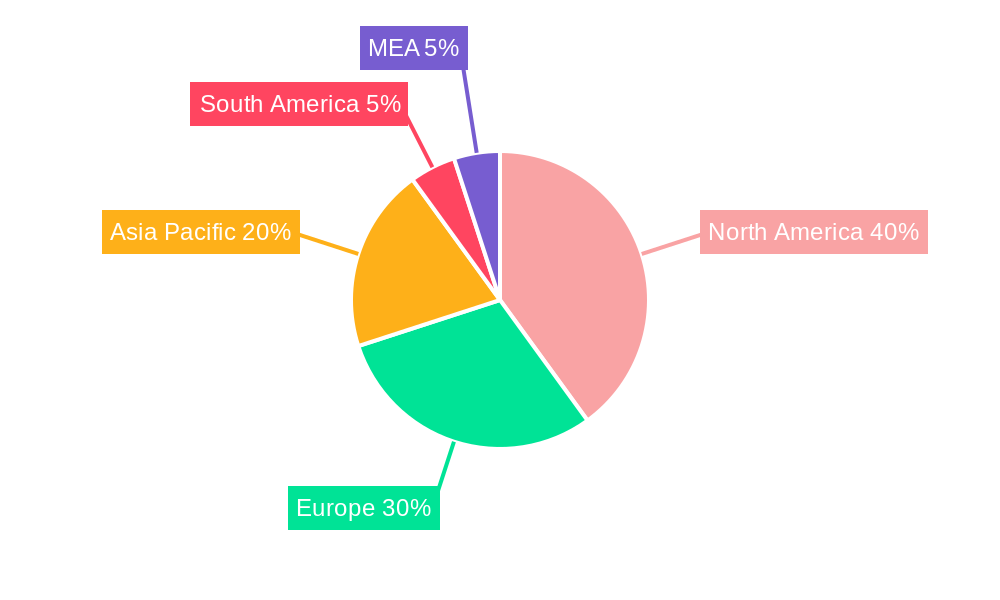
The Ready-to-Assemble (RTA) furniture market is experiencing robust growth, driven by increasing urbanization, a preference for affordable and customizable furniture, and the expanding e-commerce sector. A CAGR exceeding 5% indicates a significant upward trajectory, projecting substantial market expansion from its current size (precise figures unavailable but estimated based on industry reports and comparable markets) throughout the forecast period (2025-2033). Key drivers include the rising popularity of online shopping, providing convenient access to a wide variety of RTA furniture options. Consumer demand for space-saving, easily assembled furniture, particularly among younger demographics and those in smaller living spaces, also fuels market growth. While challenges exist, such as concerns about product quality and assembly complexity, the industry is effectively addressing these by investing in improved designs, enhanced instructions, and better customer support. The market is segmented by product type (tables, chairs, sofas, storage, beds, and others), distribution channels (specialty retailers, flagship stores, home centers, online, designers, and others), and end-users (residential and commercial). Major players like Inter IKEA Holding SA, Sauder Woodworking Company, and Dorel Industries Inc. are strategically positioning themselves to capture market share by focusing on innovation, supply chain optimization, and targeted marketing campaigns. Regional variations in market size reflect differing levels of economic development, consumer preferences, and e-commerce penetration; North America and Europe are currently leading markets, followed by rapidly developing regions in Asia-Pacific.
The growth of the RTA furniture market is projected to continue, fueled by sustained demand from both residential and commercial sectors. The industry's response to consumer concerns about product quality and assembly is crucial for maintaining this growth trajectory. The increasing sophistication of online sales channels, encompassing augmented reality (AR) tools and virtual assembly simulations, is significantly enhancing the customer experience. Furthermore, the strategic partnerships forged between manufacturers and online retailers are streamlining the purchase process and expanding market reach. The expansion of the market will be observed across all segments, with the continued diversification of product offerings catering to diverse lifestyle choices and preferences. Despite potential headwinds, such as fluctuating raw material costs and global economic uncertainties, the long-term outlook for the RTA furniture market remains positive, with considerable opportunities for growth and innovation in the years ahead.
This comprehensive report provides an in-depth analysis of the global Ready-to-Assemble (RTA) furniture industry, offering valuable insights for stakeholders, investors, and industry professionals. Covering the period 2019-2033, with a base year of 2025 and a forecast period of 2025-2033, this report meticulously examines market trends, competitive dynamics, and future growth potential. The global RTA furniture market is projected to reach xx Million by 2033, exhibiting a CAGR of xx% during the forecast period. This report will equip you with actionable intelligence to navigate the complexities of this dynamic market.
RTA Furniture Industry Market Structure & Competitive Dynamics
The global RTA furniture market is characterized by a moderately concentrated landscape, with several key players vying for market share. Inter IKEA Holding SA, Sauder Woodworking Company, Leicht Kuchen AG, and Dorel Industries Inc. are some of the leading players, holding a combined market share of approximately xx%. However, a large number of smaller companies and regional players also contribute significantly to the overall market size. The industry witnesses continuous innovation, particularly in materials, designs, and manufacturing processes, leading to enhanced product functionality and sustainability. Regulatory frameworks concerning product safety and environmental standards significantly influence industry practices. Product substitutes, such as used furniture or modular furniture systems, pose a competitive challenge. Residential consumers dominate the end-user segment, while the commercial sector shows steady growth. Mergers and acquisitions (M&A) activities, with an estimated xx Million in deal value during the historical period, indicate significant consolidation within the market.
- Market Concentration: Moderately concentrated, with a top-four market share of approximately xx%.
- Innovation Ecosystem: Robust innovation in materials, design, and manufacturing processes.
- Regulatory Framework: Stringent regulations concerning product safety and environmental sustainability.
- Product Substitutes: Growing competition from used furniture and modular furniture systems.
- End-User Trends: Predominantly residential, with increasing commercial segment penetration.
- M&A Activity: xx Million in deal value during 2019-2024, indicating industry consolidation.
RTA Furniture Industry Industry Trends & Insights
The RTA furniture industry is experiencing robust growth driven by several factors. The increasing preference for affordable and convenient furniture solutions fuels demand. Technological advancements, including automation in manufacturing and e-commerce platforms, enhance efficiency and accessibility. Changing consumer preferences toward minimalist and space-saving designs are shaping product development. The growth is further amplified by rising disposable incomes in emerging economies and increasing urbanization. The industry is also witnessing the adoption of sustainable and eco-friendly manufacturing practices, leading to increased consumer awareness and demand for environmentally conscious products. However, fluctuating raw material prices and intense competition pose significant challenges. The market is anticipated to grow at a CAGR of xx% from 2025 to 2033, exceeding xx Million by the end of the forecast period. Market penetration of RTA furniture in developing economies is also expected to rise significantly due to the increasing disposable incomes.
Dominant Markets & Segments in RTA Furniture Industry
The North American region currently holds the largest market share in the RTA furniture industry, driven by high consumer spending, a well-established retail infrastructure, and a substantial existing market for this product type. Within product segments, tables, chairs, and sofas constitute the largest market share, followed closely by storage solutions. Online channels are experiencing exponential growth, surpassing traditional retail channels. Residential consumers represent the largest end-user segment.
- Key Drivers for North American Dominance:
- Strong consumer spending power
- Developed retail infrastructure
- Established market for RTA furniture
- Dominant Product Segments: Tables, chairs, and sofas; storage solutions.
- Fastest-Growing Distribution Channel: Online retail.
- Largest End-User Segment: Residential consumers.
RTA Furniture Industry Product Innovations
Recent product innovations focus on enhanced functionality, durability, and design aesthetics. Manufacturers are incorporating smart technology, such as integrated storage and customizable features, to meet evolving consumer preferences. The use of sustainable and eco-friendly materials is gaining traction, aligning with the growing environmental consciousness. These innovations contribute to increased market competitiveness and consumer appeal.
Report Segmentation & Scope
This report segments the RTA furniture market by product type (tables, chairs & sofas, storage, beds, other products), distribution channel (specialty retailers, flagship stores, home centers, online, designers, other channels), and end-user (residential, commercial). Each segment's growth projections, market size, and competitive dynamics are analyzed in detail, providing a granular understanding of the industry structure.
Key Drivers of RTA Furniture Industry Growth
Several factors are driving the growth of the RTA furniture industry. Technological advancements in manufacturing processes reduce costs and enhance efficiency. Favorable economic conditions and increasing disposable incomes enhance consumer purchasing power. Moreover, supportive government policies and regulations promote industry growth. The rising preference for affordable and convenient furniture also fuels the market's expansion.
Challenges in the RTA Furniture Industry Sector
The RTA furniture industry faces several challenges. Fluctuating raw material prices impact production costs. Supply chain disruptions can affect product availability and delivery times. Intense competition from established and emerging players necessitates continuous innovation and cost optimization. Stringent environmental regulations and increasing consumer awareness of sustainable practices pose further challenges. These factors cumulatively influence profitability and market competitiveness.
Leading Players in the RTA Furniture Industry Market
- Inter IKEA Holding SA
- Sauder Woodworking Company
- Leicht Kuchen AG
- Simplicity Sofas
- Dorel Industries Inc
- Bush Industries Inc
- Flexsteel (Home Styles)
- Prepac Manufacturing Ltd
- Venture Horizon Corporation
- Nolte Group
- Wellemobel GmbH
- Tvilum
- Alno Group
- Walker Edison Furniture Company LLC
- Steinhoff Holding
- South Shore Furniture
- Whalen Furniture Manufacturing
Key Developments in RTA Furniture Industry Sector
- 2022 Q3: Launch of a new line of sustainable RTA furniture by Sauder Woodworking, featuring recycled materials.
- 2023 Q1: Acquisition of a smaller RTA furniture manufacturer by Dorel Industries, expanding their market reach.
- 2024 Q2: Introduction of smart features in RTA furniture by Inter IKEA, enhancing user experience. (Note: Further developments can be added as they occur)
Strategic RTA Furniture Industry Market Outlook
The RTA furniture industry is poised for sustained growth, driven by ongoing technological advancements, evolving consumer preferences, and increasing global urbanization. Strategic opportunities exist in expanding into new markets, developing innovative product offerings, and optimizing supply chain efficiency. Focus on sustainability and eco-friendly practices will be crucial for long-term success. The market holds significant potential for growth, especially in emerging economies.
RTA Furniture Industry Segmentation
-
1. Product
- 1.1. Tables
- 1.2. Chairs and Sofas
- 1.3. Storage
- 1.4. Beds
- 1.5. Other Products
-
2. Distribution Channel
- 2.1. Specialty Retailers
- 2.2. Flagship Stores
- 2.3. Home Centers
- 2.4. Online
- 2.5. Designers
- 2.6. Other Distribution Channels
-
3. End User
- 3.1. Residential
- 3.2. Commercial
RTA Furniture Industry Segmentation By Geography
- 1. North America
- 2. Europe
- 3. Asia Pacific
- 4. Latin America
- 5. Middle East
RTA Furniture Industry REPORT HIGHLIGHTS
| Aspects | Details |
|---|---|
| Study Period | 2019-2033 |
| Base Year | 2024 |
| Estimated Year | 2025 |
| Forecast Period | 2025-2033 |
| Historical Period | 2019-2024 |
| Growth Rate | CAGR of > 5.00% from 2019-2033 |
| Segmentation |
|
Table of Contents
- 1. Introduction
- 1.1. Research Scope
- 1.2. Market Segmentation
- 1.3. Research Methodology
- 1.4. Definitions and Assumptions
- 2. Executive Summary
- 2.1. Introduction
- 3. Market Dynamics
- 3.1. Introduction
- 3.2. Market Drivers
- 3.2.1. Rise in E-commerce is Driving the Market; Rise in Construction and Real Estate Sector Drives the Furniture Market
- 3.3. Market Restrains
- 3.3.1. Economic Fluctuations; High Competition in the Furniture Market
- 3.4. Market Trends
- 3.4.1. Convenience of RTA furniture
- 4. Market Factor Analysis
- 4.1. Porters Five Forces
- 4.2. Supply/Value Chain
- 4.3. PESTEL analysis
- 4.4. Market Entropy
- 4.5. Patent/Trademark Analysis
- 5. Global RTA Furniture Industry Analysis, Insights and Forecast, 2019-2031
- 5.1. Market Analysis, Insights and Forecast - by Product
- 5.1.1. Tables
- 5.1.2. Chairs and Sofas
- 5.1.3. Storage
- 5.1.4. Beds
- 5.1.5. Other Products
- 5.2. Market Analysis, Insights and Forecast - by Distribution Channel
- 5.2.1. Specialty Retailers
- 5.2.2. Flagship Stores
- 5.2.3. Home Centers
- 5.2.4. Online
- 5.2.5. Designers
- 5.2.6. Other Distribution Channels
- 5.3. Market Analysis, Insights and Forecast - by End User
- 5.3.1. Residential
- 5.3.2. Commercial
- 5.4. Market Analysis, Insights and Forecast - by Region
- 5.4.1. North America
- 5.4.2. Europe
- 5.4.3. Asia Pacific
- 5.4.4. Latin America
- 5.4.5. Middle East
- 5.1. Market Analysis, Insights and Forecast - by Product
- 6. North America RTA Furniture Industry Analysis, Insights and Forecast, 2019-2031
- 6.1. Market Analysis, Insights and Forecast - by Product
- 6.1.1. Tables
- 6.1.2. Chairs and Sofas
- 6.1.3. Storage
- 6.1.4. Beds
- 6.1.5. Other Products
- 6.2. Market Analysis, Insights and Forecast - by Distribution Channel
- 6.2.1. Specialty Retailers
- 6.2.2. Flagship Stores
- 6.2.3. Home Centers
- 6.2.4. Online
- 6.2.5. Designers
- 6.2.6. Other Distribution Channels
- 6.3. Market Analysis, Insights and Forecast - by End User
- 6.3.1. Residential
- 6.3.2. Commercial
- 6.1. Market Analysis, Insights and Forecast - by Product
- 7. Europe RTA Furniture Industry Analysis, Insights and Forecast, 2019-2031
- 7.1. Market Analysis, Insights and Forecast - by Product
- 7.1.1. Tables
- 7.1.2. Chairs and Sofas
- 7.1.3. Storage
- 7.1.4. Beds
- 7.1.5. Other Products
- 7.2. Market Analysis, Insights and Forecast - by Distribution Channel
- 7.2.1. Specialty Retailers
- 7.2.2. Flagship Stores
- 7.2.3. Home Centers
- 7.2.4. Online
- 7.2.5. Designers
- 7.2.6. Other Distribution Channels
- 7.3. Market Analysis, Insights and Forecast - by End User
- 7.3.1. Residential
- 7.3.2. Commercial
- 7.1. Market Analysis, Insights and Forecast - by Product
- 8. Asia Pacific RTA Furniture Industry Analysis, Insights and Forecast, 2019-2031
- 8.1. Market Analysis, Insights and Forecast - by Product
- 8.1.1. Tables
- 8.1.2. Chairs and Sofas
- 8.1.3. Storage
- 8.1.4. Beds
- 8.1.5. Other Products
- 8.2. Market Analysis, Insights and Forecast - by Distribution Channel
- 8.2.1. Specialty Retailers
- 8.2.2. Flagship Stores
- 8.2.3. Home Centers
- 8.2.4. Online
- 8.2.5. Designers
- 8.2.6. Other Distribution Channels
- 8.3. Market Analysis, Insights and Forecast - by End User
- 8.3.1. Residential
- 8.3.2. Commercial
- 8.1. Market Analysis, Insights and Forecast - by Product
- 9. Latin America RTA Furniture Industry Analysis, Insights and Forecast, 2019-2031
- 9.1. Market Analysis, Insights and Forecast - by Product
- 9.1.1. Tables
- 9.1.2. Chairs and Sofas
- 9.1.3. Storage
- 9.1.4. Beds
- 9.1.5. Other Products
- 9.2. Market Analysis, Insights and Forecast - by Distribution Channel
- 9.2.1. Specialty Retailers
- 9.2.2. Flagship Stores
- 9.2.3. Home Centers
- 9.2.4. Online
- 9.2.5. Designers
- 9.2.6. Other Distribution Channels
- 9.3. Market Analysis, Insights and Forecast - by End User
- 9.3.1. Residential
- 9.3.2. Commercial
- 9.1. Market Analysis, Insights and Forecast - by Product
- 10. Middle East RTA Furniture Industry Analysis, Insights and Forecast, 2019-2031
- 10.1. Market Analysis, Insights and Forecast - by Product
- 10.1.1. Tables
- 10.1.2. Chairs and Sofas
- 10.1.3. Storage
- 10.1.4. Beds
- 10.1.5. Other Products
- 10.2. Market Analysis, Insights and Forecast - by Distribution Channel
- 10.2.1. Specialty Retailers
- 10.2.2. Flagship Stores
- 10.2.3. Home Centers
- 10.2.4. Online
- 10.2.5. Designers
- 10.2.6. Other Distribution Channels
- 10.3. Market Analysis, Insights and Forecast - by End User
- 10.3.1. Residential
- 10.3.2. Commercial
- 10.1. Market Analysis, Insights and Forecast - by Product
- 11. North America RTA Furniture Industry Analysis, Insights and Forecast, 2019-2031
- 11.1. Market Analysis, Insights and Forecast - By Country/Sub-region
- 11.1.1 United States
- 11.1.2 Canada
- 11.1.3 Mexico
- 12. Europe RTA Furniture Industry Analysis, Insights and Forecast, 2019-2031
- 12.1. Market Analysis, Insights and Forecast - By Country/Sub-region
- 12.1.1 Germany
- 12.1.2 United Kingdom
- 12.1.3 France
- 12.1.4 Spain
- 12.1.5 Italy
- 12.1.6 Spain
- 12.1.7 Belgium
- 12.1.8 Netherland
- 12.1.9 Nordics
- 12.1.10 Rest of Europe
- 13. Asia Pacific RTA Furniture Industry Analysis, Insights and Forecast, 2019-2031
- 13.1. Market Analysis, Insights and Forecast - By Country/Sub-region
- 13.1.1 China
- 13.1.2 Japan
- 13.1.3 India
- 13.1.4 South Korea
- 13.1.5 Southeast Asia
- 13.1.6 Australia
- 13.1.7 Indonesia
- 13.1.8 Phillipes
- 13.1.9 Singapore
- 13.1.10 Thailandc
- 13.1.11 Rest of Asia Pacific
- 14. South America RTA Furniture Industry Analysis, Insights and Forecast, 2019-2031
- 14.1. Market Analysis, Insights and Forecast - By Country/Sub-region
- 14.1.1 Brazil
- 14.1.2 Argentina
- 14.1.3 Peru
- 14.1.4 Chile
- 14.1.5 Colombia
- 14.1.6 Ecuador
- 14.1.7 Venezuela
- 14.1.8 Rest of South America
- 15. North America RTA Furniture Industry Analysis, Insights and Forecast, 2019-2031
- 15.1. Market Analysis, Insights and Forecast - By Country/Sub-region
- 15.1.1 United States
- 15.1.2 Canada
- 15.1.3 Mexico
- 16. MEA RTA Furniture Industry Analysis, Insights and Forecast, 2019-2031
- 16.1. Market Analysis, Insights and Forecast - By Country/Sub-region
- 16.1.1 United Arab Emirates
- 16.1.2 Saudi Arabia
- 16.1.3 South Africa
- 16.1.4 Rest of Middle East and Africa
- 17. Competitive Analysis
- 17.1. Global Market Share Analysis 2024
- 17.2. Company Profiles
- 17.2.1 Inter IKEA Holding SA
- 17.2.1.1. Overview
- 17.2.1.2. Products
- 17.2.1.3. SWOT Analysis
- 17.2.1.4. Recent Developments
- 17.2.1.5. Financials (Based on Availability)
- 17.2.2 Sauder Woodworking Company
- 17.2.2.1. Overview
- 17.2.2.2. Products
- 17.2.2.3. SWOT Analysis
- 17.2.2.4. Recent Developments
- 17.2.2.5. Financials (Based on Availability)
- 17.2.3 Leicht Kuchen AG
- 17.2.3.1. Overview
- 17.2.3.2. Products
- 17.2.3.3. SWOT Analysis
- 17.2.3.4. Recent Developments
- 17.2.3.5. Financials (Based on Availability)
- 17.2.4 Simplicity Sofas
- 17.2.4.1. Overview
- 17.2.4.2. Products
- 17.2.4.3. SWOT Analysis
- 17.2.4.4. Recent Developments
- 17.2.4.5. Financials (Based on Availability)
- 17.2.5 Dorel Industries Inc
- 17.2.5.1. Overview
- 17.2.5.2. Products
- 17.2.5.3. SWOT Analysis
- 17.2.5.4. Recent Developments
- 17.2.5.5. Financials (Based on Availability)
- 17.2.6 Bush Industries Inc
- 17.2.6.1. Overview
- 17.2.6.2. Products
- 17.2.6.3. SWOT Analysis
- 17.2.6.4. Recent Developments
- 17.2.6.5. Financials (Based on Availability)
- 17.2.7 Flexsteel (Home Styles)
- 17.2.7.1. Overview
- 17.2.7.2. Products
- 17.2.7.3. SWOT Analysis
- 17.2.7.4. Recent Developments
- 17.2.7.5. Financials (Based on Availability)
- 17.2.8 Other Key Players (Prepac Manufacturing Ltd Venture Horizon Corporation Nolte Group Wellemobel GmbH Tvilum Alno Group Walker Edison Furniture Company LLC and others)**List Not Exhaustive
- 17.2.8.1. Overview
- 17.2.8.2. Products
- 17.2.8.3. SWOT Analysis
- 17.2.8.4. Recent Developments
- 17.2.8.5. Financials (Based on Availability)
- 17.2.9 Steinhoff Holding
- 17.2.9.1. Overview
- 17.2.9.2. Products
- 17.2.9.3. SWOT Analysis
- 17.2.9.4. Recent Developments
- 17.2.9.5. Financials (Based on Availability)
- 17.2.10 South Shore Furniture
- 17.2.10.1. Overview
- 17.2.10.2. Products
- 17.2.10.3. SWOT Analysis
- 17.2.10.4. Recent Developments
- 17.2.10.5. Financials (Based on Availability)
- 17.2.11 6 COMPETITIVE LANDSCAPE 6 1 MARKET CONCENTRATION OVERVIEW 6 2 COMPANY PROFILES
- 17.2.11.1. Overview
- 17.2.11.2. Products
- 17.2.11.3. SWOT Analysis
- 17.2.11.4. Recent Developments
- 17.2.11.5. Financials (Based on Availability)
- 17.2.12 Whalen Furniture Manufacturing
- 17.2.12.1. Overview
- 17.2.12.2. Products
- 17.2.12.3. SWOT Analysis
- 17.2.12.4. Recent Developments
- 17.2.12.5. Financials (Based on Availability)
- 17.2.1 Inter IKEA Holding SA
List of Figures
- Figure 1: Global RTA Furniture Industry Revenue Breakdown (Million, %) by Region 2024 & 2032
- Figure 2: North America RTA Furniture Industry Revenue (Million), by Country 2024 & 2032
- Figure 3: North America RTA Furniture Industry Revenue Share (%), by Country 2024 & 2032
- Figure 4: Europe RTA Furniture Industry Revenue (Million), by Country 2024 & 2032
- Figure 5: Europe RTA Furniture Industry Revenue Share (%), by Country 2024 & 2032
- Figure 6: Asia Pacific RTA Furniture Industry Revenue (Million), by Country 2024 & 2032
- Figure 7: Asia Pacific RTA Furniture Industry Revenue Share (%), by Country 2024 & 2032
- Figure 8: South America RTA Furniture Industry Revenue (Million), by Country 2024 & 2032
- Figure 9: South America RTA Furniture Industry Revenue Share (%), by Country 2024 & 2032
- Figure 10: North America RTA Furniture Industry Revenue (Million), by Country 2024 & 2032
- Figure 11: North America RTA Furniture Industry Revenue Share (%), by Country 2024 & 2032
- Figure 12: MEA RTA Furniture Industry Revenue (Million), by Country 2024 & 2032
- Figure 13: MEA RTA Furniture Industry Revenue Share (%), by Country 2024 & 2032
- Figure 14: North America RTA Furniture Industry Revenue (Million), by Product 2024 & 2032
- Figure 15: North America RTA Furniture Industry Revenue Share (%), by Product 2024 & 2032
- Figure 16: North America RTA Furniture Industry Revenue (Million), by Distribution Channel 2024 & 2032
- Figure 17: North America RTA Furniture Industry Revenue Share (%), by Distribution Channel 2024 & 2032
- Figure 18: North America RTA Furniture Industry Revenue (Million), by End User 2024 & 2032
- Figure 19: North America RTA Furniture Industry Revenue Share (%), by End User 2024 & 2032
- Figure 20: North America RTA Furniture Industry Revenue (Million), by Country 2024 & 2032
- Figure 21: North America RTA Furniture Industry Revenue Share (%), by Country 2024 & 2032
- Figure 22: Europe RTA Furniture Industry Revenue (Million), by Product 2024 & 2032
- Figure 23: Europe RTA Furniture Industry Revenue Share (%), by Product 2024 & 2032
- Figure 24: Europe RTA Furniture Industry Revenue (Million), by Distribution Channel 2024 & 2032
- Figure 25: Europe RTA Furniture Industry Revenue Share (%), by Distribution Channel 2024 & 2032
- Figure 26: Europe RTA Furniture Industry Revenue (Million), by End User 2024 & 2032
- Figure 27: Europe RTA Furniture Industry Revenue Share (%), by End User 2024 & 2032
- Figure 28: Europe RTA Furniture Industry Revenue (Million), by Country 2024 & 2032
- Figure 29: Europe RTA Furniture Industry Revenue Share (%), by Country 2024 & 2032
- Figure 30: Asia Pacific RTA Furniture Industry Revenue (Million), by Product 2024 & 2032
- Figure 31: Asia Pacific RTA Furniture Industry Revenue Share (%), by Product 2024 & 2032
- Figure 32: Asia Pacific RTA Furniture Industry Revenue (Million), by Distribution Channel 2024 & 2032
- Figure 33: Asia Pacific RTA Furniture Industry Revenue Share (%), by Distribution Channel 2024 & 2032
- Figure 34: Asia Pacific RTA Furniture Industry Revenue (Million), by End User 2024 & 2032
- Figure 35: Asia Pacific RTA Furniture Industry Revenue Share (%), by End User 2024 & 2032
- Figure 36: Asia Pacific RTA Furniture Industry Revenue (Million), by Country 2024 & 2032
- Figure 37: Asia Pacific RTA Furniture Industry Revenue Share (%), by Country 2024 & 2032
- Figure 38: Latin America RTA Furniture Industry Revenue (Million), by Product 2024 & 2032
- Figure 39: Latin America RTA Furniture Industry Revenue Share (%), by Product 2024 & 2032
- Figure 40: Latin America RTA Furniture Industry Revenue (Million), by Distribution Channel 2024 & 2032
- Figure 41: Latin America RTA Furniture Industry Revenue Share (%), by Distribution Channel 2024 & 2032
- Figure 42: Latin America RTA Furniture Industry Revenue (Million), by End User 2024 & 2032
- Figure 43: Latin America RTA Furniture Industry Revenue Share (%), by End User 2024 & 2032
- Figure 44: Latin America RTA Furniture Industry Revenue (Million), by Country 2024 & 2032
- Figure 45: Latin America RTA Furniture Industry Revenue Share (%), by Country 2024 & 2032
- Figure 46: Middle East RTA Furniture Industry Revenue (Million), by Product 2024 & 2032
- Figure 47: Middle East RTA Furniture Industry Revenue Share (%), by Product 2024 & 2032
- Figure 48: Middle East RTA Furniture Industry Revenue (Million), by Distribution Channel 2024 & 2032
- Figure 49: Middle East RTA Furniture Industry Revenue Share (%), by Distribution Channel 2024 & 2032
- Figure 50: Middle East RTA Furniture Industry Revenue (Million), by End User 2024 & 2032
- Figure 51: Middle East RTA Furniture Industry Revenue Share (%), by End User 2024 & 2032
- Figure 52: Middle East RTA Furniture Industry Revenue (Million), by Country 2024 & 2032
- Figure 53: Middle East RTA Furniture Industry Revenue Share (%), by Country 2024 & 2032
List of Tables
- Table 1: Global RTA Furniture Industry Revenue Million Forecast, by Region 2019 & 2032
- Table 2: Global RTA Furniture Industry Revenue Million Forecast, by Product 2019 & 2032
- Table 3: Global RTA Furniture Industry Revenue Million Forecast, by Distribution Channel 2019 & 2032
- Table 4: Global RTA Furniture Industry Revenue Million Forecast, by End User 2019 & 2032
- Table 5: Global RTA Furniture Industry Revenue Million Forecast, by Region 2019 & 2032
- Table 6: Global RTA Furniture Industry Revenue Million Forecast, by Country 2019 & 2032
- Table 7: United States RTA Furniture Industry Revenue (Million) Forecast, by Application 2019 & 2032
- Table 8: Canada RTA Furniture Industry Revenue (Million) Forecast, by Application 2019 & 2032
- Table 9: Mexico RTA Furniture Industry Revenue (Million) Forecast, by Application 2019 & 2032
- Table 10: Global RTA Furniture Industry Revenue Million Forecast, by Country 2019 & 2032
- Table 11: Germany RTA Furniture Industry Revenue (Million) Forecast, by Application 2019 & 2032
- Table 12: United Kingdom RTA Furniture Industry Revenue (Million) Forecast, by Application 2019 & 2032
- Table 13: France RTA Furniture Industry Revenue (Million) Forecast, by Application 2019 & 2032
- Table 14: Spain RTA Furniture Industry Revenue (Million) Forecast, by Application 2019 & 2032
- Table 15: Italy RTA Furniture Industry Revenue (Million) Forecast, by Application 2019 & 2032
- Table 16: Spain RTA Furniture Industry Revenue (Million) Forecast, by Application 2019 & 2032
- Table 17: Belgium RTA Furniture Industry Revenue (Million) Forecast, by Application 2019 & 2032
- Table 18: Netherland RTA Furniture Industry Revenue (Million) Forecast, by Application 2019 & 2032
- Table 19: Nordics RTA Furniture Industry Revenue (Million) Forecast, by Application 2019 & 2032
- Table 20: Rest of Europe RTA Furniture Industry Revenue (Million) Forecast, by Application 2019 & 2032
- Table 21: Global RTA Furniture Industry Revenue Million Forecast, by Country 2019 & 2032
- Table 22: China RTA Furniture Industry Revenue (Million) Forecast, by Application 2019 & 2032
- Table 23: Japan RTA Furniture Industry Revenue (Million) Forecast, by Application 2019 & 2032
- Table 24: India RTA Furniture Industry Revenue (Million) Forecast, by Application 2019 & 2032
- Table 25: South Korea RTA Furniture Industry Revenue (Million) Forecast, by Application 2019 & 2032
- Table 26: Southeast Asia RTA Furniture Industry Revenue (Million) Forecast, by Application 2019 & 2032
- Table 27: Australia RTA Furniture Industry Revenue (Million) Forecast, by Application 2019 & 2032
- Table 28: Indonesia RTA Furniture Industry Revenue (Million) Forecast, by Application 2019 & 2032
- Table 29: Phillipes RTA Furniture Industry Revenue (Million) Forecast, by Application 2019 & 2032
- Table 30: Singapore RTA Furniture Industry Revenue (Million) Forecast, by Application 2019 & 2032
- Table 31: Thailandc RTA Furniture Industry Revenue (Million) Forecast, by Application 2019 & 2032
- Table 32: Rest of Asia Pacific RTA Furniture Industry Revenue (Million) Forecast, by Application 2019 & 2032
- Table 33: Global RTA Furniture Industry Revenue Million Forecast, by Country 2019 & 2032
- Table 34: Brazil RTA Furniture Industry Revenue (Million) Forecast, by Application 2019 & 2032
- Table 35: Argentina RTA Furniture Industry Revenue (Million) Forecast, by Application 2019 & 2032
- Table 36: Peru RTA Furniture Industry Revenue (Million) Forecast, by Application 2019 & 2032
- Table 37: Chile RTA Furniture Industry Revenue (Million) Forecast, by Application 2019 & 2032
- Table 38: Colombia RTA Furniture Industry Revenue (Million) Forecast, by Application 2019 & 2032
- Table 39: Ecuador RTA Furniture Industry Revenue (Million) Forecast, by Application 2019 & 2032
- Table 40: Venezuela RTA Furniture Industry Revenue (Million) Forecast, by Application 2019 & 2032
- Table 41: Rest of South America RTA Furniture Industry Revenue (Million) Forecast, by Application 2019 & 2032
- Table 42: Global RTA Furniture Industry Revenue Million Forecast, by Country 2019 & 2032
- Table 43: United States RTA Furniture Industry Revenue (Million) Forecast, by Application 2019 & 2032
- Table 44: Canada RTA Furniture Industry Revenue (Million) Forecast, by Application 2019 & 2032
- Table 45: Mexico RTA Furniture Industry Revenue (Million) Forecast, by Application 2019 & 2032
- Table 46: Global RTA Furniture Industry Revenue Million Forecast, by Country 2019 & 2032
- Table 47: United Arab Emirates RTA Furniture Industry Revenue (Million) Forecast, by Application 2019 & 2032
- Table 48: Saudi Arabia RTA Furniture Industry Revenue (Million) Forecast, by Application 2019 & 2032
- Table 49: South Africa RTA Furniture Industry Revenue (Million) Forecast, by Application 2019 & 2032
- Table 50: Rest of Middle East and Africa RTA Furniture Industry Revenue (Million) Forecast, by Application 2019 & 2032
- Table 51: Global RTA Furniture Industry Revenue Million Forecast, by Product 2019 & 2032
- Table 52: Global RTA Furniture Industry Revenue Million Forecast, by Distribution Channel 2019 & 2032
- Table 53: Global RTA Furniture Industry Revenue Million Forecast, by End User 2019 & 2032
- Table 54: Global RTA Furniture Industry Revenue Million Forecast, by Country 2019 & 2032
- Table 55: Global RTA Furniture Industry Revenue Million Forecast, by Product 2019 & 2032
- Table 56: Global RTA Furniture Industry Revenue Million Forecast, by Distribution Channel 2019 & 2032
- Table 57: Global RTA Furniture Industry Revenue Million Forecast, by End User 2019 & 2032
- Table 58: Global RTA Furniture Industry Revenue Million Forecast, by Country 2019 & 2032
- Table 59: Global RTA Furniture Industry Revenue Million Forecast, by Product 2019 & 2032
- Table 60: Global RTA Furniture Industry Revenue Million Forecast, by Distribution Channel 2019 & 2032
- Table 61: Global RTA Furniture Industry Revenue Million Forecast, by End User 2019 & 2032
- Table 62: Global RTA Furniture Industry Revenue Million Forecast, by Country 2019 & 2032
- Table 63: Global RTA Furniture Industry Revenue Million Forecast, by Product 2019 & 2032
- Table 64: Global RTA Furniture Industry Revenue Million Forecast, by Distribution Channel 2019 & 2032
- Table 65: Global RTA Furniture Industry Revenue Million Forecast, by End User 2019 & 2032
- Table 66: Global RTA Furniture Industry Revenue Million Forecast, by Country 2019 & 2032
- Table 67: Global RTA Furniture Industry Revenue Million Forecast, by Product 2019 & 2032
- Table 68: Global RTA Furniture Industry Revenue Million Forecast, by Distribution Channel 2019 & 2032
- Table 69: Global RTA Furniture Industry Revenue Million Forecast, by End User 2019 & 2032
- Table 70: Global RTA Furniture Industry Revenue Million Forecast, by Country 2019 & 2032
Frequently Asked Questions
1. What is the projected Compound Annual Growth Rate (CAGR) of the RTA Furniture Industry?
The projected CAGR is approximately > 5.00%.
2. Which companies are prominent players in the RTA Furniture Industry?
Key companies in the market include Inter IKEA Holding SA, Sauder Woodworking Company, Leicht Kuchen AG, Simplicity Sofas, Dorel Industries Inc, Bush Industries Inc, Flexsteel (Home Styles), Other Key Players (Prepac Manufacturing Ltd Venture Horizon Corporation Nolte Group Wellemobel GmbH Tvilum Alno Group Walker Edison Furniture Company LLC and others)**List Not Exhaustive, Steinhoff Holding, South Shore Furniture, 6 COMPETITIVE LANDSCAPE 6 1 MARKET CONCENTRATION OVERVIEW 6 2 COMPANY PROFILES, Whalen Furniture Manufacturing.
3. What are the main segments of the RTA Furniture Industry?
The market segments include Product, Distribution Channel, End User.
4. Can you provide details about the market size?
The market size is estimated to be USD XX Million as of 2022.
5. What are some drivers contributing to market growth?
Rise in E-commerce is Driving the Market; Rise in Construction and Real Estate Sector Drives the Furniture Market.
6. What are the notable trends driving market growth?
Convenience of RTA furniture.
7. Are there any restraints impacting market growth?
Economic Fluctuations; High Competition in the Furniture Market.
8. Can you provide examples of recent developments in the market?
N/A
9. What pricing options are available for accessing the report?
Pricing options include single-user, multi-user, and enterprise licenses priced at USD 4750, USD 5250, and USD 8750 respectively.
10. Is the market size provided in terms of value or volume?
The market size is provided in terms of value, measured in Million.
11. Are there any specific market keywords associated with the report?
Yes, the market keyword associated with the report is "RTA Furniture Industry," which aids in identifying and referencing the specific market segment covered.
12. How do I determine which pricing option suits my needs best?
The pricing options vary based on user requirements and access needs. Individual users may opt for single-user licenses, while businesses requiring broader access may choose multi-user or enterprise licenses for cost-effective access to the report.
13. Are there any additional resources or data provided in the RTA Furniture Industry report?
While the report offers comprehensive insights, it's advisable to review the specific contents or supplementary materials provided to ascertain if additional resources or data are available.
14. How can I stay updated on further developments or reports in the RTA Furniture Industry?
To stay informed about further developments, trends, and reports in the RTA Furniture Industry, consider subscribing to industry newsletters, following relevant companies and organizations, or regularly checking reputable industry news sources and publications.
Methodology
Step 1 - Identification of Relevant Samples Size from Population Database


Step 2 - Approaches for Defining Global Market Size (Value, Volume* & Price*)

Note*: In applicable scenarios
Step 3 - Data Sources
Primary Research
- Web Analytics
- Survey Reports
- Research Institute
- Latest Research Reports
- Opinion Leaders
Secondary Research
- Annual Reports
- White Paper
- Latest Press Release
- Industry Association
- Paid Database
- Investor Presentations

Step 4 - Data Triangulation
Involves using different sources of information in order to increase the validity of a study
These sources are likely to be stakeholders in a program - participants, other researchers, program staff, other community members, and so on.
Then we put all data in single framework & apply various statistical tools to find out the dynamic on the market.
During the analysis stage, feedback from the stakeholder groups would be compared to determine areas of agreement as well as areas of divergence


