

Key Insights
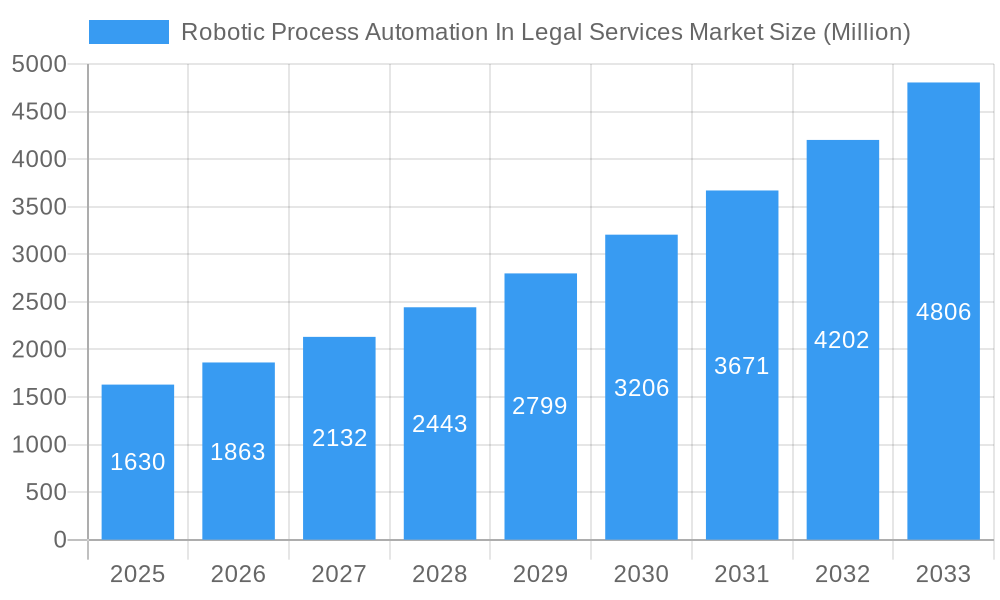
The Robotic Process Automation (RPA) in Legal Services market is experiencing robust growth, projected to reach $1.63 billion by 2025 and maintain a Compound Annual Growth Rate (CAGR) of 14.65% from 2025 to 2033. This expansion is driven by the increasing need for efficiency and accuracy in legal processes, coupled with the rising volume of data and documents handled by law firms and legal departments. Automation of repetitive tasks such as document review, contract analysis, and e-discovery significantly reduces operational costs and improves turnaround times. Trends such as the adoption of cloud-based RPA solutions and the integration of AI capabilities within RPA platforms are further fueling market growth. While initial investment costs and the need for skilled professionals represent potential restraints, the long-term benefits of increased productivity and reduced errors outweigh these challenges. Major players like UiPath, Blue Prism, Automation Anywhere, and others are actively developing and deploying RPA solutions tailored to the unique requirements of the legal sector, driving innovation and competition within the market. The market segmentation likely includes solutions by deployment type (cloud, on-premise), by application (document processing, contract management, e-discovery), and by firm size (large law firms, small and medium-sized practices). The regional distribution is expected to see strong growth in North America and Europe initially, followed by increasing adoption in Asia-Pacific and other regions as awareness and acceptance of RPA technology mature.
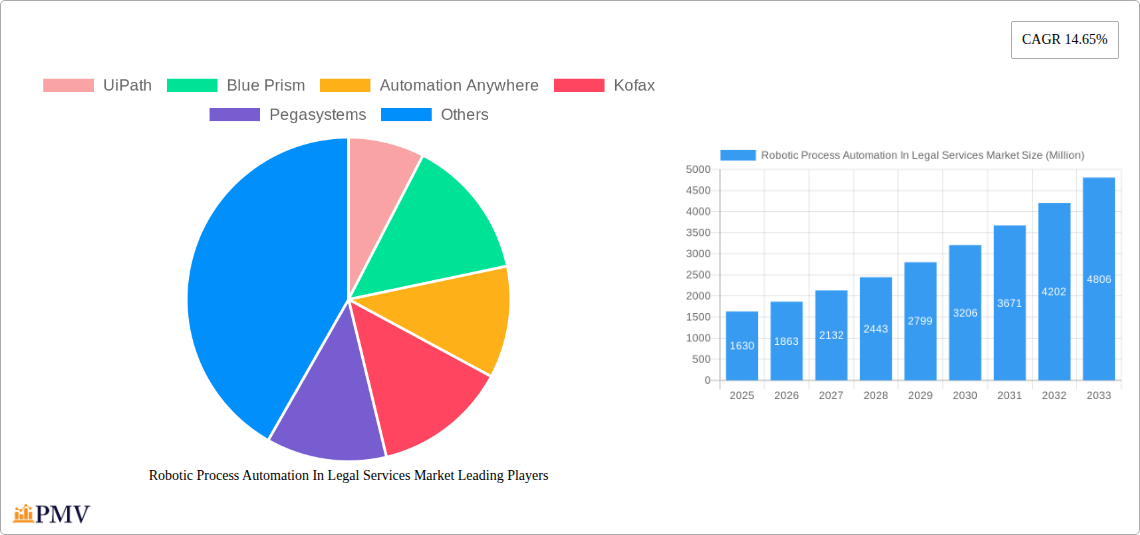
Robotic Process Automation In Legal Services Market Market Size (In Billion)
The forecast period of 2025-2033 indicates continued market expansion, driven by increasing digitalization within the legal industry. The legal sector’s reliance on meticulous accuracy and high volumes of data makes it an ideal candidate for RPA implementation. The integration of RPA with other technologies, such as Artificial Intelligence (AI) and Machine Learning (ML), is likely to create even more sophisticated and efficient automation solutions. This will lead to further market fragmentation as niche players offering specialized RPA tools emerge. The market's future trajectory suggests significant opportunities for both established RPA providers and emerging technology companies focusing on legal-specific automation. Competitive pressures will likely drive innovation and cost optimization, leading to more accessible and affordable RPA solutions for legal professionals of all sizes.
Robotic Process Automation In Legal Services Market Company Market Share
Robotic Process Automation in Legal Services Market: A Comprehensive Report (2019-2033)
This in-depth report provides a comprehensive analysis of the Robotic Process Automation (RPA) in Legal Services market, offering invaluable insights for stakeholders across the industry. The study period spans from 2019 to 2033, with 2025 serving as the base and estimated year. The forecast period covers 2025-2033, while the historical period encompasses 2019-2024. This report meticulously examines market dynamics, competitive landscapes, technological advancements, and future growth prospects, providing actionable intelligence for strategic decision-making. Key players analyzed include UiPath, Blue Prism, Automation Anywhere, Kofax, Pegasystems, NICE, IBM, WorkFusion, EdgeVerve, and Kira Systems (list not exhaustive). The report projects a market value exceeding xx Million by 2033.
Robotic Process Automation In Legal Services Market Market Structure & Competitive Dynamics
The Robotic Process Automation (RPA) in Legal Services market is characterized by a moderately concentrated structure, with a few established leaders and emerging innovators actively shaping the competitive landscape. This dynamic environment is fueled by continuous technological advancements, strategic collaborations, and a notable increase in mergers and acquisitions (M&A). Key determinants of market concentration include a firm's technological prowess, brand equity, and the comprehensiveness of its service portfolio. While specific market share figures are subject to ongoing shifts, leading entities such as UiPath, Blue Prism, and Automation Anywhere consistently hold significant portions of the global market, with a substantial collective share. The ecosystem of innovation is paramount, driving the development and seamless integration of novel RPA solutions with existing legal technologies. Furthermore, stringent regulatory frameworks, particularly those governing data privacy and security, exert considerable influence on market expansion and the pace of adoption. The presence of alternative technologies, like Business Process Management (BPM) systems, also presents a dynamic interplay, impacting the overall market trajectory. End-user preferences, increasingly leaning towards enhanced efficiency and cost optimization in legal processes, serve as a powerful catalyst for market growth. M&A activities, with recent transactions ranging from substantial millions to tens of millions, are actively redefining competitive boundaries. For instance, recent investments in entities like Comau underscore a burgeoning interest in industrial automation, which is beginning to permeate adjacent sectors. This broader trend suggests a potential for expanded RPA capabilities, facilitating more integrated physical and digital workflows within legal operations.
Robotic Process Automation In Legal Services Market Industry Trends & Insights
The RPA in Legal Services market is experiencing robust and sustained growth, propelled by a confluence of influential factors. The Compound Annual Growth Rate (CAGR) for the market is projected to be approximately [Insert CAGR Percentage Here] during the forecast period, indicative of escalating adoption across a wide spectrum of legal functions. Significant technological advancements, particularly in Artificial Intelligence (AI) and Machine Learning (ML), are augmenting RPA's capabilities, enabling the automation of increasingly sophisticated and nuanced tasks. Consumer preferences are demonstrably shifting towards greater operational efficiency and demonstrable cost reductions within legal departments, thereby amplifying the demand for advanced RPA solutions. The competitive arena is continually being reshaped by ongoing innovation, the formation of strategic alliances, and the relentless refinement of RPA software functionalities. Market penetration is steadily increasing, with a pronounced uptake observed among large law firms and corporate legal departments that handle high volumes of repetitive, rule-based tasks. These trends are further reinforced by an intensified focus on regulatory compliance, which inherently demands higher levels of accuracy, speed, and auditability. Consequently, legal teams are increasingly embracing automation to effectively manage burgeoning workloads and significantly reduce operational expenditures. The deeper integration of legal technology solutions is poised to further accelerate the widespread adoption of RPA.
Dominant Markets & Segments in Robotic Process Automation In Legal Services Market
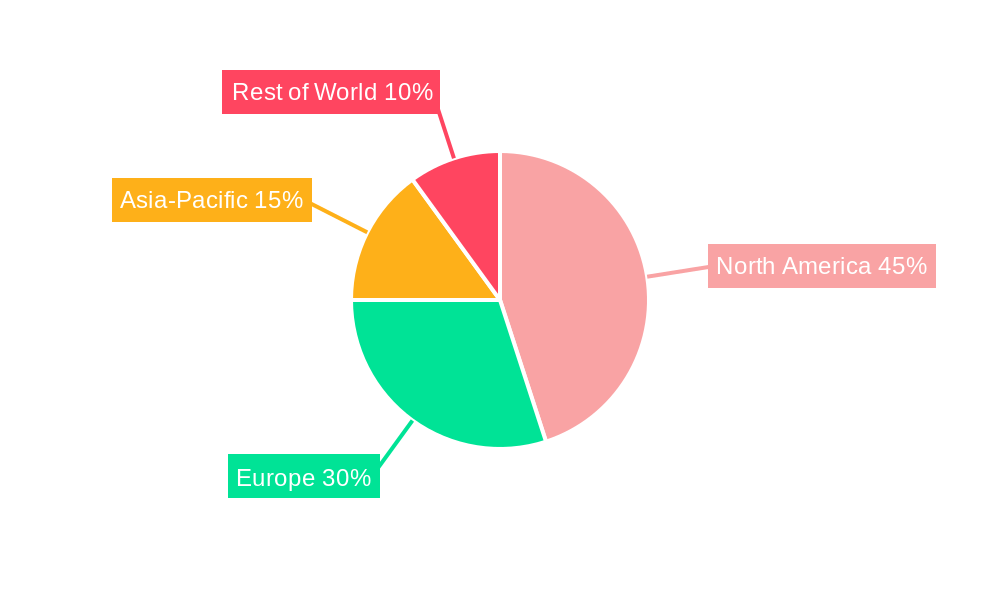
The North American region currently commands a dominant position within the RPA in Legal Services market. This leadership is underpinned by a confluence of potent factors, including a highly developed technological infrastructure, exceptionally high adoption rates among prominent law firms, and a mature, technology-welcoming regulatory environment.
- Key Drivers in North America:
- Pioneering and advanced technological infrastructure.
- A significant concentration of large, established law firms and major corporations.
- A regulatory landscape that actively encourages and supports technological innovation and adoption.
- Substantial and consistent investment in legal technology solutions.
- The strong and pervasive presence of key RPA vendors and solution providers.
- Relatively high disposable income levels, facilitating greater investment in cutting-edge technological solutions.
North America's preeminence is largely attributable to its early embrace of RPA technologies, a deep pool of skilled professionals adept at implementing and managing these solutions, and the strategic presence of major global RPA players. This robust foundation is expected to continue propelling growth and solidifying North America's leading status in the foreseeable future. Nevertheless, significant and accelerated growth is anticipated in other key regions, including Europe and the Asia-Pacific, driven by escalating technological investments and ongoing improvements in digital infrastructure. The market itself is strategically segmented by deployment type (cloud-based, on-premise), core components (software, professional services), organization size (small, medium, large enterprises), and specific application areas (document processing, contract analysis, e-discovery, and other specialized legal tasks).
Robotic Process Automation In Legal Services Market Product Innovations
Recent innovations in RPA for legal services have focused on enhanced AI capabilities, improved integration with existing legal technologies, and the development of specialized solutions for specific legal tasks. This includes improved natural language processing (NLP) for contract analysis and e-discovery, reducing processing time and improving accuracy. Enhanced security features are also critical developments, alongside integration with cloud-based services to improve scalability and accessibility. These advancements enhance efficiency and cost savings, offering significant competitive advantages in the market. The focus is on creating intuitive and user-friendly interfaces to expand adoption across diverse teams within the legal sector.
Report Segmentation & Scope
This comprehensive report meticulously segments the RPA in Legal Services market across several critical dimensions: Deployment Type (Cloud, On-Premise), Component (Software, Services), Organization Size (Small, Medium, Large), and Application (Document Processing, Contract Analysis, E-discovery, and Others). Each delineated segment undergoes thorough analysis, including detailed growth projections, current market size estimations, and an in-depth examination of competitive dynamics, collectively providing an exhaustive and holistic perspective of the market landscape. The analytical framework encompasses the current market valuation and detailed growth forecasts for each individual market segment throughout the entire study period. Furthermore, the report delivers an incisive competitive analysis, with a pronounced focus on the strategic initiatives and approaches adopted by the leading market players.
Key Drivers of Robotic Process Automation In Legal Services Market Growth
A constellation of powerful drivers is fueling the exponential growth of the Robotic Process Automation in Legal Services market. Foremost among these is the escalating imperative for enhanced efficiency and substantial cost reduction within legal operations. Secondly, ongoing advancements in AI and ML are continuously enhancing the sophistication and capabilities of RPA solutions, paving the way for the automation of increasingly complex and cognitive legal tasks. Thirdly, the sheer and continuously rising volumes of data and documents inherent in legal processes necessitate the adoption of highly efficient automation solutions. Stringent regulatory compliance requirements, which demand greater accuracy, speed, and traceability, represent another critical growth driver. Finally, the accelerating adoption of flexible and scalable cloud-based solutions is significantly improving accessibility and deployment ease for legal departments of all sizes, further propelling market expansion.
Challenges in the Robotic Process Automation In Legal Services Market Sector
Despite the positive growth trajectory, the RPA in Legal Services market faces certain challenges. High implementation costs can be a barrier to entry for smaller firms. Data security and privacy concerns remain a significant hurdle, particularly in handling sensitive legal data. The lack of skilled professionals capable of deploying and managing RPA systems presents another obstacle to wider adoption. Furthermore, resistance to change within legal organizations can slow down the adoption process. These challenges need to be addressed for the market to achieve its full potential.
Leading Players in the Robotic Process Automation In Legal Services Market Market
- UiPath
- Blue Prism
- Automation Anywhere
- Kofax
- Pegasystems
- NICE
- IBM
- WorkFusion
- EdgeVerve
- Kira Systems
Key Developments in Robotic Process Automation In Legal Services Market Sector
- July 2024: One Equity Partners (OEP) strategically invested in Comau, signaling increased investment in the broader automation sector and potentially influencing RPA development indirectly through technological synergy.
- June 2023: Expert.ai partnered with SS&C Blue Prism, integrating AI-powered language solutions with intelligent automation, enhancing RPA capabilities for legal document processing and analysis. This partnership strengthens Blue Prism's position in the legal tech space.
Strategic Robotic Process Automation In Legal Services Market Market Outlook
The future of the RPA in Legal Services market is promising, with significant growth potential driven by continued technological advancements, increasing demand for efficiency, and the expanding scope of automation in legal processes. Strategic opportunities exist for RPA vendors to focus on developing specialized solutions catering to niche areas within the legal sector, such as contract lifecycle management and e-discovery. Partnerships between RPA providers and legal technology companies will play a key role in driving market expansion. The focus on user-friendliness and simplified implementations will further broaden the adoption across legal organizations of all sizes. This growth trajectory is projected to persist throughout the forecast period, creating substantial opportunities for both established players and new entrants in the market.
Robotic Process Automation In Legal Services Market Segmentation
-
1. Deployment Mode
- 1.1. On-premise
- 1.2. Cloud
-
2. Solution
- 2.1. Software
- 2.2. Service
Robotic Process Automation In Legal Services Market Segmentation By Geography
-
1. North America
- 1.1. United States
- 1.2. Canada
- 1.3. Rest of North America
-
2. Europe
- 2.1. Germany
- 2.2. United Kingdom
- 2.3. France
- 2.4. Russia
- 2.5. Spain
- 2.6. Rest of Europe
-
3. Asia Pacific
- 3.1. India
- 3.2. China
- 3.3. Japan
- 3.4. Rest of Asia Pacific
-
4. South America
- 4.1. Brazil
- 4.2. Argentina
- 4.3. Rest of South America
-
5. Middle East and Africa
- 5.1. United Arab Emirates
- 5.2. Saudi Arabia
- 5.3. Rest of Middle East and Africa
Robotic Process Automation In Legal Services Market Regional Market Share
Geographic Coverage of Robotic Process Automation In Legal Services Market
Robotic Process Automation In Legal Services Market REPORT HIGHLIGHTS
| Aspects | Details |
|---|---|
| Study Period | 2020-2034 |
| Base Year | 2025 |
| Estimated Year | 2026 |
| Forecast Period | 2026-2034 |
| Historical Period | 2020-2025 |
| Growth Rate | CAGR of 14.65% from 2020-2034 |
| Segmentation |
|
Table of Contents
- 1. Introduction
- 1.1. Research Scope
- 1.2. Market Segmentation
- 1.3. Research Objective
- 1.4. Definitions and Assumptions
- 2. Executive Summary
- 2.1. Market Snapshot
- 3. Market Dynamics
- 3.1. Market Drivers
- 3.2. Market Restrains
- 3.3. Market Trends
- 3.4. Market Opportunities
- 4. Market Factor Analysis
- 4.1. Porters Five Forces
- 4.1.1. Bargaining Power of Suppliers
- 4.1.2. Bargaining Power of Buyers
- 4.1.3. Threat of New Entrants
- 4.1.4. Threat of Substitutes
- 4.1.5. Competitive Rivalry
- 4.2. PESTEL analysis
- 4.3. BCG Analysis
- 4.3.1. Stars (High Growth, High Market Share)
- 4.3.2. Cash Cows (Low Growth, High Market Share)
- 4.3.3. Question Mark (High Growth, Low Market Share)
- 4.3.4. Dogs (Low Growth, Low Market Share)
- 4.4. Ansoff Matrix Analysis
- 4.5. Supply Chain Analysis
- 4.6. Regulatory Landscape
- 4.7. Current Market Potential and Opportunity Assessment (TAM–SAM–SOM Framework)
- 4.8. PMV Analyst Note
- 4.1. Porters Five Forces
- 5. Market Analysis, Insights and Forecast 2021-2033
- 5.1. Market Analysis, Insights and Forecast - by Deployment Mode
- 5.1.1. On-premise
- 5.1.2. Cloud
- 5.2. Market Analysis, Insights and Forecast - by Solution
- 5.2.1. Software
- 5.2.2. Service
- 5.3. Market Analysis, Insights and Forecast - by Region
- 5.3.1. North America
- 5.3.2. Europe
- 5.3.3. Asia Pacific
- 5.3.4. South America
- 5.3.5. Middle East and Africa
- 5.1. Market Analysis, Insights and Forecast - by Deployment Mode
- 6. Global Robotic Process Automation In Legal Services Market Analysis, Insights and Forecast, 2021-2033
- 6.1. Market Analysis, Insights and Forecast - by Deployment Mode
- 6.1.1. On-premise
- 6.1.2. Cloud
- 6.2. Market Analysis, Insights and Forecast - by Solution
- 6.2.1. Software
- 6.2.2. Service
- 6.1. Market Analysis, Insights and Forecast - by Deployment Mode
- 7. North America Robotic Process Automation In Legal Services Market Analysis, Insights and Forecast, 2020-2032
- 7.1. Market Analysis, Insights and Forecast - by Deployment Mode
- 7.1.1. On-premise
- 7.1.2. Cloud
- 7.2. Market Analysis, Insights and Forecast - by Solution
- 7.2.1. Software
- 7.2.2. Service
- 7.1. Market Analysis, Insights and Forecast - by Deployment Mode
- 8. Europe Robotic Process Automation In Legal Services Market Analysis, Insights and Forecast, 2020-2032
- 8.1. Market Analysis, Insights and Forecast - by Deployment Mode
- 8.1.1. On-premise
- 8.1.2. Cloud
- 8.2. Market Analysis, Insights and Forecast - by Solution
- 8.2.1. Software
- 8.2.2. Service
- 8.1. Market Analysis, Insights and Forecast - by Deployment Mode
- 9. Asia Pacific Robotic Process Automation In Legal Services Market Analysis, Insights and Forecast, 2020-2032
- 9.1. Market Analysis, Insights and Forecast - by Deployment Mode
- 9.1.1. On-premise
- 9.1.2. Cloud
- 9.2. Market Analysis, Insights and Forecast - by Solution
- 9.2.1. Software
- 9.2.2. Service
- 9.1. Market Analysis, Insights and Forecast - by Deployment Mode
- 10. South America Robotic Process Automation In Legal Services Market Analysis, Insights and Forecast, 2020-2032
- 10.1. Market Analysis, Insights and Forecast - by Deployment Mode
- 10.1.1. On-premise
- 10.1.2. Cloud
- 10.2. Market Analysis, Insights and Forecast - by Solution
- 10.2.1. Software
- 10.2.2. Service
- 10.1. Market Analysis, Insights and Forecast - by Deployment Mode
- 11. Middle East and Africa Robotic Process Automation In Legal Services Market Analysis, Insights and Forecast, 2020-2032
- 11.1. Market Analysis, Insights and Forecast - by Deployment Mode
- 11.1.1. On-premise
- 11.1.2. Cloud
- 11.2. Market Analysis, Insights and Forecast - by Solution
- 11.2.1. Software
- 11.2.2. Service
- 11.1. Market Analysis, Insights and Forecast - by Deployment Mode
- 12. Competitive Analysis
- 12.1. Company Profiles
- 12.1.1 UiPath
- 12.1.1.1. Company Overview
- 12.1.1.2. Products
- 12.1.1.3. Company Financials
- 12.1.1.4. SWOT Analysis
- 12.1.2 Blue Prism
- 12.1.2.1. Company Overview
- 12.1.2.2. Products
- 12.1.2.3. Company Financials
- 12.1.2.4. SWOT Analysis
- 12.1.3 Automation Anywhere
- 12.1.3.1. Company Overview
- 12.1.3.2. Products
- 12.1.3.3. Company Financials
- 12.1.3.4. SWOT Analysis
- 12.1.4 Kofax
- 12.1.4.1. Company Overview
- 12.1.4.2. Products
- 12.1.4.3. Company Financials
- 12.1.4.4. SWOT Analysis
- 12.1.5 Pegasystems
- 12.1.5.1. Company Overview
- 12.1.5.2. Products
- 12.1.5.3. Company Financials
- 12.1.5.4. SWOT Analysis
- 12.1.6 NICE
- 12.1.6.1. Company Overview
- 12.1.6.2. Products
- 12.1.6.3. Company Financials
- 12.1.6.4. SWOT Analysis
- 12.1.7 IBM
- 12.1.7.1. Company Overview
- 12.1.7.2. Products
- 12.1.7.3. Company Financials
- 12.1.7.4. SWOT Analysis
- 12.1.8 WorkFusion
- 12.1.8.1. Company Overview
- 12.1.8.2. Products
- 12.1.8.3. Company Financials
- 12.1.8.4. SWOT Analysis
- 12.1.9 EdgeVerve
- 12.1.9.1. Company Overview
- 12.1.9.2. Products
- 12.1.9.3. Company Financials
- 12.1.9.4. SWOT Analysis
- 12.1.10 Kira Systems**List Not Exhaustive
- 12.1.10.1. Company Overview
- 12.1.10.2. Products
- 12.1.10.3. Company Financials
- 12.1.10.4. SWOT Analysis
- 12.1.1 UiPath
- 12.2. Market Entropy
- 12.2.1 Company's Key Areas Served
- 12.2.2 Recent Developments
- 12.3. Company Market Share Analysis 2025
- 12.3.1 Top 5 Companies Market Share Analysis
- 12.3.2 Top 3 Companies Market Share Analysis
- 12.4. List of Potential Customers
- 13. Research Methodology
List of Figures
- Figure 1: Global Robotic Process Automation In Legal Services Market Revenue Breakdown (Million, %) by Region 2025 & 2033
- Figure 2: Global Robotic Process Automation In Legal Services Market Volume Breakdown (Billion, %) by Region 2025 & 2033
- Figure 3: North America Robotic Process Automation In Legal Services Market Revenue (Million), by Deployment Mode 2025 & 2033
- Figure 4: North America Robotic Process Automation In Legal Services Market Volume (Billion), by Deployment Mode 2025 & 2033
- Figure 5: North America Robotic Process Automation In Legal Services Market Revenue Share (%), by Deployment Mode 2025 & 2033
- Figure 6: North America Robotic Process Automation In Legal Services Market Volume Share (%), by Deployment Mode 2025 & 2033
- Figure 7: North America Robotic Process Automation In Legal Services Market Revenue (Million), by Solution 2025 & 2033
- Figure 8: North America Robotic Process Automation In Legal Services Market Volume (Billion), by Solution 2025 & 2033
- Figure 9: North America Robotic Process Automation In Legal Services Market Revenue Share (%), by Solution 2025 & 2033
- Figure 10: North America Robotic Process Automation In Legal Services Market Volume Share (%), by Solution 2025 & 2033
- Figure 11: North America Robotic Process Automation In Legal Services Market Revenue (Million), by Country 2025 & 2033
- Figure 12: North America Robotic Process Automation In Legal Services Market Volume (Billion), by Country 2025 & 2033
- Figure 13: North America Robotic Process Automation In Legal Services Market Revenue Share (%), by Country 2025 & 2033
- Figure 14: North America Robotic Process Automation In Legal Services Market Volume Share (%), by Country 2025 & 2033
- Figure 15: Europe Robotic Process Automation In Legal Services Market Revenue (Million), by Deployment Mode 2025 & 2033
- Figure 16: Europe Robotic Process Automation In Legal Services Market Volume (Billion), by Deployment Mode 2025 & 2033
- Figure 17: Europe Robotic Process Automation In Legal Services Market Revenue Share (%), by Deployment Mode 2025 & 2033
- Figure 18: Europe Robotic Process Automation In Legal Services Market Volume Share (%), by Deployment Mode 2025 & 2033
- Figure 19: Europe Robotic Process Automation In Legal Services Market Revenue (Million), by Solution 2025 & 2033
- Figure 20: Europe Robotic Process Automation In Legal Services Market Volume (Billion), by Solution 2025 & 2033
- Figure 21: Europe Robotic Process Automation In Legal Services Market Revenue Share (%), by Solution 2025 & 2033
- Figure 22: Europe Robotic Process Automation In Legal Services Market Volume Share (%), by Solution 2025 & 2033
- Figure 23: Europe Robotic Process Automation In Legal Services Market Revenue (Million), by Country 2025 & 2033
- Figure 24: Europe Robotic Process Automation In Legal Services Market Volume (Billion), by Country 2025 & 2033
- Figure 25: Europe Robotic Process Automation In Legal Services Market Revenue Share (%), by Country 2025 & 2033
- Figure 26: Europe Robotic Process Automation In Legal Services Market Volume Share (%), by Country 2025 & 2033
- Figure 27: Asia Pacific Robotic Process Automation In Legal Services Market Revenue (Million), by Deployment Mode 2025 & 2033
- Figure 28: Asia Pacific Robotic Process Automation In Legal Services Market Volume (Billion), by Deployment Mode 2025 & 2033
- Figure 29: Asia Pacific Robotic Process Automation In Legal Services Market Revenue Share (%), by Deployment Mode 2025 & 2033
- Figure 30: Asia Pacific Robotic Process Automation In Legal Services Market Volume Share (%), by Deployment Mode 2025 & 2033
- Figure 31: Asia Pacific Robotic Process Automation In Legal Services Market Revenue (Million), by Solution 2025 & 2033
- Figure 32: Asia Pacific Robotic Process Automation In Legal Services Market Volume (Billion), by Solution 2025 & 2033
- Figure 33: Asia Pacific Robotic Process Automation In Legal Services Market Revenue Share (%), by Solution 2025 & 2033
- Figure 34: Asia Pacific Robotic Process Automation In Legal Services Market Volume Share (%), by Solution 2025 & 2033
- Figure 35: Asia Pacific Robotic Process Automation In Legal Services Market Revenue (Million), by Country 2025 & 2033
- Figure 36: Asia Pacific Robotic Process Automation In Legal Services Market Volume (Billion), by Country 2025 & 2033
- Figure 37: Asia Pacific Robotic Process Automation In Legal Services Market Revenue Share (%), by Country 2025 & 2033
- Figure 38: Asia Pacific Robotic Process Automation In Legal Services Market Volume Share (%), by Country 2025 & 2033
- Figure 39: South America Robotic Process Automation In Legal Services Market Revenue (Million), by Deployment Mode 2025 & 2033
- Figure 40: South America Robotic Process Automation In Legal Services Market Volume (Billion), by Deployment Mode 2025 & 2033
- Figure 41: South America Robotic Process Automation In Legal Services Market Revenue Share (%), by Deployment Mode 2025 & 2033
- Figure 42: South America Robotic Process Automation In Legal Services Market Volume Share (%), by Deployment Mode 2025 & 2033
- Figure 43: South America Robotic Process Automation In Legal Services Market Revenue (Million), by Solution 2025 & 2033
- Figure 44: South America Robotic Process Automation In Legal Services Market Volume (Billion), by Solution 2025 & 2033
- Figure 45: South America Robotic Process Automation In Legal Services Market Revenue Share (%), by Solution 2025 & 2033
- Figure 46: South America Robotic Process Automation In Legal Services Market Volume Share (%), by Solution 2025 & 2033
- Figure 47: South America Robotic Process Automation In Legal Services Market Revenue (Million), by Country 2025 & 2033
- Figure 48: South America Robotic Process Automation In Legal Services Market Volume (Billion), by Country 2025 & 2033
- Figure 49: South America Robotic Process Automation In Legal Services Market Revenue Share (%), by Country 2025 & 2033
- Figure 50: South America Robotic Process Automation In Legal Services Market Volume Share (%), by Country 2025 & 2033
- Figure 51: Middle East and Africa Robotic Process Automation In Legal Services Market Revenue (Million), by Deployment Mode 2025 & 2033
- Figure 52: Middle East and Africa Robotic Process Automation In Legal Services Market Volume (Billion), by Deployment Mode 2025 & 2033
- Figure 53: Middle East and Africa Robotic Process Automation In Legal Services Market Revenue Share (%), by Deployment Mode 2025 & 2033
- Figure 54: Middle East and Africa Robotic Process Automation In Legal Services Market Volume Share (%), by Deployment Mode 2025 & 2033
- Figure 55: Middle East and Africa Robotic Process Automation In Legal Services Market Revenue (Million), by Solution 2025 & 2033
- Figure 56: Middle East and Africa Robotic Process Automation In Legal Services Market Volume (Billion), by Solution 2025 & 2033
- Figure 57: Middle East and Africa Robotic Process Automation In Legal Services Market Revenue Share (%), by Solution 2025 & 2033
- Figure 58: Middle East and Africa Robotic Process Automation In Legal Services Market Volume Share (%), by Solution 2025 & 2033
- Figure 59: Middle East and Africa Robotic Process Automation In Legal Services Market Revenue (Million), by Country 2025 & 2033
- Figure 60: Middle East and Africa Robotic Process Automation In Legal Services Market Volume (Billion), by Country 2025 & 2033
- Figure 61: Middle East and Africa Robotic Process Automation In Legal Services Market Revenue Share (%), by Country 2025 & 2033
- Figure 62: Middle East and Africa Robotic Process Automation In Legal Services Market Volume Share (%), by Country 2025 & 2033
List of Tables
- Table 1: Global Robotic Process Automation In Legal Services Market Revenue Million Forecast, by Deployment Mode 2020 & 2033
- Table 2: Global Robotic Process Automation In Legal Services Market Volume Billion Forecast, by Deployment Mode 2020 & 2033
- Table 3: Global Robotic Process Automation In Legal Services Market Revenue Million Forecast, by Solution 2020 & 2033
- Table 4: Global Robotic Process Automation In Legal Services Market Volume Billion Forecast, by Solution 2020 & 2033
- Table 5: Global Robotic Process Automation In Legal Services Market Revenue Million Forecast, by Region 2020 & 2033
- Table 6: Global Robotic Process Automation In Legal Services Market Volume Billion Forecast, by Region 2020 & 2033
- Table 7: Global Robotic Process Automation In Legal Services Market Revenue Million Forecast, by Deployment Mode 2020 & 2033
- Table 8: Global Robotic Process Automation In Legal Services Market Volume Billion Forecast, by Deployment Mode 2020 & 2033
- Table 9: Global Robotic Process Automation In Legal Services Market Revenue Million Forecast, by Solution 2020 & 2033
- Table 10: Global Robotic Process Automation In Legal Services Market Volume Billion Forecast, by Solution 2020 & 2033
- Table 11: Global Robotic Process Automation In Legal Services Market Revenue Million Forecast, by Country 2020 & 2033
- Table 12: Global Robotic Process Automation In Legal Services Market Volume Billion Forecast, by Country 2020 & 2033
- Table 13: United States Robotic Process Automation In Legal Services Market Revenue (Million) Forecast, by Application 2020 & 2033
- Table 14: United States Robotic Process Automation In Legal Services Market Volume (Billion) Forecast, by Application 2020 & 2033
- Table 15: Canada Robotic Process Automation In Legal Services Market Revenue (Million) Forecast, by Application 2020 & 2033
- Table 16: Canada Robotic Process Automation In Legal Services Market Volume (Billion) Forecast, by Application 2020 & 2033
- Table 17: Rest of North America Robotic Process Automation In Legal Services Market Revenue (Million) Forecast, by Application 2020 & 2033
- Table 18: Rest of North America Robotic Process Automation In Legal Services Market Volume (Billion) Forecast, by Application 2020 & 2033
- Table 19: Global Robotic Process Automation In Legal Services Market Revenue Million Forecast, by Deployment Mode 2020 & 2033
- Table 20: Global Robotic Process Automation In Legal Services Market Volume Billion Forecast, by Deployment Mode 2020 & 2033
- Table 21: Global Robotic Process Automation In Legal Services Market Revenue Million Forecast, by Solution 2020 & 2033
- Table 22: Global Robotic Process Automation In Legal Services Market Volume Billion Forecast, by Solution 2020 & 2033
- Table 23: Global Robotic Process Automation In Legal Services Market Revenue Million Forecast, by Country 2020 & 2033
- Table 24: Global Robotic Process Automation In Legal Services Market Volume Billion Forecast, by Country 2020 & 2033
- Table 25: Germany Robotic Process Automation In Legal Services Market Revenue (Million) Forecast, by Application 2020 & 2033
- Table 26: Germany Robotic Process Automation In Legal Services Market Volume (Billion) Forecast, by Application 2020 & 2033
- Table 27: United Kingdom Robotic Process Automation In Legal Services Market Revenue (Million) Forecast, by Application 2020 & 2033
- Table 28: United Kingdom Robotic Process Automation In Legal Services Market Volume (Billion) Forecast, by Application 2020 & 2033
- Table 29: France Robotic Process Automation In Legal Services Market Revenue (Million) Forecast, by Application 2020 & 2033
- Table 30: France Robotic Process Automation In Legal Services Market Volume (Billion) Forecast, by Application 2020 & 2033
- Table 31: Russia Robotic Process Automation In Legal Services Market Revenue (Million) Forecast, by Application 2020 & 2033
- Table 32: Russia Robotic Process Automation In Legal Services Market Volume (Billion) Forecast, by Application 2020 & 2033
- Table 33: Spain Robotic Process Automation In Legal Services Market Revenue (Million) Forecast, by Application 2020 & 2033
- Table 34: Spain Robotic Process Automation In Legal Services Market Volume (Billion) Forecast, by Application 2020 & 2033
- Table 35: Rest of Europe Robotic Process Automation In Legal Services Market Revenue (Million) Forecast, by Application 2020 & 2033
- Table 36: Rest of Europe Robotic Process Automation In Legal Services Market Volume (Billion) Forecast, by Application 2020 & 2033
- Table 37: Global Robotic Process Automation In Legal Services Market Revenue Million Forecast, by Deployment Mode 2020 & 2033
- Table 38: Global Robotic Process Automation In Legal Services Market Volume Billion Forecast, by Deployment Mode 2020 & 2033
- Table 39: Global Robotic Process Automation In Legal Services Market Revenue Million Forecast, by Solution 2020 & 2033
- Table 40: Global Robotic Process Automation In Legal Services Market Volume Billion Forecast, by Solution 2020 & 2033
- Table 41: Global Robotic Process Automation In Legal Services Market Revenue Million Forecast, by Country 2020 & 2033
- Table 42: Global Robotic Process Automation In Legal Services Market Volume Billion Forecast, by Country 2020 & 2033
- Table 43: India Robotic Process Automation In Legal Services Market Revenue (Million) Forecast, by Application 2020 & 2033
- Table 44: India Robotic Process Automation In Legal Services Market Volume (Billion) Forecast, by Application 2020 & 2033
- Table 45: China Robotic Process Automation In Legal Services Market Revenue (Million) Forecast, by Application 2020 & 2033
- Table 46: China Robotic Process Automation In Legal Services Market Volume (Billion) Forecast, by Application 2020 & 2033
- Table 47: Japan Robotic Process Automation In Legal Services Market Revenue (Million) Forecast, by Application 2020 & 2033
- Table 48: Japan Robotic Process Automation In Legal Services Market Volume (Billion) Forecast, by Application 2020 & 2033
- Table 49: Rest of Asia Pacific Robotic Process Automation In Legal Services Market Revenue (Million) Forecast, by Application 2020 & 2033
- Table 50: Rest of Asia Pacific Robotic Process Automation In Legal Services Market Volume (Billion) Forecast, by Application 2020 & 2033
- Table 51: Global Robotic Process Automation In Legal Services Market Revenue Million Forecast, by Deployment Mode 2020 & 2033
- Table 52: Global Robotic Process Automation In Legal Services Market Volume Billion Forecast, by Deployment Mode 2020 & 2033
- Table 53: Global Robotic Process Automation In Legal Services Market Revenue Million Forecast, by Solution 2020 & 2033
- Table 54: Global Robotic Process Automation In Legal Services Market Volume Billion Forecast, by Solution 2020 & 2033
- Table 55: Global Robotic Process Automation In Legal Services Market Revenue Million Forecast, by Country 2020 & 2033
- Table 56: Global Robotic Process Automation In Legal Services Market Volume Billion Forecast, by Country 2020 & 2033
- Table 57: Brazil Robotic Process Automation In Legal Services Market Revenue (Million) Forecast, by Application 2020 & 2033
- Table 58: Brazil Robotic Process Automation In Legal Services Market Volume (Billion) Forecast, by Application 2020 & 2033
- Table 59: Argentina Robotic Process Automation In Legal Services Market Revenue (Million) Forecast, by Application 2020 & 2033
- Table 60: Argentina Robotic Process Automation In Legal Services Market Volume (Billion) Forecast, by Application 2020 & 2033
- Table 61: Rest of South America Robotic Process Automation In Legal Services Market Revenue (Million) Forecast, by Application 2020 & 2033
- Table 62: Rest of South America Robotic Process Automation In Legal Services Market Volume (Billion) Forecast, by Application 2020 & 2033
- Table 63: Global Robotic Process Automation In Legal Services Market Revenue Million Forecast, by Deployment Mode 2020 & 2033
- Table 64: Global Robotic Process Automation In Legal Services Market Volume Billion Forecast, by Deployment Mode 2020 & 2033
- Table 65: Global Robotic Process Automation In Legal Services Market Revenue Million Forecast, by Solution 2020 & 2033
- Table 66: Global Robotic Process Automation In Legal Services Market Volume Billion Forecast, by Solution 2020 & 2033
- Table 67: Global Robotic Process Automation In Legal Services Market Revenue Million Forecast, by Country 2020 & 2033
- Table 68: Global Robotic Process Automation In Legal Services Market Volume Billion Forecast, by Country 2020 & 2033
- Table 69: United Arab Emirates Robotic Process Automation In Legal Services Market Revenue (Million) Forecast, by Application 2020 & 2033
- Table 70: United Arab Emirates Robotic Process Automation In Legal Services Market Volume (Billion) Forecast, by Application 2020 & 2033
- Table 71: Saudi Arabia Robotic Process Automation In Legal Services Market Revenue (Million) Forecast, by Application 2020 & 2033
- Table 72: Saudi Arabia Robotic Process Automation In Legal Services Market Volume (Billion) Forecast, by Application 2020 & 2033
- Table 73: Rest of Middle East and Africa Robotic Process Automation In Legal Services Market Revenue (Million) Forecast, by Application 2020 & 2033
- Table 74: Rest of Middle East and Africa Robotic Process Automation In Legal Services Market Volume (Billion) Forecast, by Application 2020 & 2033
Frequently Asked Questions
1. What is the projected Compound Annual Growth Rate (CAGR) of the Robotic Process Automation In Legal Services Market?
The projected CAGR is approximately 14.65%.
2. Which companies are prominent players in the Robotic Process Automation In Legal Services Market?
Key companies in the market include UiPath, Blue Prism, Automation Anywhere, Kofax, Pegasystems, NICE, IBM, WorkFusion, EdgeVerve, Kira Systems**List Not Exhaustive.
3. What are the main segments of the Robotic Process Automation In Legal Services Market?
The market segments include Deployment Mode , Solution.
4. Can you provide details about the market size?
The market size is estimated to be USD 1.63 Million as of 2022.
5. What are some drivers contributing to market growth?
Digital Transformation Initiatives is Driving the Market.
6. What are the notable trends driving market growth?
Rise in Software Technology.
7. Are there any restraints impacting market growth?
Digital Transformation Initiatives is Driving the Market.
8. Can you provide examples of recent developments in the market?
July 2024: One Equity Partners (OEP) strategically invested in Comau, an Italian industrial automation and advanced robotics leader. This move positions OEP as Comau's majority shareholder while Stellantis retains its role as an active minority shareholder.June 2023: Expert.ai, the industry leader in providing AI-powered language solutions to enterprises, partnered with SS&C Blue Prism’s intelligent automation platform.
9. What pricing options are available for accessing the report?
Pricing options include single-user, multi-user, and enterprise licenses priced at USD 4750, USD 5250, and USD 8750 respectively.
10. Is the market size provided in terms of value or volume?
The market size is provided in terms of value, measured in Million and volume, measured in Billion.
11. Are there any specific market keywords associated with the report?
Yes, the market keyword associated with the report is "Robotic Process Automation In Legal Services Market," which aids in identifying and referencing the specific market segment covered.
12. How do I determine which pricing option suits my needs best?
The pricing options vary based on user requirements and access needs. Individual users may opt for single-user licenses, while businesses requiring broader access may choose multi-user or enterprise licenses for cost-effective access to the report.
13. Are there any additional resources or data provided in the Robotic Process Automation In Legal Services Market report?
While the report offers comprehensive insights, it's advisable to review the specific contents or supplementary materials provided to ascertain if additional resources or data are available.
14. How can I stay updated on further developments or reports in the Robotic Process Automation In Legal Services Market?
To stay informed about further developments, trends, and reports in the Robotic Process Automation In Legal Services Market, consider subscribing to industry newsletters, following relevant companies and organizations, or regularly checking reputable industry news sources and publications.
Methodology
Step 1 - Identification of Relevant Samples Size from Population Database


Step 2 - Approaches for Defining Global Market Size (Value, Volume* & Price*)

Note*: In applicable scenarios
Step 3 - Data Sources
Primary Research
- Web Analytics
- Survey Reports
- Research Institute
- Latest Research Reports
- Opinion Leaders
Secondary Research
- Annual Reports
- White Paper
- Latest Press Release
- Industry Association
- Paid Database
- Investor Presentations

Step 4 - Data Triangulation
Involves using different sources of information in order to increase the validity of a study
These sources are likely to be stakeholders in a program - participants, other researchers, program staff, other community members, and so on.
Then we put all data in single framework & apply various statistical tools to find out the dynamic on the market.
During the analysis stage, feedback from the stakeholder groups would be compared to determine areas of agreement as well as areas of divergence