

Key Insights
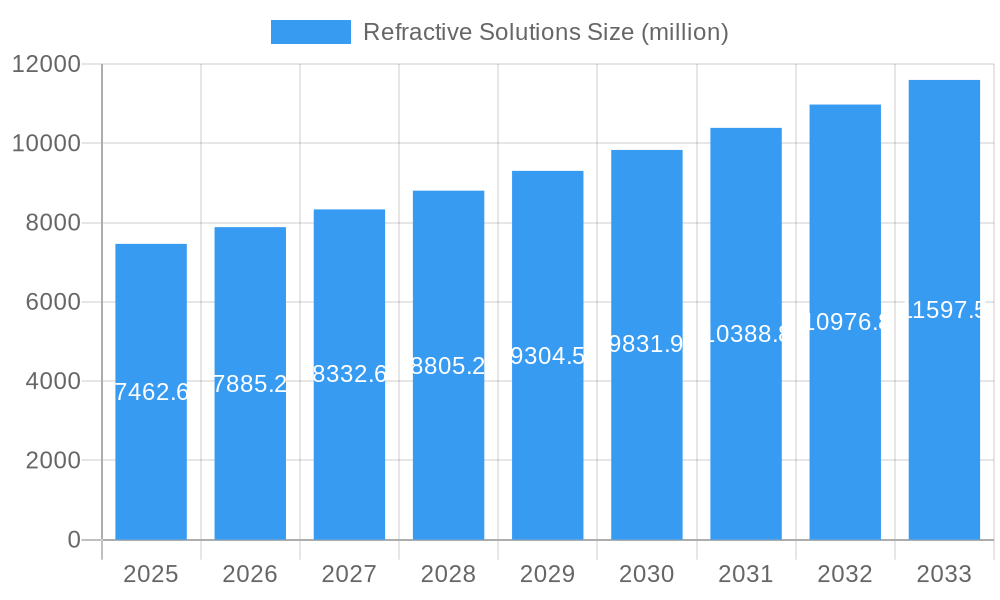
The global refractive solutions market, valued at $7,462.6 million in 2025, is projected to experience robust growth, driven by several key factors. The increasing prevalence of refractive errors like myopia, hyperopia, and astigmatism, particularly in rapidly developing economies with rising urbanization and increased screen time, fuels demand for corrective solutions. Technological advancements in refractive surgery techniques, such as LASIK, SMILE, and refractive lens exchange (RLE), offering improved precision, faster recovery times, and reduced complications, significantly contribute to market expansion. Furthermore, the growing adoption of advanced intraocular lenses (IOLs) for cataract surgery, incorporating features like astigmatism correction and accommodating vision, represents a significant market driver. The market is also witnessing a shift towards minimally invasive procedures and personalized treatment approaches based on individual patient needs. Competitive intensity is high, with established players like Alcon, Abbott (AMO), and Bausch + Lomb alongside several innovative companies constantly striving for market share through product innovation and strategic partnerships.
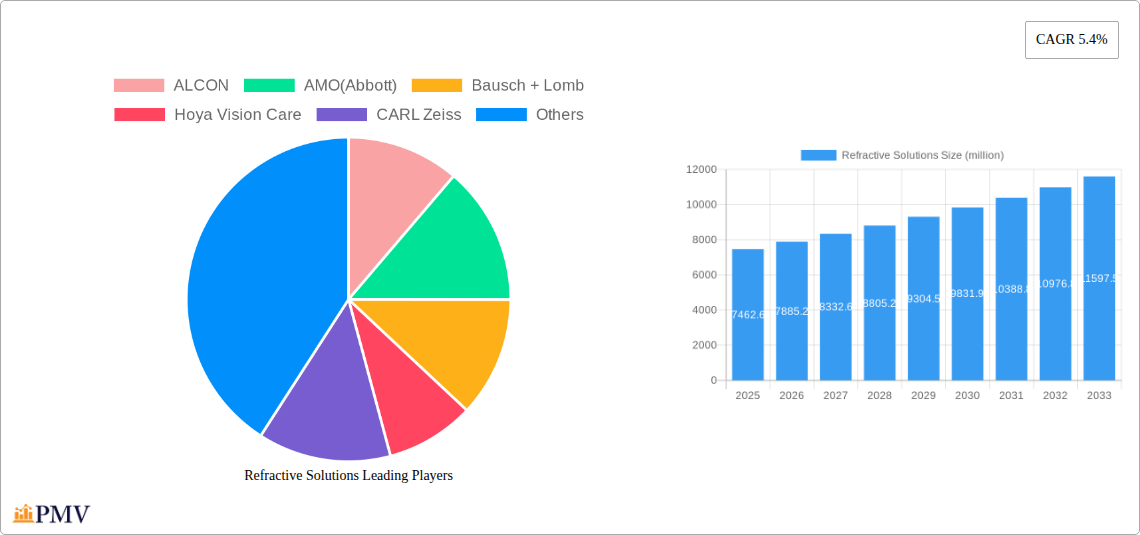
Refractive Solutions Market Size (In Billion)
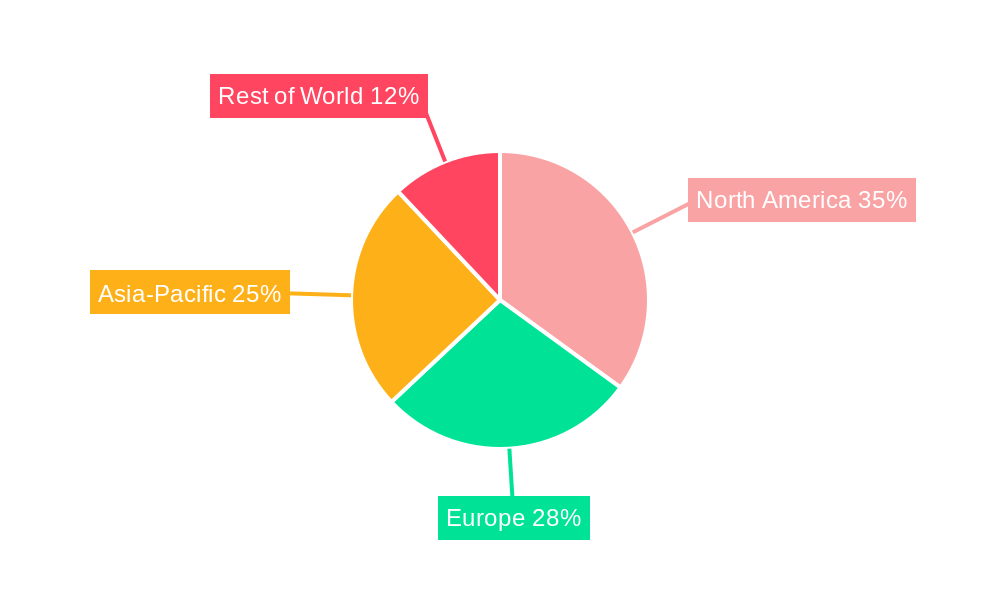
Despite the positive outlook, the market faces certain challenges. High procedure costs associated with refractive surgeries can limit accessibility, particularly in developing countries. The potential for complications and side effects, though rare, remains a concern for some patients, impacting market adoption. Regulatory hurdles and reimbursement policies in various regions also influence market penetration. However, ongoing research and development efforts focused on improving safety profiles, reducing procedure costs, and expanding treatment options are likely to mitigate these restraints. The market segmentation is likely diverse, encompassing various surgical techniques, lens types, and geographical regions, with North America and Europe currently holding significant market shares, while Asia-Pacific is expected to show substantial future growth due to increasing awareness and affordability. The projected CAGR of 5.4% from 2025 to 2033 indicates a sustained period of growth, promising significant market expansion in the coming years.
Refractive Solutions Company Market Share
Refractive Solutions Market Report: 2019-2033
This comprehensive report provides an in-depth analysis of the global refractive solutions market, offering invaluable insights for stakeholders across the ophthalmic industry. Spanning the period from 2019 to 2033, with a base year of 2025 and a forecast period from 2025 to 2033, this report meticulously examines market structure, competitive dynamics, technological advancements, and future growth prospects. The market is projected to reach a value of $XX million by 2033, representing a significant growth opportunity.
Refractive Solutions Market Structure & Competitive Dynamics
This section analyzes the competitive landscape of the refractive solutions market, evaluating market concentration, innovation ecosystems, regulatory frameworks, product substitutes, end-user trends, and mergers and acquisitions (M&A) activities. The market is characterized by a moderately concentrated structure with key players holding significant market share. For instance, Alcon and Abbott are expected to hold a combined market share of approximately xx% in 2025. The market exhibits a dynamic innovation ecosystem, with continuous advancements in refractive surgery techniques and intraocular lens (IOL) technology driving growth. Regulatory frameworks, varying across geographies, significantly influence market access and adoption. The presence of substitute treatments like spectacles and contact lenses impacts market penetration. End-user trends, such as an increasing preference for minimally invasive procedures and improved cosmetic outcomes, are shaping market demand. Over the historical period (2019-2024), M&A activity was substantial, with a total deal value exceeding $xx million. Several smaller players have also participated in strategic partnerships to expand their product portfolio and market reach.
- Market Concentration: Moderately concentrated, with top players holding xx% of the market share.
- Innovation: Continuous advancements in surgical techniques and IOL technology.
- Regulatory Landscape: Varying across regions, influencing market access.
- M&A Activity (2019-2024): Total deal value exceeding $xx million.
Refractive Solutions Industry Trends & Insights
The refractive solutions market is experiencing robust growth, driven by several key factors. The aging global population, coupled with an increasing prevalence of refractive errors, significantly fuels market expansion. Technological advancements, including the development of premium IOLs offering improved visual acuity and reduced dependence on spectacles, further contribute to market growth. Consumer preferences are shifting towards minimally invasive procedures, with a focus on faster recovery times and improved cosmetic outcomes. The market witnesses intensified competition among established players and emerging companies, spurring innovation and price pressures. The Compound Annual Growth Rate (CAGR) during the forecast period (2025-2033) is estimated at xx%, resulting in market penetration of approximately xx% by 2033. Market growth is influenced by factors like economic conditions, healthcare infrastructure and affordability.
Dominant Markets & Segments in Refractive Solutions
The North American region is currently the dominant market for refractive solutions, driven by factors such as high healthcare expenditure, advanced medical infrastructure, and a substantial elderly population. Strong economic conditions and favorable regulatory policies are other key drivers. Within North America, the United States holds the largest market share due to factors like high disposable income, and widespread adoption of advanced surgical techniques. Other significant markets include Europe and Asia-Pacific, experiencing robust growth owing to rising prevalence of refractive errors, increasing disposable income and improving healthcare infrastructure.
- North America: High healthcare expenditure, advanced infrastructure, aging population.
- Europe: Growing prevalence of refractive errors, improving healthcare infrastructure.
- Asia-Pacific: Rapid economic growth, increasing disposable income, rising awareness.
Refractive Solutions Product Innovations
Recent years have witnessed significant advancements in refractive solutions, including the introduction of multifocal and toric IOLs, providing superior visual outcomes compared to traditional monofocal lenses. Technological innovations in laser refractive surgery, such as femtosecond laser-assisted LASIK, have improved precision and reduced recovery times. These innovations cater to evolving consumer preferences for minimally invasive procedures and enhanced visual results, fueling market growth. These improvements have increased competition, driving down costs and expanding access.
Report Segmentation & Scope
This report segments the refractive solutions market based on product type (e.g., IOLs, laser refractive surgery systems, other), application (e.g., myopia, hyperopia, astigmatism, presbyopia), and geography (North America, Europe, Asia-Pacific, Rest of World). Each segment’s growth projections, market sizes, and competitive dynamics are analyzed in detail. Growth in each segment varies, with IOLs consistently representing a dominant share of the market. The forecast indicates continued growth across all segments during the forecast period.
Key Drivers of Refractive Solutions Growth
Several factors drive the growth of the refractive solutions market. The increasing prevalence of refractive errors globally, driven by lifestyle changes and increased screen time, is a primary driver. Technological advancements leading to more precise and effective treatments, such as advanced IOLs and laser systems, significantly contribute to market expansion. Favorable regulatory environments in many countries, fostering innovation and market access, also support growth. Growing disposable incomes, especially in emerging economies, enhance affordability and access to these advanced treatments.
Challenges in the Refractive Solutions Sector
The refractive solutions market faces several challenges. Stringent regulatory approvals, particularly for new devices and procedures, can delay market entry and increase costs. Supply chain disruptions and fluctuations in raw material prices can impact production and profitability. Intense competition among established players and emerging companies creates pricing pressures and necessitates continuous innovation to maintain market share. The lack of affordability in developing nations can further limit market growth. These factors combined can influence the overall market projections and require careful strategic navigation for players.
Leading Players in the Refractive Solutions Market
- Alcon
- AMO (Abbott)
- Bausch + Lomb
- Hoya Vision Care
- CARL Zeiss
- Ophtec
- Rayner
- STAAR
- Lenstec
- HumanOptics
- Biotech Visioncare
- Aurolab
- SAV-IOL
- Eagle Optics
- SIFI Medtech
- Physiol
- Eyebright Medical Technology
Key Developments in Refractive Solutions Sector
- 2022 Q4: Alcon launched a new line of premium IOLs.
- 2023 Q1: Abbott announced a strategic partnership with a leading ophthalmic clinic chain.
- 2023 Q2: Bausch + Lomb secured FDA approval for a new laser refractive surgery system.
- (Further developments to be added based on available data)
Strategic Refractive Solutions Market Outlook
The refractive solutions market presents significant growth opportunities for companies that can leverage technological advancements, cater to evolving consumer preferences, and navigate regulatory landscapes effectively. Strategic partnerships, focusing on research and development, expansion into emerging markets, and targeted product diversification will be essential for capturing market share. The continued innovation in premium IOLs and minimally invasive surgical techniques will shape the market’s trajectory in the coming years, resulting in higher market value, broadened market access and improved visual outcomes for patients.
Refractive Solutions Segmentation
-
1. Application
- 1.1. Myopia
- 1.2. Hyperopia
- 1.3. Astigmatism
-
2. Types
- 2.1. Femtosecond Lasers
- 2.2. Excimer Lasers
- 2.3. Others
Refractive Solutions Segmentation By Geography
-
1. North America
- 1.1. United States
- 1.2. Canada
- 1.3. Mexico
-
2. South America
- 2.1. Brazil
- 2.2. Argentina
- 2.3. Rest of South America
-
3. Europe
- 3.1. United Kingdom
- 3.2. Germany
- 3.3. France
- 3.4. Italy
- 3.5. Spain
- 3.6. Russia
- 3.7. Benelux
- 3.8. Nordics
- 3.9. Rest of Europe
-
4. Middle East & Africa
- 4.1. Turkey
- 4.2. Israel
- 4.3. GCC
- 4.4. North Africa
- 4.5. South Africa
- 4.6. Rest of Middle East & Africa
-
5. Asia Pacific
- 5.1. China
- 5.2. India
- 5.3. Japan
- 5.4. South Korea
- 5.5. ASEAN
- 5.6. Oceania
- 5.7. Rest of Asia Pacific
Refractive Solutions Regional Market Share
Geographic Coverage of Refractive Solutions
Refractive Solutions REPORT HIGHLIGHTS
| Aspects | Details |
|---|---|
| Study Period | 2020-2034 |
| Base Year | 2025 |
| Estimated Year | 2026 |
| Forecast Period | 2026-2034 |
| Historical Period | 2020-2025 |
| Growth Rate | CAGR of 5.4% from 2020-2034 |
| Segmentation |
|
Table of Contents
- 1. Introduction
- 1.1. Research Scope
- 1.2. Market Segmentation
- 1.3. Research Objective
- 1.4. Definitions and Assumptions
- 2. Executive Summary
- 2.1. Market Snapshot
- 3. Market Dynamics
- 3.1. Market Drivers
- 3.2. Market Restrains
- 3.3. Market Trends
- 3.4. Market Opportunities
- 4. Market Factor Analysis
- 4.1. Porters Five Forces
- 4.1.1. Bargaining Power of Suppliers
- 4.1.2. Bargaining Power of Buyers
- 4.1.3. Threat of New Entrants
- 4.1.4. Threat of Substitutes
- 4.1.5. Competitive Rivalry
- 4.2. PESTEL analysis
- 4.3. BCG Analysis
- 4.3.1. Stars (High Growth, High Market Share)
- 4.3.2. Cash Cows (Low Growth, High Market Share)
- 4.3.3. Question Mark (High Growth, Low Market Share)
- 4.3.4. Dogs (Low Growth, Low Market Share)
- 4.4. Ansoff Matrix Analysis
- 4.5. Supply Chain Analysis
- 4.6. Regulatory Landscape
- 4.7. Current Market Potential and Opportunity Assessment (TAM–SAM–SOM Framework)
- 4.8. PMV Analyst Note
- 4.1. Porters Five Forces
- 5. Market Analysis, Insights and Forecast 2021-2033
- 5.1. Market Analysis, Insights and Forecast - by Application
- 5.1.1. Myopia
- 5.1.2. Hyperopia
- 5.1.3. Astigmatism
- 5.2. Market Analysis, Insights and Forecast - by Types
- 5.2.1. Femtosecond Lasers
- 5.2.2. Excimer Lasers
- 5.2.3. Others
- 5.3. Market Analysis, Insights and Forecast - by Region
- 5.3.1. North America
- 5.3.2. South America
- 5.3.3. Europe
- 5.3.4. Middle East & Africa
- 5.3.5. Asia Pacific
- 5.1. Market Analysis, Insights and Forecast - by Application
- 6. Global Refractive Solutions Analysis, Insights and Forecast, 2021-2033
- 6.1. Market Analysis, Insights and Forecast - by Application
- 6.1.1. Myopia
- 6.1.2. Hyperopia
- 6.1.3. Astigmatism
- 6.2. Market Analysis, Insights and Forecast - by Types
- 6.2.1. Femtosecond Lasers
- 6.2.2. Excimer Lasers
- 6.2.3. Others
- 6.1. Market Analysis, Insights and Forecast - by Application
- 7. North America Refractive Solutions Analysis, Insights and Forecast, 2020-2032
- 7.1. Market Analysis, Insights and Forecast - by Application
- 7.1.1. Myopia
- 7.1.2. Hyperopia
- 7.1.3. Astigmatism
- 7.2. Market Analysis, Insights and Forecast - by Types
- 7.2.1. Femtosecond Lasers
- 7.2.2. Excimer Lasers
- 7.2.3. Others
- 7.1. Market Analysis, Insights and Forecast - by Application
- 8. South America Refractive Solutions Analysis, Insights and Forecast, 2020-2032
- 8.1. Market Analysis, Insights and Forecast - by Application
- 8.1.1. Myopia
- 8.1.2. Hyperopia
- 8.1.3. Astigmatism
- 8.2. Market Analysis, Insights and Forecast - by Types
- 8.2.1. Femtosecond Lasers
- 8.2.2. Excimer Lasers
- 8.2.3. Others
- 8.1. Market Analysis, Insights and Forecast - by Application
- 9. Europe Refractive Solutions Analysis, Insights and Forecast, 2020-2032
- 9.1. Market Analysis, Insights and Forecast - by Application
- 9.1.1. Myopia
- 9.1.2. Hyperopia
- 9.1.3. Astigmatism
- 9.2. Market Analysis, Insights and Forecast - by Types
- 9.2.1. Femtosecond Lasers
- 9.2.2. Excimer Lasers
- 9.2.3. Others
- 9.1. Market Analysis, Insights and Forecast - by Application
- 10. Middle East & Africa Refractive Solutions Analysis, Insights and Forecast, 2020-2032
- 10.1. Market Analysis, Insights and Forecast - by Application
- 10.1.1. Myopia
- 10.1.2. Hyperopia
- 10.1.3. Astigmatism
- 10.2. Market Analysis, Insights and Forecast - by Types
- 10.2.1. Femtosecond Lasers
- 10.2.2. Excimer Lasers
- 10.2.3. Others
- 10.1. Market Analysis, Insights and Forecast - by Application
- 11. Asia Pacific Refractive Solutions Analysis, Insights and Forecast, 2020-2032
- 11.1. Market Analysis, Insights and Forecast - by Application
- 11.1.1. Myopia
- 11.1.2. Hyperopia
- 11.1.3. Astigmatism
- 11.2. Market Analysis, Insights and Forecast - by Types
- 11.2.1. Femtosecond Lasers
- 11.2.2. Excimer Lasers
- 11.2.3. Others
- 11.1. Market Analysis, Insights and Forecast - by Application
- 12. Competitive Analysis
- 12.1. Company Profiles
- 12.1.1 ALCON
- 12.1.1.1. Company Overview
- 12.1.1.2. Products
- 12.1.1.3. Company Financials
- 12.1.1.4. SWOT Analysis
- 12.1.2 AMO(Abbott)
- 12.1.2.1. Company Overview
- 12.1.2.2. Products
- 12.1.2.3. Company Financials
- 12.1.2.4. SWOT Analysis
- 12.1.3 Bausch + Lomb
- 12.1.3.1. Company Overview
- 12.1.3.2. Products
- 12.1.3.3. Company Financials
- 12.1.3.4. SWOT Analysis
- 12.1.4 Hoya Vision Care
- 12.1.4.1. Company Overview
- 12.1.4.2. Products
- 12.1.4.3. Company Financials
- 12.1.4.4. SWOT Analysis
- 12.1.5 CARL Zeiss
- 12.1.5.1. Company Overview
- 12.1.5.2. Products
- 12.1.5.3. Company Financials
- 12.1.5.4. SWOT Analysis
- 12.1.6 Ophtec
- 12.1.6.1. Company Overview
- 12.1.6.2. Products
- 12.1.6.3. Company Financials
- 12.1.6.4. SWOT Analysis
- 12.1.7 Rayner
- 12.1.7.1. Company Overview
- 12.1.7.2. Products
- 12.1.7.3. Company Financials
- 12.1.7.4. SWOT Analysis
- 12.1.8 STAAR
- 12.1.8.1. Company Overview
- 12.1.8.2. Products
- 12.1.8.3. Company Financials
- 12.1.8.4. SWOT Analysis
- 12.1.9 Lenstec
- 12.1.9.1. Company Overview
- 12.1.9.2. Products
- 12.1.9.3. Company Financials
- 12.1.9.4. SWOT Analysis
- 12.1.10 HumanOptics
- 12.1.10.1. Company Overview
- 12.1.10.2. Products
- 12.1.10.3. Company Financials
- 12.1.10.4. SWOT Analysis
- 12.1.11 Biotech Visioncare
- 12.1.11.1. Company Overview
- 12.1.11.2. Products
- 12.1.11.3. Company Financials
- 12.1.11.4. SWOT Analysis
- 12.1.12 Aurolab
- 12.1.12.1. Company Overview
- 12.1.12.2. Products
- 12.1.12.3. Company Financials
- 12.1.12.4. SWOT Analysis
- 12.1.13 SAV-IOL
- 12.1.13.1. Company Overview
- 12.1.13.2. Products
- 12.1.13.3. Company Financials
- 12.1.13.4. SWOT Analysis
- 12.1.14 Eagle Optics
- 12.1.14.1. Company Overview
- 12.1.14.2. Products
- 12.1.14.3. Company Financials
- 12.1.14.4. SWOT Analysis
- 12.1.15 SIFI Medtech
- 12.1.15.1. Company Overview
- 12.1.15.2. Products
- 12.1.15.3. Company Financials
- 12.1.15.4. SWOT Analysis
- 12.1.16 Physiol
- 12.1.16.1. Company Overview
- 12.1.16.2. Products
- 12.1.16.3. Company Financials
- 12.1.16.4. SWOT Analysis
- 12.1.17 Eyebright Medical Technology
- 12.1.17.1. Company Overview
- 12.1.17.2. Products
- 12.1.17.3. Company Financials
- 12.1.17.4. SWOT Analysis
- 12.1.1 ALCON
- 12.2. Market Entropy
- 12.2.1 Company's Key Areas Served
- 12.2.2 Recent Developments
- 12.3. Company Market Share Analysis 2025
- 12.3.1 Top 5 Companies Market Share Analysis
- 12.3.2 Top 3 Companies Market Share Analysis
- 12.4. List of Potential Customers
- 13. Research Methodology
List of Figures
- Figure 1: Global Refractive Solutions Revenue Breakdown (million, %) by Region 2025 & 2033
- Figure 2: North America Refractive Solutions Revenue (million), by Application 2025 & 2033
- Figure 3: North America Refractive Solutions Revenue Share (%), by Application 2025 & 2033
- Figure 4: North America Refractive Solutions Revenue (million), by Types 2025 & 2033
- Figure 5: North America Refractive Solutions Revenue Share (%), by Types 2025 & 2033
- Figure 6: North America Refractive Solutions Revenue (million), by Country 2025 & 2033
- Figure 7: North America Refractive Solutions Revenue Share (%), by Country 2025 & 2033
- Figure 8: South America Refractive Solutions Revenue (million), by Application 2025 & 2033
- Figure 9: South America Refractive Solutions Revenue Share (%), by Application 2025 & 2033
- Figure 10: South America Refractive Solutions Revenue (million), by Types 2025 & 2033
- Figure 11: South America Refractive Solutions Revenue Share (%), by Types 2025 & 2033
- Figure 12: South America Refractive Solutions Revenue (million), by Country 2025 & 2033
- Figure 13: South America Refractive Solutions Revenue Share (%), by Country 2025 & 2033
- Figure 14: Europe Refractive Solutions Revenue (million), by Application 2025 & 2033
- Figure 15: Europe Refractive Solutions Revenue Share (%), by Application 2025 & 2033
- Figure 16: Europe Refractive Solutions Revenue (million), by Types 2025 & 2033
- Figure 17: Europe Refractive Solutions Revenue Share (%), by Types 2025 & 2033
- Figure 18: Europe Refractive Solutions Revenue (million), by Country 2025 & 2033
- Figure 19: Europe Refractive Solutions Revenue Share (%), by Country 2025 & 2033
- Figure 20: Middle East & Africa Refractive Solutions Revenue (million), by Application 2025 & 2033
- Figure 21: Middle East & Africa Refractive Solutions Revenue Share (%), by Application 2025 & 2033
- Figure 22: Middle East & Africa Refractive Solutions Revenue (million), by Types 2025 & 2033
- Figure 23: Middle East & Africa Refractive Solutions Revenue Share (%), by Types 2025 & 2033
- Figure 24: Middle East & Africa Refractive Solutions Revenue (million), by Country 2025 & 2033
- Figure 25: Middle East & Africa Refractive Solutions Revenue Share (%), by Country 2025 & 2033
- Figure 26: Asia Pacific Refractive Solutions Revenue (million), by Application 2025 & 2033
- Figure 27: Asia Pacific Refractive Solutions Revenue Share (%), by Application 2025 & 2033
- Figure 28: Asia Pacific Refractive Solutions Revenue (million), by Types 2025 & 2033
- Figure 29: Asia Pacific Refractive Solutions Revenue Share (%), by Types 2025 & 2033
- Figure 30: Asia Pacific Refractive Solutions Revenue (million), by Country 2025 & 2033
- Figure 31: Asia Pacific Refractive Solutions Revenue Share (%), by Country 2025 & 2033
List of Tables
- Table 1: Global Refractive Solutions Revenue million Forecast, by Application 2020 & 2033
- Table 2: Global Refractive Solutions Revenue million Forecast, by Types 2020 & 2033
- Table 3: Global Refractive Solutions Revenue million Forecast, by Region 2020 & 2033
- Table 4: Global Refractive Solutions Revenue million Forecast, by Application 2020 & 2033
- Table 5: Global Refractive Solutions Revenue million Forecast, by Types 2020 & 2033
- Table 6: Global Refractive Solutions Revenue million Forecast, by Country 2020 & 2033
- Table 7: United States Refractive Solutions Revenue (million) Forecast, by Application 2020 & 2033
- Table 8: Canada Refractive Solutions Revenue (million) Forecast, by Application 2020 & 2033
- Table 9: Mexico Refractive Solutions Revenue (million) Forecast, by Application 2020 & 2033
- Table 10: Global Refractive Solutions Revenue million Forecast, by Application 2020 & 2033
- Table 11: Global Refractive Solutions Revenue million Forecast, by Types 2020 & 2033
- Table 12: Global Refractive Solutions Revenue million Forecast, by Country 2020 & 2033
- Table 13: Brazil Refractive Solutions Revenue (million) Forecast, by Application 2020 & 2033
- Table 14: Argentina Refractive Solutions Revenue (million) Forecast, by Application 2020 & 2033
- Table 15: Rest of South America Refractive Solutions Revenue (million) Forecast, by Application 2020 & 2033
- Table 16: Global Refractive Solutions Revenue million Forecast, by Application 2020 & 2033
- Table 17: Global Refractive Solutions Revenue million Forecast, by Types 2020 & 2033
- Table 18: Global Refractive Solutions Revenue million Forecast, by Country 2020 & 2033
- Table 19: United Kingdom Refractive Solutions Revenue (million) Forecast, by Application 2020 & 2033
- Table 20: Germany Refractive Solutions Revenue (million) Forecast, by Application 2020 & 2033
- Table 21: France Refractive Solutions Revenue (million) Forecast, by Application 2020 & 2033
- Table 22: Italy Refractive Solutions Revenue (million) Forecast, by Application 2020 & 2033
- Table 23: Spain Refractive Solutions Revenue (million) Forecast, by Application 2020 & 2033
- Table 24: Russia Refractive Solutions Revenue (million) Forecast, by Application 2020 & 2033
- Table 25: Benelux Refractive Solutions Revenue (million) Forecast, by Application 2020 & 2033
- Table 26: Nordics Refractive Solutions Revenue (million) Forecast, by Application 2020 & 2033
- Table 27: Rest of Europe Refractive Solutions Revenue (million) Forecast, by Application 2020 & 2033
- Table 28: Global Refractive Solutions Revenue million Forecast, by Application 2020 & 2033
- Table 29: Global Refractive Solutions Revenue million Forecast, by Types 2020 & 2033
- Table 30: Global Refractive Solutions Revenue million Forecast, by Country 2020 & 2033
- Table 31: Turkey Refractive Solutions Revenue (million) Forecast, by Application 2020 & 2033
- Table 32: Israel Refractive Solutions Revenue (million) Forecast, by Application 2020 & 2033
- Table 33: GCC Refractive Solutions Revenue (million) Forecast, by Application 2020 & 2033
- Table 34: North Africa Refractive Solutions Revenue (million) Forecast, by Application 2020 & 2033
- Table 35: South Africa Refractive Solutions Revenue (million) Forecast, by Application 2020 & 2033
- Table 36: Rest of Middle East & Africa Refractive Solutions Revenue (million) Forecast, by Application 2020 & 2033
- Table 37: Global Refractive Solutions Revenue million Forecast, by Application 2020 & 2033
- Table 38: Global Refractive Solutions Revenue million Forecast, by Types 2020 & 2033
- Table 39: Global Refractive Solutions Revenue million Forecast, by Country 2020 & 2033
- Table 40: China Refractive Solutions Revenue (million) Forecast, by Application 2020 & 2033
- Table 41: India Refractive Solutions Revenue (million) Forecast, by Application 2020 & 2033
- Table 42: Japan Refractive Solutions Revenue (million) Forecast, by Application 2020 & 2033
- Table 43: South Korea Refractive Solutions Revenue (million) Forecast, by Application 2020 & 2033
- Table 44: ASEAN Refractive Solutions Revenue (million) Forecast, by Application 2020 & 2033
- Table 45: Oceania Refractive Solutions Revenue (million) Forecast, by Application 2020 & 2033
- Table 46: Rest of Asia Pacific Refractive Solutions Revenue (million) Forecast, by Application 2020 & 2033
Frequently Asked Questions
1. What is the projected Compound Annual Growth Rate (CAGR) of the Refractive Solutions?
The projected CAGR is approximately 5.4%.
2. Which companies are prominent players in the Refractive Solutions?
Key companies in the market include ALCON, AMO(Abbott), Bausch + Lomb, Hoya Vision Care, CARL Zeiss, Ophtec, Rayner, STAAR, Lenstec, HumanOptics, Biotech Visioncare, Aurolab, SAV-IOL, Eagle Optics, SIFI Medtech, Physiol, Eyebright Medical Technology.
3. What are the main segments of the Refractive Solutions?
The market segments include Application, Types.
4. Can you provide details about the market size?
The market size is estimated to be USD 7462.6 million as of 2022.
5. What are some drivers contributing to market growth?
N/A
6. What are the notable trends driving market growth?
N/A
7. Are there any restraints impacting market growth?
N/A
8. Can you provide examples of recent developments in the market?
N/A
9. What pricing options are available for accessing the report?
Pricing options include single-user, multi-user, and enterprise licenses priced at USD 2900.00, USD 4350.00, and USD 5800.00 respectively.
10. Is the market size provided in terms of value or volume?
The market size is provided in terms of value, measured in million.
11. Are there any specific market keywords associated with the report?
Yes, the market keyword associated with the report is "Refractive Solutions," which aids in identifying and referencing the specific market segment covered.
12. How do I determine which pricing option suits my needs best?
The pricing options vary based on user requirements and access needs. Individual users may opt for single-user licenses, while businesses requiring broader access may choose multi-user or enterprise licenses for cost-effective access to the report.
13. Are there any additional resources or data provided in the Refractive Solutions report?
While the report offers comprehensive insights, it's advisable to review the specific contents or supplementary materials provided to ascertain if additional resources or data are available.
14. How can I stay updated on further developments or reports in the Refractive Solutions?
To stay informed about further developments, trends, and reports in the Refractive Solutions, consider subscribing to industry newsletters, following relevant companies and organizations, or regularly checking reputable industry news sources and publications.
Methodology
Step 1 - Identification of Relevant Samples Size from Population Database


Step 2 - Approaches for Defining Global Market Size (Value, Volume* & Price*)

Note*: In applicable scenarios
Step 3 - Data Sources
Primary Research
- Web Analytics
- Survey Reports
- Research Institute
- Latest Research Reports
- Opinion Leaders
Secondary Research
- Annual Reports
- White Paper
- Latest Press Release
- Industry Association
- Paid Database
- Investor Presentations

Step 4 - Data Triangulation
Involves using different sources of information in order to increase the validity of a study
These sources are likely to be stakeholders in a program - participants, other researchers, program staff, other community members, and so on.
Then we put all data in single framework & apply various statistical tools to find out the dynamic on the market.
During the analysis stage, feedback from the stakeholder groups would be compared to determine areas of agreement as well as areas of divergence