
Key Insights
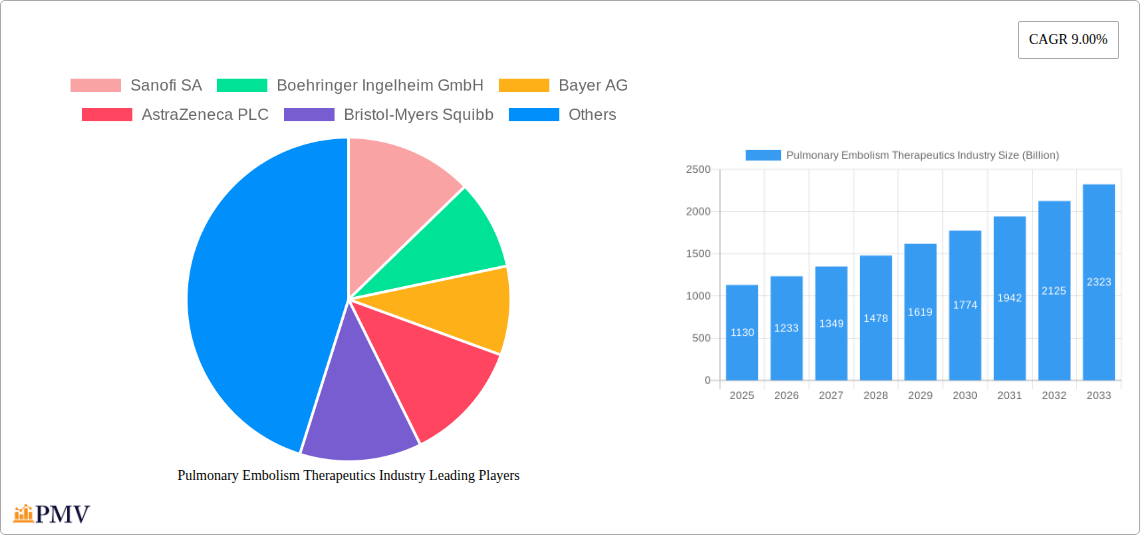
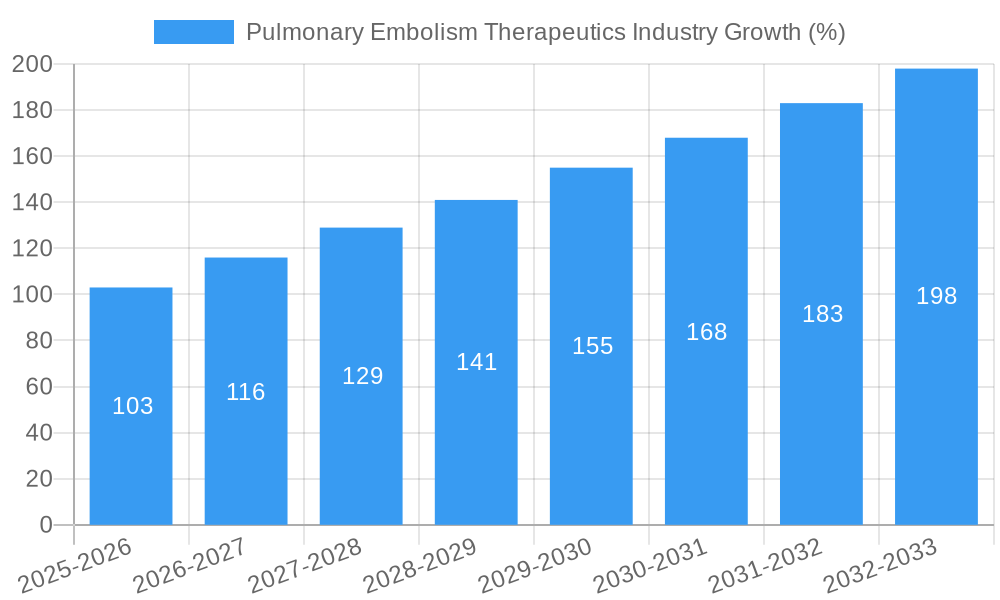
The Pulmonary Embolism (PE) therapeutics market, a significant segment within the broader anticoagulant market, is experiencing robust growth, driven by increasing prevalence of PE, advancements in diagnostic techniques, and the introduction of newer, more effective treatment options. The market, valued at approximately $1.13 billion in 2025 (based on the provided overall market size and considering PE's substantial share within the broader anticoagulant market), is projected to exhibit a compound annual growth rate (CAGR) of 9.00% from 2025 to 2033. This growth is fueled by several key factors. The aging global population, a known risk factor for PE, is contributing significantly to the rising incidence of the disease. Furthermore, heightened awareness among healthcare professionals and patients regarding PE symptoms and risk factors is leading to earlier diagnosis and treatment. The development of novel anticoagulants, offering improved efficacy and safety profiles compared to traditional therapies like heparin, is also a major catalyst for market expansion. While challenges remain, such as the potential for bleeding complications associated with anticoagulant therapy and variations in treatment guidelines across different regions, the overall market outlook for PE therapeutics remains positive.
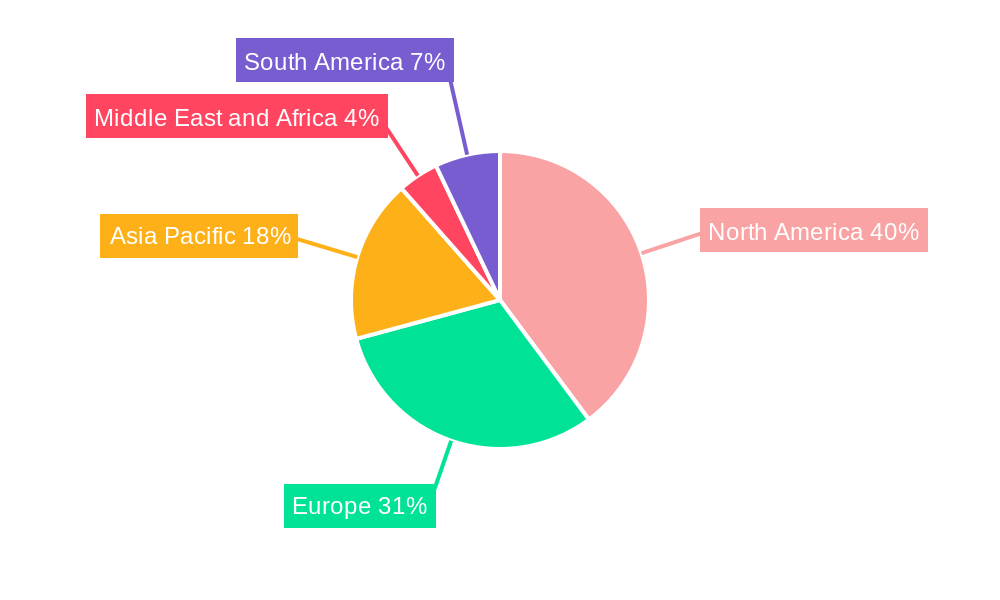
The market segmentation reveals key opportunities. Factor Xa inhibitors and direct thrombin inhibitors are leading drug classes, enjoying increased adoption due to their convenient administration routes and improved safety profiles. Geographically, North America and Europe currently dominate the market, driven by high healthcare expenditure and advanced healthcare infrastructure. However, emerging economies in Asia-Pacific and Latin America present considerable growth potential, fueled by rising healthcare awareness and increasing disposable incomes. The distribution channel is primarily hospital pharmacies, reflecting the acute nature of PE treatment, however, retail and online pharmacies are expected to grow in importance as awareness of home-based treatment options increases. The competitive landscape is characterized by the presence of several major pharmaceutical companies engaged in research and development, as well as generic drug manufacturers. This competitive environment drives innovation and makes effective treatment more accessible.
Pulmonary Embolism Therapeutics Industry Market Report: 2019-2033
This comprehensive report provides a detailed analysis of the Pulmonary Embolism Therapeutics industry, offering invaluable insights for stakeholders seeking to navigate this dynamic market. Covering the period 2019-2033, with a base year of 2025 and a forecast period of 2025-2033, this report delves into market size, segmentation, competitive dynamics, and future growth prospects. The global market valuation is predicted to reach xx Billion by 2033.
Pulmonary Embolism Therapeutics Industry Market Structure & Competitive Dynamics
The Pulmonary Embolism Therapeutics market exhibits a moderately consolidated structure, with several key players vying for market share. Market concentration is influenced by factors such as research and development capabilities, regulatory approvals, and marketing strategies. Innovation ecosystems play a crucial role, with companies constantly striving to develop novel therapies and improve existing treatments. Regulatory frameworks, particularly those set by agencies like the FDA, significantly impact market entry and product lifecycle. The presence of substitute therapies, such as alternative anticoagulants, presents competitive pressure. End-user trends, including a growing awareness of thromboembolic diseases and an increasing demand for effective treatments, drive market growth. Mergers and acquisitions (M&A) are prevalent, with larger pharmaceutical companies often acquiring smaller biotech firms to bolster their pipelines. Recent M&A activity has involved deals valued at xx Billion, signifying significant investment in the sector.
- Market Share (Estimated 2025): The top five companies (Sanofi SA, Boehringer Ingelheim GmbH, Bayer AG, AstraZeneca PLC, Bristol-Myers Squibb) hold an estimated xx% collective market share.
- M&A Activity (2019-2024): A total of xx M&A deals were recorded, with a cumulative value exceeding xx Billion.
Pulmonary Embolism Therapeutics Industry Industry Trends & Insights
The Pulmonary Embolism Therapeutics market is experiencing robust growth, driven by several key factors. The increasing prevalence of thromboembolic disorders, including pulmonary embolism, atrial fibrillation, and deep vein thrombosis, is a primary driver. Technological advancements, such as the development of novel anticoagulants and targeted therapies, are expanding treatment options and improving patient outcomes. Consumer preferences are shifting towards more convenient and effective therapies, fueling demand for oral anticoagulants. The competitive landscape is intensely dynamic, with companies focusing on innovation, product differentiation, and strategic partnerships to maintain a competitive edge. The compound annual growth rate (CAGR) for the period 2025-2033 is projected to be xx%, indicating substantial market expansion. Market penetration of novel therapies is expected to increase to xx% by 2033.
Dominant Markets & Segments in Pulmonary Embolism Therapeutics Industry
The North American region currently dominates the Pulmonary Embolism Therapeutics market, driven by high healthcare expenditure, advanced healthcare infrastructure, and a large patient population. Within this region, the United States holds the largest market share.
- Drug Class: Factor Xa inhibitors represent the fastest-growing segment, driven by their superior efficacy and safety profiles compared to traditional anticoagulants. Heparin remains a significant segment, especially in acute settings.
- Disease Type: Pulmonary embolism accounts for the largest segment within the disease type category, reflecting its high prevalence and significant clinical burden. Atrial fibrillation, due to its widespread prevalence, is also a considerable segment.
- Distribution Channel: Hospital pharmacies dominate the distribution channel, with retail pharmacies showing steady growth due to increased patient preference for convenient access. Online pharmacies are emerging as a significant segment, offering accessibility and cost-effectiveness.
Key Drivers for Dominant Segments:
- High prevalence of thromboembolic diseases: The ageing population and increasing incidence of risk factors like obesity and sedentary lifestyles are contributing factors.
- Technological advancements: The development of novel, more effective and safer anticoagulants is crucial.
- Favorable reimbursement policies: Governmental healthcare policies that support access to advanced therapies propel market growth.
Pulmonary Embolism Therapeutics Industry Product Innovations
Recent years have witnessed significant product innovation in the Pulmonary Embolism Therapeutics market. This includes the development of novel anticoagulants with improved efficacy and safety profiles, as well as the emergence of targeted therapies focusing on specific pathways involved in thrombosis. These innovations aim to provide more effective and convenient treatment options, minimizing adverse effects and enhancing patient outcomes. The market is witnessing a shift towards oral anticoagulants due to improved convenience and compliance compared to injectable therapies.
Report Segmentation & Scope
This report provides a detailed analysis of the Pulmonary Embolism Therapeutics market, segmented by drug class (Factor Xa inhibitors, Heparin, P2Y12 platelet inhibitors, other drug classes), disease type (Pulmonary Embolism, Atrial Fibrillation, Deep Vein Thrombosis, other disease types), and distribution channel (Hospital Pharmacies, Retail Pharmacies, Online Pharmacies). Each segment's growth projections, market sizes, and competitive dynamics are analyzed in detail. For instance, the Factor Xa inhibitor segment is expected to exhibit a CAGR of xx% over the forecast period, driven by the introduction of newer, more effective drugs. The Pulmonary Embolism disease type segment is projected to hold the largest market share due to its high prevalence. Hospital pharmacies are expected to continue to dominate the distribution channel.
Key Drivers of Pulmonary Embolism Therapeutics Industry Growth
Several factors drive growth in the Pulmonary Embolism Therapeutics market. These include the increasing prevalence of thromboembolic diseases, fueled by an aging population and lifestyle changes. Technological advancements resulting in more effective and safer anticoagulants play a crucial role. Favorable reimbursement policies and increasing healthcare expenditure also contribute significantly. Finally, growing awareness among healthcare providers and patients about the importance of early diagnosis and treatment further fuels market expansion.
Challenges in the Pulmonary Embolism Therapeutics Industry Sector
The Pulmonary Embolism Therapeutics market faces several challenges. Stringent regulatory approvals and the high cost of drug development represent significant hurdles. Supply chain disruptions, particularly regarding raw materials and manufacturing, can impact availability and affordability. Furthermore, intense competition from established players and the entry of new therapies create a dynamic market landscape. These factors can collectively affect market growth and profitability.
Leading Players in the Pulmonary Embolism Therapeutics Industry Market
- Sanofi SA
- Boehringer Ingelheim GmbH
- Bayer AG
- AstraZeneca PLC
- Bristol-Myers Squibb
- Teva Pharmaceutical Industries Ltd
- Johnson & Johnson
- Swiss Pharma Pvt Ltd
- Laurus Lab (Aspen Pharmacare Holdings Limited)
- Pfizer Inc
Key Developments in Pulmonary Embolism Therapeutics Industry Sector
- July 2022: The FDA granted abelacimab, a new drug from Anthos Therapeutics, a fast-track designation to treat cancer-related thrombosis. This highlights the focus on developing novel therapies for thrombotic complications.
- February 2023: Bayer announced the enrollment of the first patients in its OCEANIC clinical trial program for asundexian (BAY2433334), an investigational oral Factor XIa inhibitor. This signifies ongoing innovation and investment in novel anticoagulant therapies.
Strategic Pulmonary Embolism Therapeutics Industry Market Outlook
The Pulmonary Embolism Therapeutics market holds substantial future potential. The continued development of innovative therapies, coupled with a growing awareness of thromboembolic diseases, will propel market expansion. Strategic partnerships and acquisitions are expected to reshape the competitive landscape. Companies focusing on R&D and the development of personalized medicine approaches will be well-positioned to capitalize on emerging market opportunities. The market is poised for sustained growth, driven by unmet medical needs and technological advancements.
Pulmonary Embolism Therapeutics Industry Segmentation
-
1. Drug Class
- 1.1. Factor Xa Inhibitor
- 1.2. Heparin
- 1.3. P2Y12 Platelet Inhibitor
- 1.4. Other Drug Classes
-
2. Disease Type
- 2.1. Pulmonary Embolism
- 2.2. Atrial Fibrillation
- 2.3. Deep Vein Thrombosis
- 2.4. Other Disease Types
-
3. Distribution Channel
- 3.1. Hospital Pharmacies
- 3.2. Retail Pharmacies
- 3.3. Online Pharmacies
Pulmonary Embolism Therapeutics Industry Segmentation By Geography
-
1. North America
- 1.1. United States
- 1.2. Canada
- 1.3. Mexico
-
2. Europe
- 2.1. Germany
- 2.2. United Kingdom
- 2.3. France
- 2.4. Italy
- 2.5. Spain
- 2.6. Rest of Europe
-
3. Asia Pacific
- 3.1. China
- 3.2. Japan
- 3.3. India
- 3.4. Australia
- 3.5. South Korea
- 3.6. Rest of Asia Pacific
-
4. Middle East and Africa
- 4.1. GCC
- 4.2. South Africa
- 4.3. Rest of Middle East and Africa
-
5. South America
- 5.1. Brazil
- 5.2. Argentina
- 5.3. Rest of South America
Pulmonary Embolism Therapeutics Industry REPORT HIGHLIGHTS
| Aspects | Details |
|---|---|
| Study Period | 2019-2033 |
| Base Year | 2024 |
| Estimated Year | 2025 |
| Forecast Period | 2025-2033 |
| Historical Period | 2019-2024 |
| Growth Rate | CAGR of 9.00% from 2019-2033 |
| Segmentation |
|
Table of Contents
- 1. Introduction
- 1.1. Research Scope
- 1.2. Market Segmentation
- 1.3. Research Methodology
- 1.4. Definitions and Assumptions
- 2. Executive Summary
- 2.1. Introduction
- 3. Market Dynamics
- 3.1. Introduction
- 3.2. Market Drivers
- 3.2.1. Growing Geriatric and Obese Population; Increasing Burden of Cardiovascular and Trauma Cases; Increasing Technological Advancements in Hematology
- 3.3. Market Restrains
- 3.3.1 Lack of Awareness about Venous Thromboembolism Conditions; Side Effects Caused
- 3.3.2 due to Thrombosis Drugs
- 3.4. Market Trends
- 3.4.1. Deep Vein Thrombosis (DVT) Segment is Expected to Register a Significant Growth during the Forecast Period
- 4. Market Factor Analysis
- 4.1. Porters Five Forces
- 4.2. Supply/Value Chain
- 4.3. PESTEL analysis
- 4.4. Market Entropy
- 4.5. Patent/Trademark Analysis
- 5. Global Pulmonary Embolism Therapeutics Industry Analysis, Insights and Forecast, 2019-2031
- 5.1. Market Analysis, Insights and Forecast - by Drug Class
- 5.1.1. Factor Xa Inhibitor
- 5.1.2. Heparin
- 5.1.3. P2Y12 Platelet Inhibitor
- 5.1.4. Other Drug Classes
- 5.2. Market Analysis, Insights and Forecast - by Disease Type
- 5.2.1. Pulmonary Embolism
- 5.2.2. Atrial Fibrillation
- 5.2.3. Deep Vein Thrombosis
- 5.2.4. Other Disease Types
- 5.3. Market Analysis, Insights and Forecast - by Distribution Channel
- 5.3.1. Hospital Pharmacies
- 5.3.2. Retail Pharmacies
- 5.3.3. Online Pharmacies
- 5.4. Market Analysis, Insights and Forecast - by Region
- 5.4.1. North America
- 5.4.2. Europe
- 5.4.3. Asia Pacific
- 5.4.4. Middle East and Africa
- 5.4.5. South America
- 5.1. Market Analysis, Insights and Forecast - by Drug Class
- 6. North America Pulmonary Embolism Therapeutics Industry Analysis, Insights and Forecast, 2019-2031
- 6.1. Market Analysis, Insights and Forecast - by Drug Class
- 6.1.1. Factor Xa Inhibitor
- 6.1.2. Heparin
- 6.1.3. P2Y12 Platelet Inhibitor
- 6.1.4. Other Drug Classes
- 6.2. Market Analysis, Insights and Forecast - by Disease Type
- 6.2.1. Pulmonary Embolism
- 6.2.2. Atrial Fibrillation
- 6.2.3. Deep Vein Thrombosis
- 6.2.4. Other Disease Types
- 6.3. Market Analysis, Insights and Forecast - by Distribution Channel
- 6.3.1. Hospital Pharmacies
- 6.3.2. Retail Pharmacies
- 6.3.3. Online Pharmacies
- 6.1. Market Analysis, Insights and Forecast - by Drug Class
- 7. Europe Pulmonary Embolism Therapeutics Industry Analysis, Insights and Forecast, 2019-2031
- 7.1. Market Analysis, Insights and Forecast - by Drug Class
- 7.1.1. Factor Xa Inhibitor
- 7.1.2. Heparin
- 7.1.3. P2Y12 Platelet Inhibitor
- 7.1.4. Other Drug Classes
- 7.2. Market Analysis, Insights and Forecast - by Disease Type
- 7.2.1. Pulmonary Embolism
- 7.2.2. Atrial Fibrillation
- 7.2.3. Deep Vein Thrombosis
- 7.2.4. Other Disease Types
- 7.3. Market Analysis, Insights and Forecast - by Distribution Channel
- 7.3.1. Hospital Pharmacies
- 7.3.2. Retail Pharmacies
- 7.3.3. Online Pharmacies
- 7.1. Market Analysis, Insights and Forecast - by Drug Class
- 8. Asia Pacific Pulmonary Embolism Therapeutics Industry Analysis, Insights and Forecast, 2019-2031
- 8.1. Market Analysis, Insights and Forecast - by Drug Class
- 8.1.1. Factor Xa Inhibitor
- 8.1.2. Heparin
- 8.1.3. P2Y12 Platelet Inhibitor
- 8.1.4. Other Drug Classes
- 8.2. Market Analysis, Insights and Forecast - by Disease Type
- 8.2.1. Pulmonary Embolism
- 8.2.2. Atrial Fibrillation
- 8.2.3. Deep Vein Thrombosis
- 8.2.4. Other Disease Types
- 8.3. Market Analysis, Insights and Forecast - by Distribution Channel
- 8.3.1. Hospital Pharmacies
- 8.3.2. Retail Pharmacies
- 8.3.3. Online Pharmacies
- 8.1. Market Analysis, Insights and Forecast - by Drug Class
- 9. Middle East and Africa Pulmonary Embolism Therapeutics Industry Analysis, Insights and Forecast, 2019-2031
- 9.1. Market Analysis, Insights and Forecast - by Drug Class
- 9.1.1. Factor Xa Inhibitor
- 9.1.2. Heparin
- 9.1.3. P2Y12 Platelet Inhibitor
- 9.1.4. Other Drug Classes
- 9.2. Market Analysis, Insights and Forecast - by Disease Type
- 9.2.1. Pulmonary Embolism
- 9.2.2. Atrial Fibrillation
- 9.2.3. Deep Vein Thrombosis
- 9.2.4. Other Disease Types
- 9.3. Market Analysis, Insights and Forecast - by Distribution Channel
- 9.3.1. Hospital Pharmacies
- 9.3.2. Retail Pharmacies
- 9.3.3. Online Pharmacies
- 9.1. Market Analysis, Insights and Forecast - by Drug Class
- 10. South America Pulmonary Embolism Therapeutics Industry Analysis, Insights and Forecast, 2019-2031
- 10.1. Market Analysis, Insights and Forecast - by Drug Class
- 10.1.1. Factor Xa Inhibitor
- 10.1.2. Heparin
- 10.1.3. P2Y12 Platelet Inhibitor
- 10.1.4. Other Drug Classes
- 10.2. Market Analysis, Insights and Forecast - by Disease Type
- 10.2.1. Pulmonary Embolism
- 10.2.2. Atrial Fibrillation
- 10.2.3. Deep Vein Thrombosis
- 10.2.4. Other Disease Types
- 10.3. Market Analysis, Insights and Forecast - by Distribution Channel
- 10.3.1. Hospital Pharmacies
- 10.3.2. Retail Pharmacies
- 10.3.3. Online Pharmacies
- 10.1. Market Analysis, Insights and Forecast - by Drug Class
- 11. North America Pulmonary Embolism Therapeutics Industry Analysis, Insights and Forecast, 2019-2031
- 11.1. Market Analysis, Insights and Forecast - By Country/Sub-region
- 11.1.1 United States
- 11.1.2 Canada
- 11.1.3 Mexico
- 12. Europe Pulmonary Embolism Therapeutics Industry Analysis, Insights and Forecast, 2019-2031
- 12.1. Market Analysis, Insights and Forecast - By Country/Sub-region
- 12.1.1 Germany
- 12.1.2 United Kingdom
- 12.1.3 France
- 12.1.4 Italy
- 12.1.5 Spain
- 12.1.6 Rest of Europe
- 13. Asia Pacific Pulmonary Embolism Therapeutics Industry Analysis, Insights and Forecast, 2019-2031
- 13.1. Market Analysis, Insights and Forecast - By Country/Sub-region
- 13.1.1 China
- 13.1.2 Japan
- 13.1.3 India
- 13.1.4 Australia
- 13.1.5 South Korea
- 13.1.6 Rest of Asia Pacific
- 14. Middle East and Africa Pulmonary Embolism Therapeutics Industry Analysis, Insights and Forecast, 2019-2031
- 14.1. Market Analysis, Insights and Forecast - By Country/Sub-region
- 14.1.1 GCC
- 14.1.2 South Africa
- 14.1.3 Rest of Middle East and Africa
- 15. South America Pulmonary Embolism Therapeutics Industry Analysis, Insights and Forecast, 2019-2031
- 15.1. Market Analysis, Insights and Forecast - By Country/Sub-region
- 15.1.1 Brazil
- 15.1.2 Argentina
- 15.1.3 Rest of South America
- 16. Competitive Analysis
- 16.1. Global Market Share Analysis 2024
- 16.2. Company Profiles
- 16.2.1 Sanofi SA
- 16.2.1.1. Overview
- 16.2.1.2. Products
- 16.2.1.3. SWOT Analysis
- 16.2.1.4. Recent Developments
- 16.2.1.5. Financials (Based on Availability)
- 16.2.2 Boehringer Ingelheim GmbH
- 16.2.2.1. Overview
- 16.2.2.2. Products
- 16.2.2.3. SWOT Analysis
- 16.2.2.4. Recent Developments
- 16.2.2.5. Financials (Based on Availability)
- 16.2.3 Bayer AG
- 16.2.3.1. Overview
- 16.2.3.2. Products
- 16.2.3.3. SWOT Analysis
- 16.2.3.4. Recent Developments
- 16.2.3.5. Financials (Based on Availability)
- 16.2.4 AstraZeneca PLC
- 16.2.4.1. Overview
- 16.2.4.2. Products
- 16.2.4.3. SWOT Analysis
- 16.2.4.4. Recent Developments
- 16.2.4.5. Financials (Based on Availability)
- 16.2.5 Bristol-Myers Squibb
- 16.2.5.1. Overview
- 16.2.5.2. Products
- 16.2.5.3. SWOT Analysis
- 16.2.5.4. Recent Developments
- 16.2.5.5. Financials (Based on Availability)
- 16.2.6 Teva Pharmaceutical Industries Ltd
- 16.2.6.1. Overview
- 16.2.6.2. Products
- 16.2.6.3. SWOT Analysis
- 16.2.6.4. Recent Developments
- 16.2.6.5. Financials (Based on Availability)
- 16.2.7 Johnson & Johnson
- 16.2.7.1. Overview
- 16.2.7.2. Products
- 16.2.7.3. SWOT Analysis
- 16.2.7.4. Recent Developments
- 16.2.7.5. Financials (Based on Availability)
- 16.2.8 Swiss Pharma Pvt Ltd*List Not Exhaustive
- 16.2.8.1. Overview
- 16.2.8.2. Products
- 16.2.8.3. SWOT Analysis
- 16.2.8.4. Recent Developments
- 16.2.8.5. Financials (Based on Availability)
- 16.2.9 Laurus Lab (Aspen Pharmacare Holdings Limited)
- 16.2.9.1. Overview
- 16.2.9.2. Products
- 16.2.9.3. SWOT Analysis
- 16.2.9.4. Recent Developments
- 16.2.9.5. Financials (Based on Availability)
- 16.2.10 Pfizer Inc
- 16.2.10.1. Overview
- 16.2.10.2. Products
- 16.2.10.3. SWOT Analysis
- 16.2.10.4. Recent Developments
- 16.2.10.5. Financials (Based on Availability)
- 16.2.1 Sanofi SA
List of Figures
- Figure 1: Global Pulmonary Embolism Therapeutics Industry Revenue Breakdown (Billion, %) by Region 2024 & 2032
- Figure 2: Global Pulmonary Embolism Therapeutics Industry Volume Breakdown (mg, %) by Region 2024 & 2032
- Figure 3: North America Pulmonary Embolism Therapeutics Industry Revenue (Billion), by Country 2024 & 2032
- Figure 4: North America Pulmonary Embolism Therapeutics Industry Volume (mg), by Country 2024 & 2032
- Figure 5: North America Pulmonary Embolism Therapeutics Industry Revenue Share (%), by Country 2024 & 2032
- Figure 6: North America Pulmonary Embolism Therapeutics Industry Volume Share (%), by Country 2024 & 2032
- Figure 7: Europe Pulmonary Embolism Therapeutics Industry Revenue (Billion), by Country 2024 & 2032
- Figure 8: Europe Pulmonary Embolism Therapeutics Industry Volume (mg), by Country 2024 & 2032
- Figure 9: Europe Pulmonary Embolism Therapeutics Industry Revenue Share (%), by Country 2024 & 2032
- Figure 10: Europe Pulmonary Embolism Therapeutics Industry Volume Share (%), by Country 2024 & 2032
- Figure 11: Asia Pacific Pulmonary Embolism Therapeutics Industry Revenue (Billion), by Country 2024 & 2032
- Figure 12: Asia Pacific Pulmonary Embolism Therapeutics Industry Volume (mg), by Country 2024 & 2032
- Figure 13: Asia Pacific Pulmonary Embolism Therapeutics Industry Revenue Share (%), by Country 2024 & 2032
- Figure 14: Asia Pacific Pulmonary Embolism Therapeutics Industry Volume Share (%), by Country 2024 & 2032
- Figure 15: Middle East and Africa Pulmonary Embolism Therapeutics Industry Revenue (Billion), by Country 2024 & 2032
- Figure 16: Middle East and Africa Pulmonary Embolism Therapeutics Industry Volume (mg), by Country 2024 & 2032
- Figure 17: Middle East and Africa Pulmonary Embolism Therapeutics Industry Revenue Share (%), by Country 2024 & 2032
- Figure 18: Middle East and Africa Pulmonary Embolism Therapeutics Industry Volume Share (%), by Country 2024 & 2032
- Figure 19: South America Pulmonary Embolism Therapeutics Industry Revenue (Billion), by Country 2024 & 2032
- Figure 20: South America Pulmonary Embolism Therapeutics Industry Volume (mg), by Country 2024 & 2032
- Figure 21: South America Pulmonary Embolism Therapeutics Industry Revenue Share (%), by Country 2024 & 2032
- Figure 22: South America Pulmonary Embolism Therapeutics Industry Volume Share (%), by Country 2024 & 2032
- Figure 23: North America Pulmonary Embolism Therapeutics Industry Revenue (Billion), by Drug Class 2024 & 2032
- Figure 24: North America Pulmonary Embolism Therapeutics Industry Volume (mg), by Drug Class 2024 & 2032
- Figure 25: North America Pulmonary Embolism Therapeutics Industry Revenue Share (%), by Drug Class 2024 & 2032
- Figure 26: North America Pulmonary Embolism Therapeutics Industry Volume Share (%), by Drug Class 2024 & 2032
- Figure 27: North America Pulmonary Embolism Therapeutics Industry Revenue (Billion), by Disease Type 2024 & 2032
- Figure 28: North America Pulmonary Embolism Therapeutics Industry Volume (mg), by Disease Type 2024 & 2032
- Figure 29: North America Pulmonary Embolism Therapeutics Industry Revenue Share (%), by Disease Type 2024 & 2032
- Figure 30: North America Pulmonary Embolism Therapeutics Industry Volume Share (%), by Disease Type 2024 & 2032
- Figure 31: North America Pulmonary Embolism Therapeutics Industry Revenue (Billion), by Distribution Channel 2024 & 2032
- Figure 32: North America Pulmonary Embolism Therapeutics Industry Volume (mg), by Distribution Channel 2024 & 2032
- Figure 33: North America Pulmonary Embolism Therapeutics Industry Revenue Share (%), by Distribution Channel 2024 & 2032
- Figure 34: North America Pulmonary Embolism Therapeutics Industry Volume Share (%), by Distribution Channel 2024 & 2032
- Figure 35: North America Pulmonary Embolism Therapeutics Industry Revenue (Billion), by Country 2024 & 2032
- Figure 36: North America Pulmonary Embolism Therapeutics Industry Volume (mg), by Country 2024 & 2032
- Figure 37: North America Pulmonary Embolism Therapeutics Industry Revenue Share (%), by Country 2024 & 2032
- Figure 38: North America Pulmonary Embolism Therapeutics Industry Volume Share (%), by Country 2024 & 2032
- Figure 39: Europe Pulmonary Embolism Therapeutics Industry Revenue (Billion), by Drug Class 2024 & 2032
- Figure 40: Europe Pulmonary Embolism Therapeutics Industry Volume (mg), by Drug Class 2024 & 2032
- Figure 41: Europe Pulmonary Embolism Therapeutics Industry Revenue Share (%), by Drug Class 2024 & 2032
- Figure 42: Europe Pulmonary Embolism Therapeutics Industry Volume Share (%), by Drug Class 2024 & 2032
- Figure 43: Europe Pulmonary Embolism Therapeutics Industry Revenue (Billion), by Disease Type 2024 & 2032
- Figure 44: Europe Pulmonary Embolism Therapeutics Industry Volume (mg), by Disease Type 2024 & 2032
- Figure 45: Europe Pulmonary Embolism Therapeutics Industry Revenue Share (%), by Disease Type 2024 & 2032
- Figure 46: Europe Pulmonary Embolism Therapeutics Industry Volume Share (%), by Disease Type 2024 & 2032
- Figure 47: Europe Pulmonary Embolism Therapeutics Industry Revenue (Billion), by Distribution Channel 2024 & 2032
- Figure 48: Europe Pulmonary Embolism Therapeutics Industry Volume (mg), by Distribution Channel 2024 & 2032
- Figure 49: Europe Pulmonary Embolism Therapeutics Industry Revenue Share (%), by Distribution Channel 2024 & 2032
- Figure 50: Europe Pulmonary Embolism Therapeutics Industry Volume Share (%), by Distribution Channel 2024 & 2032
- Figure 51: Europe Pulmonary Embolism Therapeutics Industry Revenue (Billion), by Country 2024 & 2032
- Figure 52: Europe Pulmonary Embolism Therapeutics Industry Volume (mg), by Country 2024 & 2032
- Figure 53: Europe Pulmonary Embolism Therapeutics Industry Revenue Share (%), by Country 2024 & 2032
- Figure 54: Europe Pulmonary Embolism Therapeutics Industry Volume Share (%), by Country 2024 & 2032
- Figure 55: Asia Pacific Pulmonary Embolism Therapeutics Industry Revenue (Billion), by Drug Class 2024 & 2032
- Figure 56: Asia Pacific Pulmonary Embolism Therapeutics Industry Volume (mg), by Drug Class 2024 & 2032
- Figure 57: Asia Pacific Pulmonary Embolism Therapeutics Industry Revenue Share (%), by Drug Class 2024 & 2032
- Figure 58: Asia Pacific Pulmonary Embolism Therapeutics Industry Volume Share (%), by Drug Class 2024 & 2032
- Figure 59: Asia Pacific Pulmonary Embolism Therapeutics Industry Revenue (Billion), by Disease Type 2024 & 2032
- Figure 60: Asia Pacific Pulmonary Embolism Therapeutics Industry Volume (mg), by Disease Type 2024 & 2032
- Figure 61: Asia Pacific Pulmonary Embolism Therapeutics Industry Revenue Share (%), by Disease Type 2024 & 2032
- Figure 62: Asia Pacific Pulmonary Embolism Therapeutics Industry Volume Share (%), by Disease Type 2024 & 2032
- Figure 63: Asia Pacific Pulmonary Embolism Therapeutics Industry Revenue (Billion), by Distribution Channel 2024 & 2032
- Figure 64: Asia Pacific Pulmonary Embolism Therapeutics Industry Volume (mg), by Distribution Channel 2024 & 2032
- Figure 65: Asia Pacific Pulmonary Embolism Therapeutics Industry Revenue Share (%), by Distribution Channel 2024 & 2032
- Figure 66: Asia Pacific Pulmonary Embolism Therapeutics Industry Volume Share (%), by Distribution Channel 2024 & 2032
- Figure 67: Asia Pacific Pulmonary Embolism Therapeutics Industry Revenue (Billion), by Country 2024 & 2032
- Figure 68: Asia Pacific Pulmonary Embolism Therapeutics Industry Volume (mg), by Country 2024 & 2032
- Figure 69: Asia Pacific Pulmonary Embolism Therapeutics Industry Revenue Share (%), by Country 2024 & 2032
- Figure 70: Asia Pacific Pulmonary Embolism Therapeutics Industry Volume Share (%), by Country 2024 & 2032
- Figure 71: Middle East and Africa Pulmonary Embolism Therapeutics Industry Revenue (Billion), by Drug Class 2024 & 2032
- Figure 72: Middle East and Africa Pulmonary Embolism Therapeutics Industry Volume (mg), by Drug Class 2024 & 2032
- Figure 73: Middle East and Africa Pulmonary Embolism Therapeutics Industry Revenue Share (%), by Drug Class 2024 & 2032
- Figure 74: Middle East and Africa Pulmonary Embolism Therapeutics Industry Volume Share (%), by Drug Class 2024 & 2032
- Figure 75: Middle East and Africa Pulmonary Embolism Therapeutics Industry Revenue (Billion), by Disease Type 2024 & 2032
- Figure 76: Middle East and Africa Pulmonary Embolism Therapeutics Industry Volume (mg), by Disease Type 2024 & 2032
- Figure 77: Middle East and Africa Pulmonary Embolism Therapeutics Industry Revenue Share (%), by Disease Type 2024 & 2032
- Figure 78: Middle East and Africa Pulmonary Embolism Therapeutics Industry Volume Share (%), by Disease Type 2024 & 2032
- Figure 79: Middle East and Africa Pulmonary Embolism Therapeutics Industry Revenue (Billion), by Distribution Channel 2024 & 2032
- Figure 80: Middle East and Africa Pulmonary Embolism Therapeutics Industry Volume (mg), by Distribution Channel 2024 & 2032
- Figure 81: Middle East and Africa Pulmonary Embolism Therapeutics Industry Revenue Share (%), by Distribution Channel 2024 & 2032
- Figure 82: Middle East and Africa Pulmonary Embolism Therapeutics Industry Volume Share (%), by Distribution Channel 2024 & 2032
- Figure 83: Middle East and Africa Pulmonary Embolism Therapeutics Industry Revenue (Billion), by Country 2024 & 2032
- Figure 84: Middle East and Africa Pulmonary Embolism Therapeutics Industry Volume (mg), by Country 2024 & 2032
- Figure 85: Middle East and Africa Pulmonary Embolism Therapeutics Industry Revenue Share (%), by Country 2024 & 2032
- Figure 86: Middle East and Africa Pulmonary Embolism Therapeutics Industry Volume Share (%), by Country 2024 & 2032
- Figure 87: South America Pulmonary Embolism Therapeutics Industry Revenue (Billion), by Drug Class 2024 & 2032
- Figure 88: South America Pulmonary Embolism Therapeutics Industry Volume (mg), by Drug Class 2024 & 2032
- Figure 89: South America Pulmonary Embolism Therapeutics Industry Revenue Share (%), by Drug Class 2024 & 2032
- Figure 90: South America Pulmonary Embolism Therapeutics Industry Volume Share (%), by Drug Class 2024 & 2032
- Figure 91: South America Pulmonary Embolism Therapeutics Industry Revenue (Billion), by Disease Type 2024 & 2032
- Figure 92: South America Pulmonary Embolism Therapeutics Industry Volume (mg), by Disease Type 2024 & 2032
- Figure 93: South America Pulmonary Embolism Therapeutics Industry Revenue Share (%), by Disease Type 2024 & 2032
- Figure 94: South America Pulmonary Embolism Therapeutics Industry Volume Share (%), by Disease Type 2024 & 2032
- Figure 95: South America Pulmonary Embolism Therapeutics Industry Revenue (Billion), by Distribution Channel 2024 & 2032
- Figure 96: South America Pulmonary Embolism Therapeutics Industry Volume (mg), by Distribution Channel 2024 & 2032
- Figure 97: South America Pulmonary Embolism Therapeutics Industry Revenue Share (%), by Distribution Channel 2024 & 2032
- Figure 98: South America Pulmonary Embolism Therapeutics Industry Volume Share (%), by Distribution Channel 2024 & 2032
- Figure 99: South America Pulmonary Embolism Therapeutics Industry Revenue (Billion), by Country 2024 & 2032
- Figure 100: South America Pulmonary Embolism Therapeutics Industry Volume (mg), by Country 2024 & 2032
- Figure 101: South America Pulmonary Embolism Therapeutics Industry Revenue Share (%), by Country 2024 & 2032
- Figure 102: South America Pulmonary Embolism Therapeutics Industry Volume Share (%), by Country 2024 & 2032
List of Tables
- Table 1: Global Pulmonary Embolism Therapeutics Industry Revenue Billion Forecast, by Region 2019 & 2032
- Table 2: Global Pulmonary Embolism Therapeutics Industry Volume mg Forecast, by Region 2019 & 2032
- Table 3: Global Pulmonary Embolism Therapeutics Industry Revenue Billion Forecast, by Drug Class 2019 & 2032
- Table 4: Global Pulmonary Embolism Therapeutics Industry Volume mg Forecast, by Drug Class 2019 & 2032
- Table 5: Global Pulmonary Embolism Therapeutics Industry Revenue Billion Forecast, by Disease Type 2019 & 2032
- Table 6: Global Pulmonary Embolism Therapeutics Industry Volume mg Forecast, by Disease Type 2019 & 2032
- Table 7: Global Pulmonary Embolism Therapeutics Industry Revenue Billion Forecast, by Distribution Channel 2019 & 2032
- Table 8: Global Pulmonary Embolism Therapeutics Industry Volume mg Forecast, by Distribution Channel 2019 & 2032
- Table 9: Global Pulmonary Embolism Therapeutics Industry Revenue Billion Forecast, by Region 2019 & 2032
- Table 10: Global Pulmonary Embolism Therapeutics Industry Volume mg Forecast, by Region 2019 & 2032
- Table 11: Global Pulmonary Embolism Therapeutics Industry Revenue Billion Forecast, by Country 2019 & 2032
- Table 12: Global Pulmonary Embolism Therapeutics Industry Volume mg Forecast, by Country 2019 & 2032
- Table 13: United States Pulmonary Embolism Therapeutics Industry Revenue (Billion) Forecast, by Application 2019 & 2032
- Table 14: United States Pulmonary Embolism Therapeutics Industry Volume (mg) Forecast, by Application 2019 & 2032
- Table 15: Canada Pulmonary Embolism Therapeutics Industry Revenue (Billion) Forecast, by Application 2019 & 2032
- Table 16: Canada Pulmonary Embolism Therapeutics Industry Volume (mg) Forecast, by Application 2019 & 2032
- Table 17: Mexico Pulmonary Embolism Therapeutics Industry Revenue (Billion) Forecast, by Application 2019 & 2032
- Table 18: Mexico Pulmonary Embolism Therapeutics Industry Volume (mg) Forecast, by Application 2019 & 2032
- Table 19: Global Pulmonary Embolism Therapeutics Industry Revenue Billion Forecast, by Country 2019 & 2032
- Table 20: Global Pulmonary Embolism Therapeutics Industry Volume mg Forecast, by Country 2019 & 2032
- Table 21: Germany Pulmonary Embolism Therapeutics Industry Revenue (Billion) Forecast, by Application 2019 & 2032
- Table 22: Germany Pulmonary Embolism Therapeutics Industry Volume (mg) Forecast, by Application 2019 & 2032
- Table 23: United Kingdom Pulmonary Embolism Therapeutics Industry Revenue (Billion) Forecast, by Application 2019 & 2032
- Table 24: United Kingdom Pulmonary Embolism Therapeutics Industry Volume (mg) Forecast, by Application 2019 & 2032
- Table 25: France Pulmonary Embolism Therapeutics Industry Revenue (Billion) Forecast, by Application 2019 & 2032
- Table 26: France Pulmonary Embolism Therapeutics Industry Volume (mg) Forecast, by Application 2019 & 2032
- Table 27: Italy Pulmonary Embolism Therapeutics Industry Revenue (Billion) Forecast, by Application 2019 & 2032
- Table 28: Italy Pulmonary Embolism Therapeutics Industry Volume (mg) Forecast, by Application 2019 & 2032
- Table 29: Spain Pulmonary Embolism Therapeutics Industry Revenue (Billion) Forecast, by Application 2019 & 2032
- Table 30: Spain Pulmonary Embolism Therapeutics Industry Volume (mg) Forecast, by Application 2019 & 2032
- Table 31: Rest of Europe Pulmonary Embolism Therapeutics Industry Revenue (Billion) Forecast, by Application 2019 & 2032
- Table 32: Rest of Europe Pulmonary Embolism Therapeutics Industry Volume (mg) Forecast, by Application 2019 & 2032
- Table 33: Global Pulmonary Embolism Therapeutics Industry Revenue Billion Forecast, by Country 2019 & 2032
- Table 34: Global Pulmonary Embolism Therapeutics Industry Volume mg Forecast, by Country 2019 & 2032
- Table 35: China Pulmonary Embolism Therapeutics Industry Revenue (Billion) Forecast, by Application 2019 & 2032
- Table 36: China Pulmonary Embolism Therapeutics Industry Volume (mg) Forecast, by Application 2019 & 2032
- Table 37: Japan Pulmonary Embolism Therapeutics Industry Revenue (Billion) Forecast, by Application 2019 & 2032
- Table 38: Japan Pulmonary Embolism Therapeutics Industry Volume (mg) Forecast, by Application 2019 & 2032
- Table 39: India Pulmonary Embolism Therapeutics Industry Revenue (Billion) Forecast, by Application 2019 & 2032
- Table 40: India Pulmonary Embolism Therapeutics Industry Volume (mg) Forecast, by Application 2019 & 2032
- Table 41: Australia Pulmonary Embolism Therapeutics Industry Revenue (Billion) Forecast, by Application 2019 & 2032
- Table 42: Australia Pulmonary Embolism Therapeutics Industry Volume (mg) Forecast, by Application 2019 & 2032
- Table 43: South Korea Pulmonary Embolism Therapeutics Industry Revenue (Billion) Forecast, by Application 2019 & 2032
- Table 44: South Korea Pulmonary Embolism Therapeutics Industry Volume (mg) Forecast, by Application 2019 & 2032
- Table 45: Rest of Asia Pacific Pulmonary Embolism Therapeutics Industry Revenue (Billion) Forecast, by Application 2019 & 2032
- Table 46: Rest of Asia Pacific Pulmonary Embolism Therapeutics Industry Volume (mg) Forecast, by Application 2019 & 2032
- Table 47: Global Pulmonary Embolism Therapeutics Industry Revenue Billion Forecast, by Country 2019 & 2032
- Table 48: Global Pulmonary Embolism Therapeutics Industry Volume mg Forecast, by Country 2019 & 2032
- Table 49: GCC Pulmonary Embolism Therapeutics Industry Revenue (Billion) Forecast, by Application 2019 & 2032
- Table 50: GCC Pulmonary Embolism Therapeutics Industry Volume (mg) Forecast, by Application 2019 & 2032
- Table 51: South Africa Pulmonary Embolism Therapeutics Industry Revenue (Billion) Forecast, by Application 2019 & 2032
- Table 52: South Africa Pulmonary Embolism Therapeutics Industry Volume (mg) Forecast, by Application 2019 & 2032
- Table 53: Rest of Middle East and Africa Pulmonary Embolism Therapeutics Industry Revenue (Billion) Forecast, by Application 2019 & 2032
- Table 54: Rest of Middle East and Africa Pulmonary Embolism Therapeutics Industry Volume (mg) Forecast, by Application 2019 & 2032
- Table 55: Global Pulmonary Embolism Therapeutics Industry Revenue Billion Forecast, by Country 2019 & 2032
- Table 56: Global Pulmonary Embolism Therapeutics Industry Volume mg Forecast, by Country 2019 & 2032
- Table 57: Brazil Pulmonary Embolism Therapeutics Industry Revenue (Billion) Forecast, by Application 2019 & 2032
- Table 58: Brazil Pulmonary Embolism Therapeutics Industry Volume (mg) Forecast, by Application 2019 & 2032
- Table 59: Argentina Pulmonary Embolism Therapeutics Industry Revenue (Billion) Forecast, by Application 2019 & 2032
- Table 60: Argentina Pulmonary Embolism Therapeutics Industry Volume (mg) Forecast, by Application 2019 & 2032
- Table 61: Rest of South America Pulmonary Embolism Therapeutics Industry Revenue (Billion) Forecast, by Application 2019 & 2032
- Table 62: Rest of South America Pulmonary Embolism Therapeutics Industry Volume (mg) Forecast, by Application 2019 & 2032
- Table 63: Global Pulmonary Embolism Therapeutics Industry Revenue Billion Forecast, by Drug Class 2019 & 2032
- Table 64: Global Pulmonary Embolism Therapeutics Industry Volume mg Forecast, by Drug Class 2019 & 2032
- Table 65: Global Pulmonary Embolism Therapeutics Industry Revenue Billion Forecast, by Disease Type 2019 & 2032
- Table 66: Global Pulmonary Embolism Therapeutics Industry Volume mg Forecast, by Disease Type 2019 & 2032
- Table 67: Global Pulmonary Embolism Therapeutics Industry Revenue Billion Forecast, by Distribution Channel 2019 & 2032
- Table 68: Global Pulmonary Embolism Therapeutics Industry Volume mg Forecast, by Distribution Channel 2019 & 2032
- Table 69: Global Pulmonary Embolism Therapeutics Industry Revenue Billion Forecast, by Country 2019 & 2032
- Table 70: Global Pulmonary Embolism Therapeutics Industry Volume mg Forecast, by Country 2019 & 2032
- Table 71: United States Pulmonary Embolism Therapeutics Industry Revenue (Billion) Forecast, by Application 2019 & 2032
- Table 72: United States Pulmonary Embolism Therapeutics Industry Volume (mg) Forecast, by Application 2019 & 2032
- Table 73: Canada Pulmonary Embolism Therapeutics Industry Revenue (Billion) Forecast, by Application 2019 & 2032
- Table 74: Canada Pulmonary Embolism Therapeutics Industry Volume (mg) Forecast, by Application 2019 & 2032
- Table 75: Mexico Pulmonary Embolism Therapeutics Industry Revenue (Billion) Forecast, by Application 2019 & 2032
- Table 76: Mexico Pulmonary Embolism Therapeutics Industry Volume (mg) Forecast, by Application 2019 & 2032
- Table 77: Global Pulmonary Embolism Therapeutics Industry Revenue Billion Forecast, by Drug Class 2019 & 2032
- Table 78: Global Pulmonary Embolism Therapeutics Industry Volume mg Forecast, by Drug Class 2019 & 2032
- Table 79: Global Pulmonary Embolism Therapeutics Industry Revenue Billion Forecast, by Disease Type 2019 & 2032
- Table 80: Global Pulmonary Embolism Therapeutics Industry Volume mg Forecast, by Disease Type 2019 & 2032
- Table 81: Global Pulmonary Embolism Therapeutics Industry Revenue Billion Forecast, by Distribution Channel 2019 & 2032
- Table 82: Global Pulmonary Embolism Therapeutics Industry Volume mg Forecast, by Distribution Channel 2019 & 2032
- Table 83: Global Pulmonary Embolism Therapeutics Industry Revenue Billion Forecast, by Country 2019 & 2032
- Table 84: Global Pulmonary Embolism Therapeutics Industry Volume mg Forecast, by Country 2019 & 2032
- Table 85: Germany Pulmonary Embolism Therapeutics Industry Revenue (Billion) Forecast, by Application 2019 & 2032
- Table 86: Germany Pulmonary Embolism Therapeutics Industry Volume (mg) Forecast, by Application 2019 & 2032
- Table 87: United Kingdom Pulmonary Embolism Therapeutics Industry Revenue (Billion) Forecast, by Application 2019 & 2032
- Table 88: United Kingdom Pulmonary Embolism Therapeutics Industry Volume (mg) Forecast, by Application 2019 & 2032
- Table 89: France Pulmonary Embolism Therapeutics Industry Revenue (Billion) Forecast, by Application 2019 & 2032
- Table 90: France Pulmonary Embolism Therapeutics Industry Volume (mg) Forecast, by Application 2019 & 2032
- Table 91: Italy Pulmonary Embolism Therapeutics Industry Revenue (Billion) Forecast, by Application 2019 & 2032
- Table 92: Italy Pulmonary Embolism Therapeutics Industry Volume (mg) Forecast, by Application 2019 & 2032
- Table 93: Spain Pulmonary Embolism Therapeutics Industry Revenue (Billion) Forecast, by Application 2019 & 2032
- Table 94: Spain Pulmonary Embolism Therapeutics Industry Volume (mg) Forecast, by Application 2019 & 2032
- Table 95: Rest of Europe Pulmonary Embolism Therapeutics Industry Revenue (Billion) Forecast, by Application 2019 & 2032
- Table 96: Rest of Europe Pulmonary Embolism Therapeutics Industry Volume (mg) Forecast, by Application 2019 & 2032
- Table 97: Global Pulmonary Embolism Therapeutics Industry Revenue Billion Forecast, by Drug Class 2019 & 2032
- Table 98: Global Pulmonary Embolism Therapeutics Industry Volume mg Forecast, by Drug Class 2019 & 2032
- Table 99: Global Pulmonary Embolism Therapeutics Industry Revenue Billion Forecast, by Disease Type 2019 & 2032
- Table 100: Global Pulmonary Embolism Therapeutics Industry Volume mg Forecast, by Disease Type 2019 & 2032
- Table 101: Global Pulmonary Embolism Therapeutics Industry Revenue Billion Forecast, by Distribution Channel 2019 & 2032
- Table 102: Global Pulmonary Embolism Therapeutics Industry Volume mg Forecast, by Distribution Channel 2019 & 2032
- Table 103: Global Pulmonary Embolism Therapeutics Industry Revenue Billion Forecast, by Country 2019 & 2032
- Table 104: Global Pulmonary Embolism Therapeutics Industry Volume mg Forecast, by Country 2019 & 2032
- Table 105: China Pulmonary Embolism Therapeutics Industry Revenue (Billion) Forecast, by Application 2019 & 2032
- Table 106: China Pulmonary Embolism Therapeutics Industry Volume (mg) Forecast, by Application 2019 & 2032
- Table 107: Japan Pulmonary Embolism Therapeutics Industry Revenue (Billion) Forecast, by Application 2019 & 2032
- Table 108: Japan Pulmonary Embolism Therapeutics Industry Volume (mg) Forecast, by Application 2019 & 2032
- Table 109: India Pulmonary Embolism Therapeutics Industry Revenue (Billion) Forecast, by Application 2019 & 2032
- Table 110: India Pulmonary Embolism Therapeutics Industry Volume (mg) Forecast, by Application 2019 & 2032
- Table 111: Australia Pulmonary Embolism Therapeutics Industry Revenue (Billion) Forecast, by Application 2019 & 2032
- Table 112: Australia Pulmonary Embolism Therapeutics Industry Volume (mg) Forecast, by Application 2019 & 2032
- Table 113: South Korea Pulmonary Embolism Therapeutics Industry Revenue (Billion) Forecast, by Application 2019 & 2032
- Table 114: South Korea Pulmonary Embolism Therapeutics Industry Volume (mg) Forecast, by Application 2019 & 2032
- Table 115: Rest of Asia Pacific Pulmonary Embolism Therapeutics Industry Revenue (Billion) Forecast, by Application 2019 & 2032
- Table 116: Rest of Asia Pacific Pulmonary Embolism Therapeutics Industry Volume (mg) Forecast, by Application 2019 & 2032
- Table 117: Global Pulmonary Embolism Therapeutics Industry Revenue Billion Forecast, by Drug Class 2019 & 2032
- Table 118: Global Pulmonary Embolism Therapeutics Industry Volume mg Forecast, by Drug Class 2019 & 2032
- Table 119: Global Pulmonary Embolism Therapeutics Industry Revenue Billion Forecast, by Disease Type 2019 & 2032
- Table 120: Global Pulmonary Embolism Therapeutics Industry Volume mg Forecast, by Disease Type 2019 & 2032
- Table 121: Global Pulmonary Embolism Therapeutics Industry Revenue Billion Forecast, by Distribution Channel 2019 & 2032
- Table 122: Global Pulmonary Embolism Therapeutics Industry Volume mg Forecast, by Distribution Channel 2019 & 2032
- Table 123: Global Pulmonary Embolism Therapeutics Industry Revenue Billion Forecast, by Country 2019 & 2032
- Table 124: Global Pulmonary Embolism Therapeutics Industry Volume mg Forecast, by Country 2019 & 2032
- Table 125: GCC Pulmonary Embolism Therapeutics Industry Revenue (Billion) Forecast, by Application 2019 & 2032
- Table 126: GCC Pulmonary Embolism Therapeutics Industry Volume (mg) Forecast, by Application 2019 & 2032
- Table 127: South Africa Pulmonary Embolism Therapeutics Industry Revenue (Billion) Forecast, by Application 2019 & 2032
- Table 128: South Africa Pulmonary Embolism Therapeutics Industry Volume (mg) Forecast, by Application 2019 & 2032
- Table 129: Rest of Middle East and Africa Pulmonary Embolism Therapeutics Industry Revenue (Billion) Forecast, by Application 2019 & 2032
- Table 130: Rest of Middle East and Africa Pulmonary Embolism Therapeutics Industry Volume (mg) Forecast, by Application 2019 & 2032
- Table 131: Global Pulmonary Embolism Therapeutics Industry Revenue Billion Forecast, by Drug Class 2019 & 2032
- Table 132: Global Pulmonary Embolism Therapeutics Industry Volume mg Forecast, by Drug Class 2019 & 2032
- Table 133: Global Pulmonary Embolism Therapeutics Industry Revenue Billion Forecast, by Disease Type 2019 & 2032
- Table 134: Global Pulmonary Embolism Therapeutics Industry Volume mg Forecast, by Disease Type 2019 & 2032
- Table 135: Global Pulmonary Embolism Therapeutics Industry Revenue Billion Forecast, by Distribution Channel 2019 & 2032
- Table 136: Global Pulmonary Embolism Therapeutics Industry Volume mg Forecast, by Distribution Channel 2019 & 2032
- Table 137: Global Pulmonary Embolism Therapeutics Industry Revenue Billion Forecast, by Country 2019 & 2032
- Table 138: Global Pulmonary Embolism Therapeutics Industry Volume mg Forecast, by Country 2019 & 2032
- Table 139: Brazil Pulmonary Embolism Therapeutics Industry Revenue (Billion) Forecast, by Application 2019 & 2032
- Table 140: Brazil Pulmonary Embolism Therapeutics Industry Volume (mg) Forecast, by Application 2019 & 2032
- Table 141: Argentina Pulmonary Embolism Therapeutics Industry Revenue (Billion) Forecast, by Application 2019 & 2032
- Table 142: Argentina Pulmonary Embolism Therapeutics Industry Volume (mg) Forecast, by Application 2019 & 2032
- Table 143: Rest of South America Pulmonary Embolism Therapeutics Industry Revenue (Billion) Forecast, by Application 2019 & 2032
- Table 144: Rest of South America Pulmonary Embolism Therapeutics Industry Volume (mg) Forecast, by Application 2019 & 2032
Frequently Asked Questions
1. What is the projected Compound Annual Growth Rate (CAGR) of the Pulmonary Embolism Therapeutics Industry?
The projected CAGR is approximately 9.00%.
2. Which companies are prominent players in the Pulmonary Embolism Therapeutics Industry?
Key companies in the market include Sanofi SA, Boehringer Ingelheim GmbH, Bayer AG, AstraZeneca PLC, Bristol-Myers Squibb, Teva Pharmaceutical Industries Ltd, Johnson & Johnson, Swiss Pharma Pvt Ltd*List Not Exhaustive, Laurus Lab (Aspen Pharmacare Holdings Limited), Pfizer Inc.
3. What are the main segments of the Pulmonary Embolism Therapeutics Industry?
The market segments include Drug Class, Disease Type, Distribution Channel.
4. Can you provide details about the market size?
The market size is estimated to be USD 1.13 Billion as of 2022.
5. What are some drivers contributing to market growth?
Growing Geriatric and Obese Population; Increasing Burden of Cardiovascular and Trauma Cases; Increasing Technological Advancements in Hematology.
6. What are the notable trends driving market growth?
Deep Vein Thrombosis (DVT) Segment is Expected to Register a Significant Growth during the Forecast Period.
7. Are there any restraints impacting market growth?
Lack of Awareness about Venous Thromboembolism Conditions; Side Effects Caused. due to Thrombosis Drugs.
8. Can you provide examples of recent developments in the market?
February 2023: Bayer announced that first patients had been enrolled in the initial trials for its OCEANIC clinical trial program, designed to explore the use of asundexian (BAY2433334), an investigational oral Factor XIa (FXIa) inhibitor, in patients with atrial fibrillation (AF) and in patients with a non-cardioembolic ischemic stroke or high-risk transient ischemic attack (TIA), a temporary period of symptoms similar to those of a stroke.
9. What pricing options are available for accessing the report?
Pricing options include single-user, multi-user, and enterprise licenses priced at USD 4750, USD 5250, and USD 8750 respectively.
10. Is the market size provided in terms of value or volume?
The market size is provided in terms of value, measured in Billion and volume, measured in mg.
11. Are there any specific market keywords associated with the report?
Yes, the market keyword associated with the report is "Pulmonary Embolism Therapeutics Industry," which aids in identifying and referencing the specific market segment covered.
12. How do I determine which pricing option suits my needs best?
The pricing options vary based on user requirements and access needs. Individual users may opt for single-user licenses, while businesses requiring broader access may choose multi-user or enterprise licenses for cost-effective access to the report.
13. Are there any additional resources or data provided in the Pulmonary Embolism Therapeutics Industry report?
While the report offers comprehensive insights, it's advisable to review the specific contents or supplementary materials provided to ascertain if additional resources or data are available.
14. How can I stay updated on further developments or reports in the Pulmonary Embolism Therapeutics Industry?
To stay informed about further developments, trends, and reports in the Pulmonary Embolism Therapeutics Industry, consider subscribing to industry newsletters, following relevant companies and organizations, or regularly checking reputable industry news sources and publications.
Methodology
Step 1 - Identification of Relevant Samples Size from Population Database


Step 2 - Approaches for Defining Global Market Size (Value, Volume* & Price*)

Note*: In applicable scenarios
Step 3 - Data Sources
Primary Research
- Web Analytics
- Survey Reports
- Research Institute
- Latest Research Reports
- Opinion Leaders
Secondary Research
- Annual Reports
- White Paper
- Latest Press Release
- Industry Association
- Paid Database
- Investor Presentations

Step 4 - Data Triangulation
Involves using different sources of information in order to increase the validity of a study
These sources are likely to be stakeholders in a program - participants, other researchers, program staff, other community members, and so on.
Then we put all data in single framework & apply various statistical tools to find out the dynamic on the market.
During the analysis stage, feedback from the stakeholder groups would be compared to determine areas of agreement as well as areas of divergence


