


Key Insights
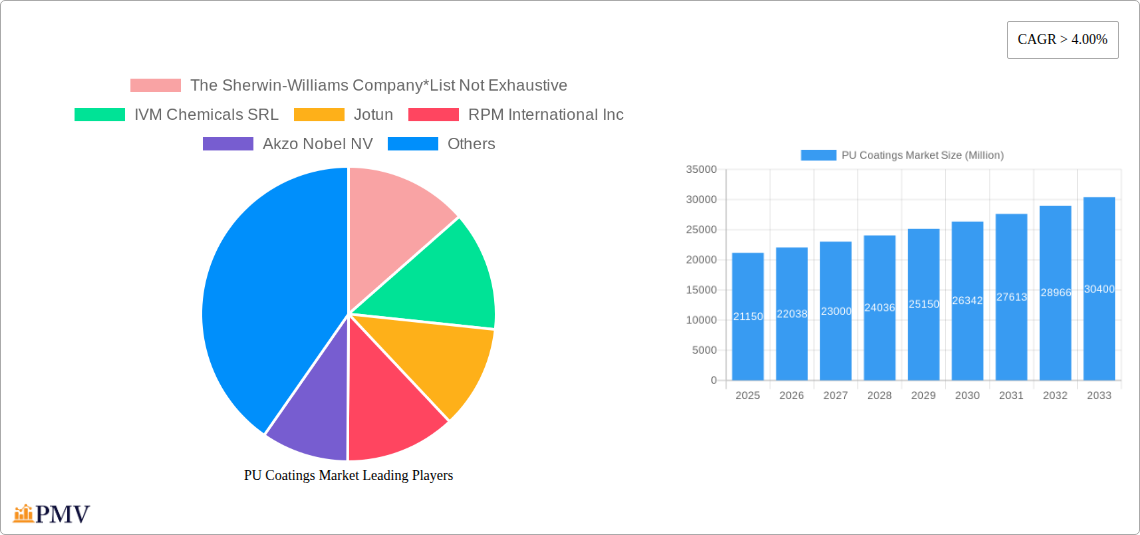
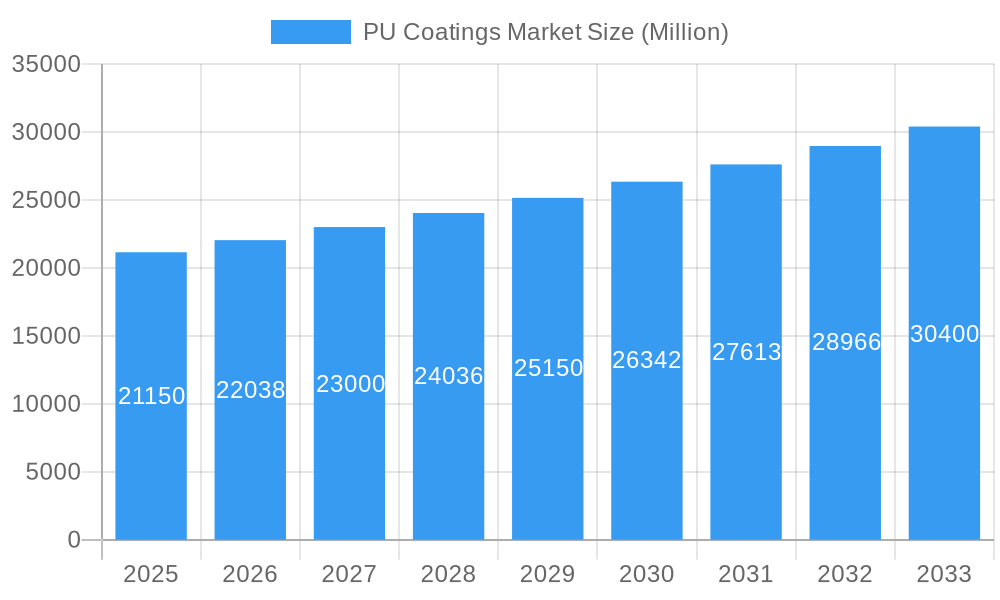
The global polyurethane (PU) coatings market, valued at $21.15 billion in 2025, is projected to experience robust growth, exceeding a 4% CAGR from 2025 to 2033. This expansion is driven by several key factors. The automotive industry's increasing demand for high-performance, durable coatings fuels significant market share. Similarly, the construction sector's reliance on PU coatings for protective and aesthetic purposes contributes substantially to market growth. The rising adoption of eco-friendly water-borne PU coatings, driven by stricter environmental regulations and growing sustainability concerns, is a prominent trend reshaping the market landscape. Technological advancements in radiation-cured PU coatings, offering faster curing times and enhanced performance, further bolster market expansion. However, fluctuating raw material prices and potential supply chain disruptions pose challenges to consistent market growth. The market is segmented by end-user industry (automotive, transportation, construction, electrical & electronics, wood & furniture, aerospace, industrial, and textile) and technology (powder, solvent-borne, water-borne, radiation cured). Leading players such as Sherwin-Williams, Jotun, Akzo Nobel, and BASF are actively engaged in product innovation and strategic partnerships to maintain their competitive edge. Geographical analysis reveals strong growth potential in the Asia-Pacific region, particularly in China and India, driven by rapid industrialization and infrastructure development.
PU Coatings Market Market Size (In Billion)

The competitive landscape is characterized by both established multinational corporations and regional players. Companies are focusing on developing high-performance, specialized coatings catering to specific end-user needs, such as corrosion resistance for the construction industry or scratch resistance for the automotive sector. The market's future trajectory hinges on the continued adoption of sustainable technologies, technological innovations leading to enhanced performance characteristics, and the ability of manufacturers to navigate potential supply chain challenges. The ongoing development of novel PU coating formulations with enhanced functionalities, such as self-healing properties or improved UV resistance, will further shape the market dynamics in the coming years. This dynamic interplay of factors promises sustained growth for the PU coatings market throughout the forecast period.
PU Coatings Market Company Market Share
PU Coatings Market: A Comprehensive Report (2019-2033)
This in-depth report provides a comprehensive analysis of the global PU Coatings market, offering invaluable insights for industry stakeholders. Covering the period from 2019 to 2033, with a focus on 2025, this report meticulously examines market dynamics, competitive landscapes, and future growth prospects. The study includes detailed segmentation by end-user industry (Automotive, Transportation, Construction, Electrical & Electronics, Wood & Furniture, Aerospace, Industrial, Textile, and Others) and technology (Powder, Solvent-borne, Water-borne, and Radiation Cured). The report leverages extensive data analysis to provide actionable insights and strategic recommendations.
PU Coatings Market Structure & Competitive Dynamics
The PU Coatings market exhibits a moderately consolidated structure, with several key players commanding significant market share. The competitive landscape is characterized by intense rivalry, driven by product innovation, pricing strategies, and mergers and acquisitions (M&A) activities. The market's innovation ecosystem is dynamic, with continuous advancements in coating technologies aimed at improving performance, durability, and sustainability. Regulatory frameworks, particularly concerning environmental regulations (like VOC emissions), significantly impact market dynamics and necessitate compliance from manufacturers. Product substitutes, such as epoxy and acrylic coatings, pose a competitive threat, though PU coatings retain a strong position due to their superior properties. End-user trends toward high-performance, sustainable, and aesthetically appealing coatings are driving innovation and market growth.
M&A activity plays a crucial role in shaping the market landscape. Recent deals, such as the October 2023 acquisition of SK pucore by Glenwood Private Equity for USD 304.1 Million, highlight the ongoing consolidation and strategic repositioning within the industry. Market share data reveals that the top five players collectively account for approximately xx% of the global market, with The Sherwin-Williams Company, Akzo Nobel NV, and PPG Industries Inc. among the leading players. Further analysis details individual company market share and M&A deal values over the historical period.
PU Coatings Market Industry Trends & Insights
The global PU Coatings market is experiencing robust growth, driven by several factors. The increasing demand from the construction, automotive, and furniture industries is a key driver, fueled by urbanization, infrastructure development, and rising disposable incomes. Technological advancements, such as the development of water-borne and radiation-cured PU coatings, are enhancing product performance and sustainability, thereby boosting market penetration. Consumer preferences are shifting toward eco-friendly and high-performance coatings, prompting manufacturers to invest in research and development to meet these demands. The competitive dynamics are characterized by ongoing innovation, strategic partnerships, and capacity expansion, shaping the market trajectory. The market is projected to register a CAGR of xx% during the forecast period (2025-2033), with significant growth potential in emerging economies. Market penetration rates vary across different segments and regions, with higher penetration in developed markets and increasing growth in developing countries.
Dominant Markets & Segments in PU Coatings Market
The construction sector represents a dominant end-user industry for PU coatings, driven by robust infrastructure development globally. Within technologies, solvent-borne PU coatings currently hold the largest market share, but water-borne coatings are gaining traction due to their environmental benefits. Regionally, Asia-Pacific exhibits the highest growth potential due to rapid economic expansion and infrastructure investment.
- Key Drivers in Construction: Government investments in infrastructure projects, increasing urbanization, rising construction activities in emerging economies.
- Key Drivers in Automotive: Demand for lightweight vehicles, improved fuel efficiency, and enhanced aesthetics.
- Key Drivers in Asia-Pacific: Rapid industrialization, urbanization, and significant investments in infrastructure.
The detailed dominance analysis examines factors driving leadership in each segment, including economic policies, regulatory frameworks, and infrastructure development. The dominance analysis also explores the competitive landscape within each segment, identifying key players and their market strategies.
PU Coatings Market Product Innovations
Recent innovations in PU coatings focus on enhancing performance characteristics like durability, flexibility, and chemical resistance. The development of high-performance water-borne and radiation-cured PU coatings addresses growing environmental concerns and expands application possibilities. These innovations offer superior properties compared to traditional solvent-borne systems, enhancing market fit and providing competitive advantages. The integration of nanotechnology and advanced additives further improves the properties of PU coatings.
Report Segmentation & Scope
This report segments the PU Coatings market by end-user industry and technology.
End-user Industries: Automotive, Transportation, Construction, Electrical & Electronics, Wood & Furniture, Aerospace, Industrial, Textile, and Others. Each segment's growth trajectory is assessed based on market size, growth projections, and competitive dynamics.
Technology: Powder, Solvent-borne, Water-borne, and Radiation Cured. Each technology segment's market size, growth projections, and competitive landscape are analyzed.
Key Drivers of PU Coatings Market Growth
The PU Coatings market's growth is fueled by several key factors. Technological advancements leading to improved performance and sustainability are a primary driver. Economic growth, particularly in developing economies, is boosting demand across various end-user industries. Favorable government policies and regulations supporting sustainable construction and manufacturing further enhance market growth. Examples include incentives for green buildings and stricter environmental regulations promoting water-borne coatings.
Challenges in the PU Coatings Market Sector
The PU Coatings market faces several challenges. Fluctuations in raw material prices and supply chain disruptions can impact profitability and product availability. Stringent environmental regulations necessitate compliance, increasing production costs. Intense competition among established players and new entrants presents a constant challenge. The quantification of these impacts varies based on geographic location and specific segment but generally leads to reduced profitability margins.
Leading Players in the PU Coatings Market
- The Sherwin-Williams Company
- IVM Chemicals SRL
- Jotun
- RPM International Inc
- Akzo Nobel NV
- PPG Industries Inc
- BASF SE
- Axalta Coating Systems
- Asian Paints
- Polycoat Products
Key Developments in PU Coatings Market Sector
- October 2023: SKC sold its 100% shares of SK pucore, a polyurethane manufacturer, to Glenwood Private Equity for USD 304.1 Million, signifying consolidation in the polyurethane manufacturing sector.
- August 2023: Covestro initiated production at its new Shanghai plant for polyurethane elastomer systems, indicating significant investment in expanding production capacity in the Asia-Pacific region.
Strategic PU Coatings Market Outlook
The PU Coatings market is poised for continued growth, driven by technological innovation, increasing demand from key end-user sectors, and favorable economic conditions in several regions. Strategic opportunities lie in developing sustainable and high-performance coatings to meet evolving consumer preferences. Focusing on emerging markets and leveraging technological advancements will be crucial for achieving sustained growth and market leadership. The focus on water-borne and radiation-cured technologies will offer significant competitive advantages in the future.
PU Coatings Market Segmentation
-
1. Technology
- 1.1. Powder
- 1.2. Solvent-borne
- 1.3. Water-borne
- 1.4. Radiation Cured
-
2. End-user Industry
- 2.1. Automotive
- 2.2. Transportation
- 2.3. Construction
- 2.4. Electrical and Electronics
- 2.5. Wood and Furniture
- 2.6. Others E
PU Coatings Market Segmentation By Geography
-
1. Asia Pacific
- 1.1. China
- 1.2. India
- 1.3. Japan
- 1.4. South Korea
- 1.5. Rest of Asia Pacific
-
2. North America
- 2.1. United States
- 2.2. Canada
- 2.3. Mexico
-
3. Europe
- 3.1. Germany
- 3.2. United Kingdom
- 3.3. Italy
- 3.4. France
- 3.5. Rest of Europe
-
4. South America
- 4.1. Brazil
- 4.2. Argentina
- 4.3. Rest of South America
-
5. Middle East and Africa
- 5.1. Saudi Arabia
- 5.2. South Africa
- 5.3. Rest of Middle East and Africa
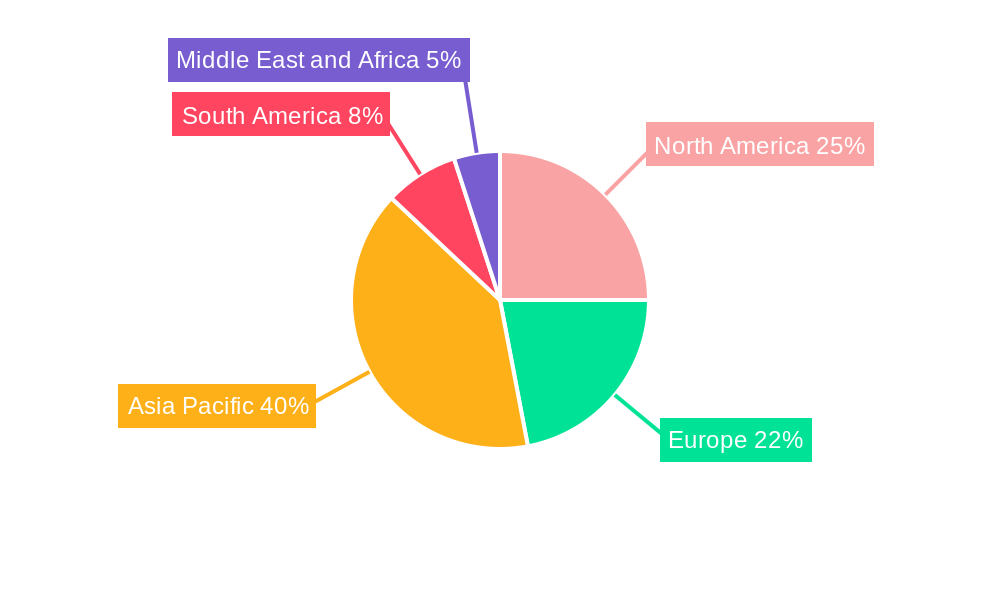
PU Coatings Market Regional Market Share
Geographic Coverage of PU Coatings Market
PU Coatings Market REPORT HIGHLIGHTS
| Aspects | Details |
|---|---|
| Study Period | 2020-2034 |
| Base Year | 2025 |
| Estimated Year | 2026 |
| Forecast Period | 2026-2034 |
| Historical Period | 2020-2025 |
| Growth Rate | CAGR of > 4.00% from 2020-2034 |
| Segmentation |
|
Table of Contents
- 1. Introduction
- 1.1. Research Scope
- 1.2. Market Segmentation
- 1.3. Research Methodology
- 1.4. Definitions and Assumptions
- 2. Executive Summary
- 2.1. Introduction
- 3. Market Dynamics
- 3.1. Introduction
- 3.2. Market Drivers
- 3.2.1. Growing Demand from the Construction Industry; Increase in Demand from the Automotive Industry; Growing Demand from the Transportation Industry
- 3.3. Market Restrains
- 3.3.1. Volatile Raw Material Prices; Other Restraints
- 3.4. Market Trends
- 3.4.1. Automotive Industry to Dominate the Market
- 4. Market Factor Analysis
- 4.1. Porters Five Forces
- 4.2. Supply/Value Chain
- 4.3. PESTEL analysis
- 4.4. Market Entropy
- 4.5. Patent/Trademark Analysis
- 5. Global PU Coatings Market Analysis, Insights and Forecast, 2020-2032
- 5.1. Market Analysis, Insights and Forecast - by Technology
- 5.1.1. Powder
- 5.1.2. Solvent-borne
- 5.1.3. Water-borne
- 5.1.4. Radiation Cured
- 5.2. Market Analysis, Insights and Forecast - by End-user Industry
- 5.2.1. Automotive
- 5.2.2. Transportation
- 5.2.3. Construction
- 5.2.4. Electrical and Electronics
- 5.2.5. Wood and Furniture
- 5.2.6. Others E
- 5.3. Market Analysis, Insights and Forecast - by Region
- 5.3.1. Asia Pacific
- 5.3.2. North America
- 5.3.3. Europe
- 5.3.4. South America
- 5.3.5. Middle East and Africa
- 5.1. Market Analysis, Insights and Forecast - by Technology
- 6. Asia Pacific PU Coatings Market Analysis, Insights and Forecast, 2020-2032
- 6.1. Market Analysis, Insights and Forecast - by Technology
- 6.1.1. Powder
- 6.1.2. Solvent-borne
- 6.1.3. Water-borne
- 6.1.4. Radiation Cured
- 6.2. Market Analysis, Insights and Forecast - by End-user Industry
- 6.2.1. Automotive
- 6.2.2. Transportation
- 6.2.3. Construction
- 6.2.4. Electrical and Electronics
- 6.2.5. Wood and Furniture
- 6.2.6. Others E
- 6.1. Market Analysis, Insights and Forecast - by Technology
- 7. North America PU Coatings Market Analysis, Insights and Forecast, 2020-2032
- 7.1. Market Analysis, Insights and Forecast - by Technology
- 7.1.1. Powder
- 7.1.2. Solvent-borne
- 7.1.3. Water-borne
- 7.1.4. Radiation Cured
- 7.2. Market Analysis, Insights and Forecast - by End-user Industry
- 7.2.1. Automotive
- 7.2.2. Transportation
- 7.2.3. Construction
- 7.2.4. Electrical and Electronics
- 7.2.5. Wood and Furniture
- 7.2.6. Others E
- 7.1. Market Analysis, Insights and Forecast - by Technology
- 8. Europe PU Coatings Market Analysis, Insights and Forecast, 2020-2032
- 8.1. Market Analysis, Insights and Forecast - by Technology
- 8.1.1. Powder
- 8.1.2. Solvent-borne
- 8.1.3. Water-borne
- 8.1.4. Radiation Cured
- 8.2. Market Analysis, Insights and Forecast - by End-user Industry
- 8.2.1. Automotive
- 8.2.2. Transportation
- 8.2.3. Construction
- 8.2.4. Electrical and Electronics
- 8.2.5. Wood and Furniture
- 8.2.6. Others E
- 8.1. Market Analysis, Insights and Forecast - by Technology
- 9. South America PU Coatings Market Analysis, Insights and Forecast, 2020-2032
- 9.1. Market Analysis, Insights and Forecast - by Technology
- 9.1.1. Powder
- 9.1.2. Solvent-borne
- 9.1.3. Water-borne
- 9.1.4. Radiation Cured
- 9.2. Market Analysis, Insights and Forecast - by End-user Industry
- 9.2.1. Automotive
- 9.2.2. Transportation
- 9.2.3. Construction
- 9.2.4. Electrical and Electronics
- 9.2.5. Wood and Furniture
- 9.2.6. Others E
- 9.1. Market Analysis, Insights and Forecast - by Technology
- 10. Middle East and Africa PU Coatings Market Analysis, Insights and Forecast, 2020-2032
- 10.1. Market Analysis, Insights and Forecast - by Technology
- 10.1.1. Powder
- 10.1.2. Solvent-borne
- 10.1.3. Water-borne
- 10.1.4. Radiation Cured
- 10.2. Market Analysis, Insights and Forecast - by End-user Industry
- 10.2.1. Automotive
- 10.2.2. Transportation
- 10.2.3. Construction
- 10.2.4. Electrical and Electronics
- 10.2.5. Wood and Furniture
- 10.2.6. Others E
- 10.1. Market Analysis, Insights and Forecast - by Technology
- 11. Competitive Analysis
- 11.1. Global Market Share Analysis 2025
- 11.2. Company Profiles
- 11.2.1 The Sherwin-Williams Company*List Not Exhaustive
- 11.2.1.1. Overview
- 11.2.1.2. Products
- 11.2.1.3. SWOT Analysis
- 11.2.1.4. Recent Developments
- 11.2.1.5. Financials (Based on Availability)
- 11.2.2 IVM Chemicals SRL
- 11.2.2.1. Overview
- 11.2.2.2. Products
- 11.2.2.3. SWOT Analysis
- 11.2.2.4. Recent Developments
- 11.2.2.5. Financials (Based on Availability)
- 11.2.3 Jotun
- 11.2.3.1. Overview
- 11.2.3.2. Products
- 11.2.3.3. SWOT Analysis
- 11.2.3.4. Recent Developments
- 11.2.3.5. Financials (Based on Availability)
- 11.2.4 RPM International Inc
- 11.2.4.1. Overview
- 11.2.4.2. Products
- 11.2.4.3. SWOT Analysis
- 11.2.4.4. Recent Developments
- 11.2.4.5. Financials (Based on Availability)
- 11.2.5 Akzo Nobel NV
- 11.2.5.1. Overview
- 11.2.5.2. Products
- 11.2.5.3. SWOT Analysis
- 11.2.5.4. Recent Developments
- 11.2.5.5. Financials (Based on Availability)
- 11.2.6 PPG Industries Inc
- 11.2.6.1. Overview
- 11.2.6.2. Products
- 11.2.6.3. SWOT Analysis
- 11.2.6.4. Recent Developments
- 11.2.6.5. Financials (Based on Availability)
- 11.2.7 BASF SE
- 11.2.7.1. Overview
- 11.2.7.2. Products
- 11.2.7.3. SWOT Analysis
- 11.2.7.4. Recent Developments
- 11.2.7.5. Financials (Based on Availability)
- 11.2.8 Axalta Coating Systems
- 11.2.8.1. Overview
- 11.2.8.2. Products
- 11.2.8.3. SWOT Analysis
- 11.2.8.4. Recent Developments
- 11.2.8.5. Financials (Based on Availability)
- 11.2.9 Asian Paints
- 11.2.9.1. Overview
- 11.2.9.2. Products
- 11.2.9.3. SWOT Analysis
- 11.2.9.4. Recent Developments
- 11.2.9.5. Financials (Based on Availability)
- 11.2.10 Polycoat Products
- 11.2.10.1. Overview
- 11.2.10.2. Products
- 11.2.10.3. SWOT Analysis
- 11.2.10.4. Recent Developments
- 11.2.10.5. Financials (Based on Availability)
- 11.2.1 The Sherwin-Williams Company*List Not Exhaustive
List of Figures
- Figure 1: Global PU Coatings Market Revenue Breakdown (Million, %) by Region 2025 & 2033
- Figure 2: Global PU Coatings Market Volume Breakdown (liter , %) by Region 2025 & 2033
- Figure 3: Asia Pacific PU Coatings Market Revenue (Million), by Technology 2025 & 2033
- Figure 4: Asia Pacific PU Coatings Market Volume (liter ), by Technology 2025 & 2033
- Figure 5: Asia Pacific PU Coatings Market Revenue Share (%), by Technology 2025 & 2033
- Figure 6: Asia Pacific PU Coatings Market Volume Share (%), by Technology 2025 & 2033
- Figure 7: Asia Pacific PU Coatings Market Revenue (Million), by End-user Industry 2025 & 2033
- Figure 8: Asia Pacific PU Coatings Market Volume (liter ), by End-user Industry 2025 & 2033
- Figure 9: Asia Pacific PU Coatings Market Revenue Share (%), by End-user Industry 2025 & 2033
- Figure 10: Asia Pacific PU Coatings Market Volume Share (%), by End-user Industry 2025 & 2033
- Figure 11: Asia Pacific PU Coatings Market Revenue (Million), by Country 2025 & 2033
- Figure 12: Asia Pacific PU Coatings Market Volume (liter ), by Country 2025 & 2033
- Figure 13: Asia Pacific PU Coatings Market Revenue Share (%), by Country 2025 & 2033
- Figure 14: Asia Pacific PU Coatings Market Volume Share (%), by Country 2025 & 2033
- Figure 15: North America PU Coatings Market Revenue (Million), by Technology 2025 & 2033
- Figure 16: North America PU Coatings Market Volume (liter ), by Technology 2025 & 2033
- Figure 17: North America PU Coatings Market Revenue Share (%), by Technology 2025 & 2033
- Figure 18: North America PU Coatings Market Volume Share (%), by Technology 2025 & 2033
- Figure 19: North America PU Coatings Market Revenue (Million), by End-user Industry 2025 & 2033
- Figure 20: North America PU Coatings Market Volume (liter ), by End-user Industry 2025 & 2033
- Figure 21: North America PU Coatings Market Revenue Share (%), by End-user Industry 2025 & 2033
- Figure 22: North America PU Coatings Market Volume Share (%), by End-user Industry 2025 & 2033
- Figure 23: North America PU Coatings Market Revenue (Million), by Country 2025 & 2033
- Figure 24: North America PU Coatings Market Volume (liter ), by Country 2025 & 2033
- Figure 25: North America PU Coatings Market Revenue Share (%), by Country 2025 & 2033
- Figure 26: North America PU Coatings Market Volume Share (%), by Country 2025 & 2033
- Figure 27: Europe PU Coatings Market Revenue (Million), by Technology 2025 & 2033
- Figure 28: Europe PU Coatings Market Volume (liter ), by Technology 2025 & 2033
- Figure 29: Europe PU Coatings Market Revenue Share (%), by Technology 2025 & 2033
- Figure 30: Europe PU Coatings Market Volume Share (%), by Technology 2025 & 2033
- Figure 31: Europe PU Coatings Market Revenue (Million), by End-user Industry 2025 & 2033
- Figure 32: Europe PU Coatings Market Volume (liter ), by End-user Industry 2025 & 2033
- Figure 33: Europe PU Coatings Market Revenue Share (%), by End-user Industry 2025 & 2033
- Figure 34: Europe PU Coatings Market Volume Share (%), by End-user Industry 2025 & 2033
- Figure 35: Europe PU Coatings Market Revenue (Million), by Country 2025 & 2033
- Figure 36: Europe PU Coatings Market Volume (liter ), by Country 2025 & 2033
- Figure 37: Europe PU Coatings Market Revenue Share (%), by Country 2025 & 2033
- Figure 38: Europe PU Coatings Market Volume Share (%), by Country 2025 & 2033
- Figure 39: South America PU Coatings Market Revenue (Million), by Technology 2025 & 2033
- Figure 40: South America PU Coatings Market Volume (liter ), by Technology 2025 & 2033
- Figure 41: South America PU Coatings Market Revenue Share (%), by Technology 2025 & 2033
- Figure 42: South America PU Coatings Market Volume Share (%), by Technology 2025 & 2033
- Figure 43: South America PU Coatings Market Revenue (Million), by End-user Industry 2025 & 2033
- Figure 44: South America PU Coatings Market Volume (liter ), by End-user Industry 2025 & 2033
- Figure 45: South America PU Coatings Market Revenue Share (%), by End-user Industry 2025 & 2033
- Figure 46: South America PU Coatings Market Volume Share (%), by End-user Industry 2025 & 2033
- Figure 47: South America PU Coatings Market Revenue (Million), by Country 2025 & 2033
- Figure 48: South America PU Coatings Market Volume (liter ), by Country 2025 & 2033
- Figure 49: South America PU Coatings Market Revenue Share (%), by Country 2025 & 2033
- Figure 50: South America PU Coatings Market Volume Share (%), by Country 2025 & 2033
- Figure 51: Middle East and Africa PU Coatings Market Revenue (Million), by Technology 2025 & 2033
- Figure 52: Middle East and Africa PU Coatings Market Volume (liter ), by Technology 2025 & 2033
- Figure 53: Middle East and Africa PU Coatings Market Revenue Share (%), by Technology 2025 & 2033
- Figure 54: Middle East and Africa PU Coatings Market Volume Share (%), by Technology 2025 & 2033
- Figure 55: Middle East and Africa PU Coatings Market Revenue (Million), by End-user Industry 2025 & 2033
- Figure 56: Middle East and Africa PU Coatings Market Volume (liter ), by End-user Industry 2025 & 2033
- Figure 57: Middle East and Africa PU Coatings Market Revenue Share (%), by End-user Industry 2025 & 2033
- Figure 58: Middle East and Africa PU Coatings Market Volume Share (%), by End-user Industry 2025 & 2033
- Figure 59: Middle East and Africa PU Coatings Market Revenue (Million), by Country 2025 & 2033
- Figure 60: Middle East and Africa PU Coatings Market Volume (liter ), by Country 2025 & 2033
- Figure 61: Middle East and Africa PU Coatings Market Revenue Share (%), by Country 2025 & 2033
- Figure 62: Middle East and Africa PU Coatings Market Volume Share (%), by Country 2025 & 2033
List of Tables
- Table 1: Global PU Coatings Market Revenue Million Forecast, by Technology 2020 & 2033
- Table 2: Global PU Coatings Market Volume liter Forecast, by Technology 2020 & 2033
- Table 3: Global PU Coatings Market Revenue Million Forecast, by End-user Industry 2020 & 2033
- Table 4: Global PU Coatings Market Volume liter Forecast, by End-user Industry 2020 & 2033
- Table 5: Global PU Coatings Market Revenue Million Forecast, by Region 2020 & 2033
- Table 6: Global PU Coatings Market Volume liter Forecast, by Region 2020 & 2033
- Table 7: Global PU Coatings Market Revenue Million Forecast, by Technology 2020 & 2033
- Table 8: Global PU Coatings Market Volume liter Forecast, by Technology 2020 & 2033
- Table 9: Global PU Coatings Market Revenue Million Forecast, by End-user Industry 2020 & 2033
- Table 10: Global PU Coatings Market Volume liter Forecast, by End-user Industry 2020 & 2033
- Table 11: Global PU Coatings Market Revenue Million Forecast, by Country 2020 & 2033
- Table 12: Global PU Coatings Market Volume liter Forecast, by Country 2020 & 2033
- Table 13: China PU Coatings Market Revenue (Million) Forecast, by Application 2020 & 2033
- Table 14: China PU Coatings Market Volume (liter ) Forecast, by Application 2020 & 2033
- Table 15: India PU Coatings Market Revenue (Million) Forecast, by Application 2020 & 2033
- Table 16: India PU Coatings Market Volume (liter ) Forecast, by Application 2020 & 2033
- Table 17: Japan PU Coatings Market Revenue (Million) Forecast, by Application 2020 & 2033
- Table 18: Japan PU Coatings Market Volume (liter ) Forecast, by Application 2020 & 2033
- Table 19: South Korea PU Coatings Market Revenue (Million) Forecast, by Application 2020 & 2033
- Table 20: South Korea PU Coatings Market Volume (liter ) Forecast, by Application 2020 & 2033
- Table 21: Rest of Asia Pacific PU Coatings Market Revenue (Million) Forecast, by Application 2020 & 2033
- Table 22: Rest of Asia Pacific PU Coatings Market Volume (liter ) Forecast, by Application 2020 & 2033
- Table 23: Global PU Coatings Market Revenue Million Forecast, by Technology 2020 & 2033
- Table 24: Global PU Coatings Market Volume liter Forecast, by Technology 2020 & 2033
- Table 25: Global PU Coatings Market Revenue Million Forecast, by End-user Industry 2020 & 2033
- Table 26: Global PU Coatings Market Volume liter Forecast, by End-user Industry 2020 & 2033
- Table 27: Global PU Coatings Market Revenue Million Forecast, by Country 2020 & 2033
- Table 28: Global PU Coatings Market Volume liter Forecast, by Country 2020 & 2033
- Table 29: United States PU Coatings Market Revenue (Million) Forecast, by Application 2020 & 2033
- Table 30: United States PU Coatings Market Volume (liter ) Forecast, by Application 2020 & 2033
- Table 31: Canada PU Coatings Market Revenue (Million) Forecast, by Application 2020 & 2033
- Table 32: Canada PU Coatings Market Volume (liter ) Forecast, by Application 2020 & 2033
- Table 33: Mexico PU Coatings Market Revenue (Million) Forecast, by Application 2020 & 2033
- Table 34: Mexico PU Coatings Market Volume (liter ) Forecast, by Application 2020 & 2033
- Table 35: Global PU Coatings Market Revenue Million Forecast, by Technology 2020 & 2033
- Table 36: Global PU Coatings Market Volume liter Forecast, by Technology 2020 & 2033
- Table 37: Global PU Coatings Market Revenue Million Forecast, by End-user Industry 2020 & 2033
- Table 38: Global PU Coatings Market Volume liter Forecast, by End-user Industry 2020 & 2033
- Table 39: Global PU Coatings Market Revenue Million Forecast, by Country 2020 & 2033
- Table 40: Global PU Coatings Market Volume liter Forecast, by Country 2020 & 2033
- Table 41: Germany PU Coatings Market Revenue (Million) Forecast, by Application 2020 & 2033
- Table 42: Germany PU Coatings Market Volume (liter ) Forecast, by Application 2020 & 2033
- Table 43: United Kingdom PU Coatings Market Revenue (Million) Forecast, by Application 2020 & 2033
- Table 44: United Kingdom PU Coatings Market Volume (liter ) Forecast, by Application 2020 & 2033
- Table 45: Italy PU Coatings Market Revenue (Million) Forecast, by Application 2020 & 2033
- Table 46: Italy PU Coatings Market Volume (liter ) Forecast, by Application 2020 & 2033
- Table 47: France PU Coatings Market Revenue (Million) Forecast, by Application 2020 & 2033
- Table 48: France PU Coatings Market Volume (liter ) Forecast, by Application 2020 & 2033
- Table 49: Rest of Europe PU Coatings Market Revenue (Million) Forecast, by Application 2020 & 2033
- Table 50: Rest of Europe PU Coatings Market Volume (liter ) Forecast, by Application 2020 & 2033
- Table 51: Global PU Coatings Market Revenue Million Forecast, by Technology 2020 & 2033
- Table 52: Global PU Coatings Market Volume liter Forecast, by Technology 2020 & 2033
- Table 53: Global PU Coatings Market Revenue Million Forecast, by End-user Industry 2020 & 2033
- Table 54: Global PU Coatings Market Volume liter Forecast, by End-user Industry 2020 & 2033
- Table 55: Global PU Coatings Market Revenue Million Forecast, by Country 2020 & 2033
- Table 56: Global PU Coatings Market Volume liter Forecast, by Country 2020 & 2033
- Table 57: Brazil PU Coatings Market Revenue (Million) Forecast, by Application 2020 & 2033
- Table 58: Brazil PU Coatings Market Volume (liter ) Forecast, by Application 2020 & 2033
- Table 59: Argentina PU Coatings Market Revenue (Million) Forecast, by Application 2020 & 2033
- Table 60: Argentina PU Coatings Market Volume (liter ) Forecast, by Application 2020 & 2033
- Table 61: Rest of South America PU Coatings Market Revenue (Million) Forecast, by Application 2020 & 2033
- Table 62: Rest of South America PU Coatings Market Volume (liter ) Forecast, by Application 2020 & 2033
- Table 63: Global PU Coatings Market Revenue Million Forecast, by Technology 2020 & 2033
- Table 64: Global PU Coatings Market Volume liter Forecast, by Technology 2020 & 2033
- Table 65: Global PU Coatings Market Revenue Million Forecast, by End-user Industry 2020 & 2033
- Table 66: Global PU Coatings Market Volume liter Forecast, by End-user Industry 2020 & 2033
- Table 67: Global PU Coatings Market Revenue Million Forecast, by Country 2020 & 2033
- Table 68: Global PU Coatings Market Volume liter Forecast, by Country 2020 & 2033
- Table 69: Saudi Arabia PU Coatings Market Revenue (Million) Forecast, by Application 2020 & 2033
- Table 70: Saudi Arabia PU Coatings Market Volume (liter ) Forecast, by Application 2020 & 2033
- Table 71: South Africa PU Coatings Market Revenue (Million) Forecast, by Application 2020 & 2033
- Table 72: South Africa PU Coatings Market Volume (liter ) Forecast, by Application 2020 & 2033
- Table 73: Rest of Middle East and Africa PU Coatings Market Revenue (Million) Forecast, by Application 2020 & 2033
- Table 74: Rest of Middle East and Africa PU Coatings Market Volume (liter ) Forecast, by Application 2020 & 2033
Frequently Asked Questions
1. What is the projected Compound Annual Growth Rate (CAGR) of the PU Coatings Market?
The projected CAGR is approximately > 4.00%.
2. Which companies are prominent players in the PU Coatings Market?
Key companies in the market include The Sherwin-Williams Company*List Not Exhaustive, IVM Chemicals SRL, Jotun, RPM International Inc, Akzo Nobel NV, PPG Industries Inc, BASF SE, Axalta Coating Systems, Asian Paints, Polycoat Products.
3. What are the main segments of the PU Coatings Market?
The market segments include Technology, End-user Industry.
4. Can you provide details about the market size?
The market size is estimated to be USD 21.15 Million as of 2022.
5. What are some drivers contributing to market growth?
Growing Demand from the Construction Industry; Increase in Demand from the Automotive Industry; Growing Demand from the Transportation Industry.
6. What are the notable trends driving market growth?
Automotive Industry to Dominate the Market.
7. Are there any restraints impacting market growth?
Volatile Raw Material Prices; Other Restraints.
8. Can you provide examples of recent developments in the market?
October 2023: SKC sold its 100% shares of SK pucore, a polyurethane manufacturer, to Glenwood Private Equity, a Seoul-based private equity firm. SKC (petrochemical subsidiary) sold to a private equity firm at the price of KRW 410.3 billion (USD 304.1 million) in a bid to streamline its portfolio with a focus on semiconductor and EV battery materials.
9. What pricing options are available for accessing the report?
Pricing options include single-user, multi-user, and enterprise licenses priced at USD 4750, USD 5250, and USD 8750 respectively.
10. Is the market size provided in terms of value or volume?
The market size is provided in terms of value, measured in Million and volume, measured in liter .
11. Are there any specific market keywords associated with the report?
Yes, the market keyword associated with the report is "PU Coatings Market," which aids in identifying and referencing the specific market segment covered.
12. How do I determine which pricing option suits my needs best?
The pricing options vary based on user requirements and access needs. Individual users may opt for single-user licenses, while businesses requiring broader access may choose multi-user or enterprise licenses for cost-effective access to the report.
13. Are there any additional resources or data provided in the PU Coatings Market report?
While the report offers comprehensive insights, it's advisable to review the specific contents or supplementary materials provided to ascertain if additional resources or data are available.
14. How can I stay updated on further developments or reports in the PU Coatings Market?
To stay informed about further developments, trends, and reports in the PU Coatings Market, consider subscribing to industry newsletters, following relevant companies and organizations, or regularly checking reputable industry news sources and publications.
Methodology
Step 1 - Identification of Relevant Samples Size from Population Database


Step 2 - Approaches for Defining Global Market Size (Value, Volume* & Price*)

Note*: In applicable scenarios
Step 3 - Data Sources
Primary Research
- Web Analytics
- Survey Reports
- Research Institute
- Latest Research Reports
- Opinion Leaders
Secondary Research
- Annual Reports
- White Paper
- Latest Press Release
- Industry Association
- Paid Database
- Investor Presentations

Step 4 - Data Triangulation
Involves using different sources of information in order to increase the validity of a study
These sources are likely to be stakeholders in a program - participants, other researchers, program staff, other community members, and so on.
Then we put all data in single framework & apply various statistical tools to find out the dynamic on the market.
During the analysis stage, feedback from the stakeholder groups would be compared to determine areas of agreement as well as areas of divergence