
Key Insights
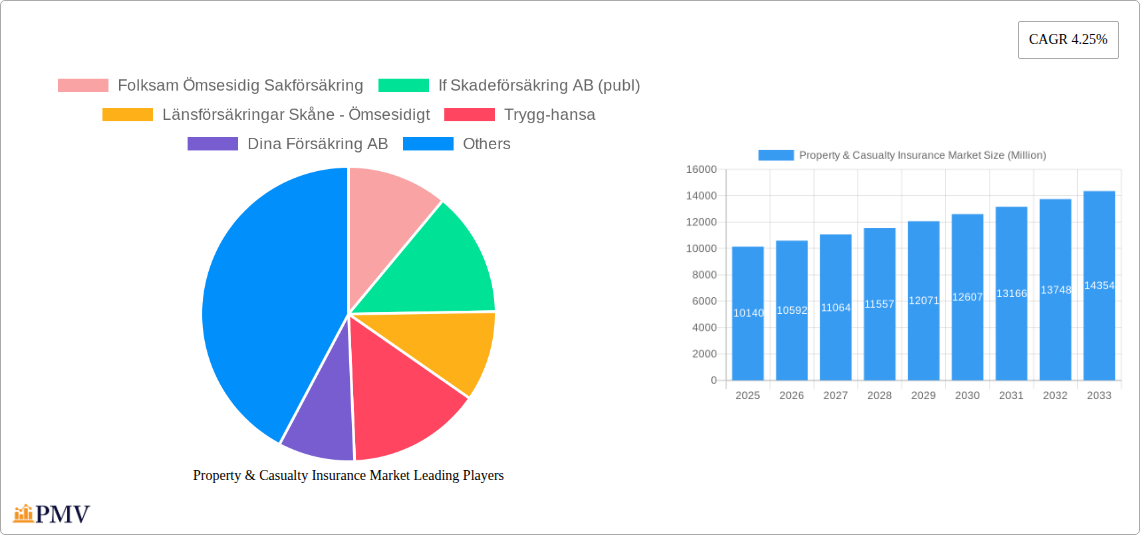
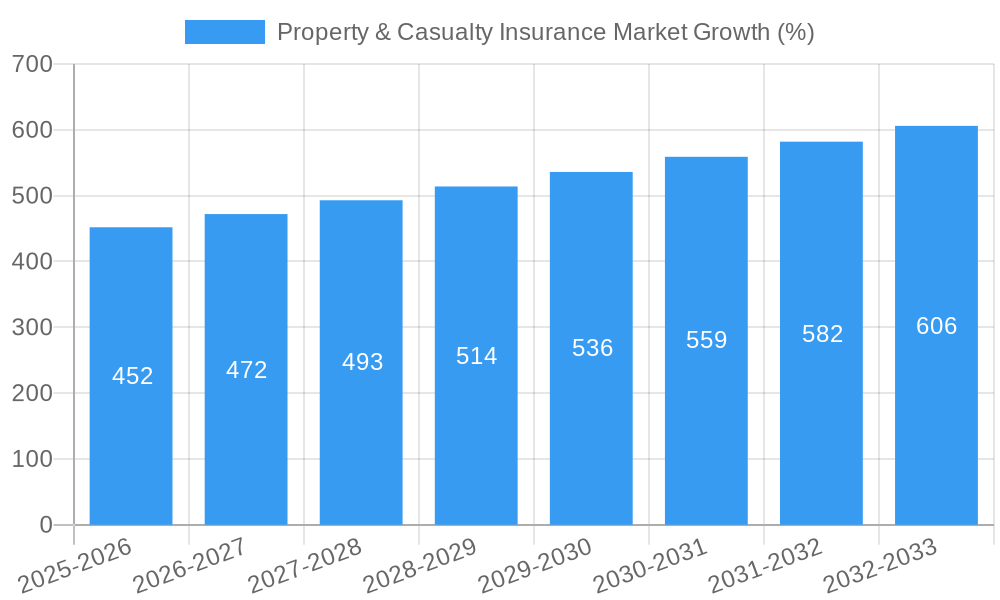
The Swedish Property & Casualty (P&C) insurance market, valued at approximately €10.14 billion in 2025, exhibits a steady growth trajectory, projected to expand at a Compound Annual Growth Rate (CAGR) of 4.25% from 2025 to 2033. This growth is fueled by several key factors. Increasing urbanization and the associated rise in property values necessitate higher insurance coverage, driving demand. Furthermore, heightened awareness of risks related to climate change, such as flooding and severe weather events, is prompting individuals and businesses to secure comprehensive P&C insurance. Technological advancements, such as the implementation of telematics and AI-powered risk assessment, are enhancing efficiency and creating new opportunities for insurers. Competitive pressures among established players like Folksam, If Skadeförsäkring, and Länsförsäkringar, alongside the emergence of innovative InsurTech startups, are fostering market dynamism and driving innovation in product offerings and customer service. However, factors such as stringent regulatory requirements and economic fluctuations can potentially act as restraints on market expansion.
The competitive landscape is characterized by a mix of large, established players and smaller, specialized insurers. The dominance of established players suggests a relatively consolidated market, although the presence of smaller firms indicates opportunities for niche market penetration. Future growth will likely be shaped by insurers' ability to adapt to evolving customer expectations, leverage technological advancements effectively, and manage the increasing complexity of risk assessment in a changing climate. The market's consistent CAGR suggests a reliable investment opportunity, although potential regulatory changes and economic instability warrant careful consideration. The continued focus on digital transformation and personalized insurance solutions will be crucial for maintaining and enhancing market share.
Property & Casualty Insurance Market: A Comprehensive Report (2019-2033)
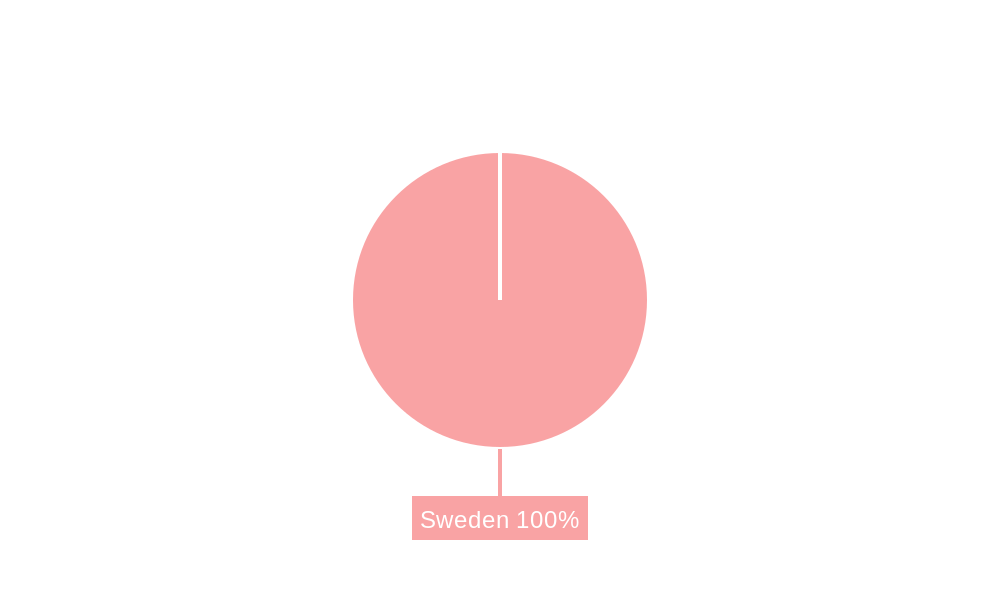
This detailed report provides a comprehensive analysis of the Property & Casualty (P&C) insurance market from 2019 to 2033, offering invaluable insights for industry stakeholders. With a focus on the Scandinavian market and incorporating global trends, this study covers market size, segmentation, competitive dynamics, and future growth projections. The base year is 2025, with estimates for 2025 and forecasts extending to 2033, building upon historical data from 2019-2024.
Property & Casualty Insurance Market Market Structure & Competitive Dynamics
The P&C insurance market exhibits a moderately concentrated structure, with several dominant players vying for market share. The competitive landscape is shaped by factors such as innovation ecosystems, robust regulatory frameworks (varying across Scandinavian countries), the availability of product substitutes, evolving end-user trends (increasing demand for specialized coverage), and frequent M&A activities. Market share data for 2024 suggests that the top five players collectively hold approximately xx% of the market, while smaller, specialized insurers cater to niche segments. M&A activity in the historical period (2019-2024) saw an estimated xx Million in deal value, primarily driven by consolidation efforts and expansion into new product lines. Examples include the recent acquisition of Brim by Gallagher, demonstrating a strategic focus on expanding geographical reach and product offerings.
- Market Concentration: Moderately concentrated, top 5 players holding approximately xx% market share in 2024.
- Innovation Ecosystems: Focus on digitalization, AI-powered risk assessment, and personalized insurance solutions.
- Regulatory Frameworks: Stringent regulations governing solvency, data privacy, and consumer protection. Variations exist across different Scandinavian countries.
- Product Substitutes: Limited direct substitutes; competition primarily focuses on product differentiation and pricing strategies.
- End-User Trends: Growing demand for specialized insurance products (e.g., pet insurance, cyber insurance).
- M&A Activities: Significant M&A activity driven by consolidation and expansion into new markets and product lines. Estimated xx Million in deal value from 2019-2024.
Property & Casualty Insurance Market Industry Trends & Insights
The P&C insurance market is experiencing substantial growth, driven by increasing urbanization, rising disposable incomes, growing awareness of insurance benefits, and a rise in insurable risks. Technological advancements, particularly in areas like telematics and AI, are significantly impacting risk assessment and claims processing, leading to improved efficiency and personalized products. The market has seen a steady Compound Annual Growth Rate (CAGR) of xx% during the historical period (2019-2024) and is projected to maintain a CAGR of xx% during the forecast period (2025-2033). This growth is further fueled by evolving consumer preferences, a shift towards digital insurance platforms, and intense competition among insurers leading to innovative product offerings and competitive pricing. Market penetration, particularly in niche segments like pet insurance, is also showing significant increases. This report delves into specific trends within specific Scandinavian countries providing a nuanced understanding of market dynamics.
Dominant Markets & Segments in Property & Casualty Insurance Market
While data for specific market dominance is unavailable without country specific breakdowns, this section examines likely dominant segments. The Scandinavian region represents a significant market for P&C insurance, with Sweden, Norway, and Denmark demonstrating strong growth potential. The dominance of specific regions is influenced by several key drivers:
- Economic Policies: Stable economic environments and robust regulatory frameworks promote market growth.
- Infrastructure Development: Investment in infrastructure creates opportunities for related insurance products (e.g., construction insurance).
- Demographic Trends: Aging populations and rising urbanization contribute to increased demand for insurance services.
The most dominant segment likely varies between countries. Factors like high property values, a culture of insurance adoption, and government regulations influence the prominence of certain segments. Further, home and motor insurance continue to dominate, but specialized segments are displaying higher growth.
Property & Casualty Insurance Market Product Innovations
Recent innovations in the P&C insurance market include the increased use of telematics for auto insurance, providing personalized premiums based on driving behavior. AI-powered risk assessment tools improve underwriting efficiency and accuracy. The introduction of new product offerings, such as pet insurance by Trygg-Hansa, demonstrates market responsiveness to evolving consumer needs. These innovations improve customer experience, enhance efficiency, and create competitive advantages for insurers.
Report Segmentation & Scope
The report segments the market by product type (e.g., motor, home, commercial), distribution channel (e.g., online, agents), and geography (Scandinavian countries). Each segment's growth projections, market size (in Millions), and competitive dynamics are analyzed, providing a comprehensive overview of the market landscape. The forecast for 2033 predicts a market size of xx Million, with specific segment breakdowns presented within the full report.
Key Drivers of Property & Casualty Insurance Market Growth
Several factors fuel the growth of the P&C insurance market. Technological advancements in risk assessment and claims management enhance efficiency and personalize offerings. Favorable economic conditions and increasing disposable incomes boost insurance adoption. Government regulations promoting financial stability and consumer protection foster a sustainable market environment. The rising frequency and severity of extreme weather events, also drives demand for property insurance, and ultimately market growth.
Challenges in the Property & Casualty Insurance Market Sector
The P&C insurance sector faces challenges such as increasing regulatory scrutiny, impacting operational costs and product offerings. The impact of severe weather events contributes significantly to claims costs, affecting profitability. Intense competition requires insurers to constantly innovate and differentiate their products to maintain market share, while ensuring that they remain profitable. This is impacting overall market profitability, a quantifiable challenge with an estimated xx% impact on profit margins in 2024.
Leading Players in the Property & Casualty Insurance Market Market
- Folksam Ömsesidig Sakförsäkring
- If Skadeförsäkring AB (publ)
- Länsförsäkringar Skåne - Ömsesidigt
- Trygg-hansa
- Dina Försäkring AB
- Sirius International Försäkrings AB (publ)
- Sveriges Ångfartygs Assurans Förening
- Solid Försäkrings AB
- Stockholms Stads Brandförsäkringskontor
- S:t Erik Försäkrings AB
Key Developments in Property & Casualty Insurance Market Sector
- September 2022: Trygg Hansa launched animal insurance, expanding its product portfolio and targeting a new customer segment.
- March 2023: Gallagher's acquisition of Brim significantly expands its presence in the Scandinavian market and strengthens its specialty insurance offerings.
Strategic Property & Casualty Insurance Market Market Outlook
The P&C insurance market presents significant growth opportunities, driven by technological innovation, evolving consumer preferences, and the increasing need for risk mitigation. Strategic investments in digital technologies and data analytics will be critical for insurers to optimize operations, personalize products, and enhance customer experiences. Expansion into niche segments and strategic partnerships will further enhance market penetration and profitability. The long-term outlook is positive, with sustained growth projected through 2033, provided that the industry adapts to evolving challenges and leverages emerging opportunities.
Property & Casualty Insurance Market Segmentation
-
1. Insurance Type
- 1.1. Home Insurance
- 1.2. Auto Insurance
- 1.3. Other Insurance Types
-
2. Distribution Channel
- 2.1. Direct
- 2.2. Agencies
- 2.3. Banks
- 2.4. Other Distribution Channels
Property & Casualty Insurance Market Segmentation By Geography
-
1. North America
- 1.1. United States
- 1.2. Canada
- 1.3. Mexico
-
2. South America
- 2.1. Brazil
- 2.2. Argentina
- 2.3. Rest of South America
-
3. Europe
- 3.1. United Kingdom
- 3.2. Germany
- 3.3. France
- 3.4. Italy
- 3.5. Spain
- 3.6. Russia
- 3.7. Benelux
- 3.8. Nordics
- 3.9. Rest of Europe
-
4. Middle East & Africa
- 4.1. Turkey
- 4.2. Israel
- 4.3. GCC
- 4.4. North Africa
- 4.5. South Africa
- 4.6. Rest of Middle East & Africa
-
5. Asia Pacific
- 5.1. China
- 5.2. India
- 5.3. Japan
- 5.4. South Korea
- 5.5. ASEAN
- 5.6. Oceania
- 5.7. Rest of Asia Pacific
Property & Casualty Insurance Market REPORT HIGHLIGHTS
| Aspects | Details |
|---|---|
| Study Period | 2019-2033 |
| Base Year | 2024 |
| Estimated Year | 2025 |
| Forecast Period | 2025-2033 |
| Historical Period | 2019-2024 |
| Growth Rate | CAGR of 4.25% from 2019-2033 |
| Segmentation |
|
Table of Contents
- 1. Introduction
- 1.1. Research Scope
- 1.2. Market Segmentation
- 1.3. Research Methodology
- 1.4. Definitions and Assumptions
- 2. Executive Summary
- 2.1. Introduction
- 3. Market Dynamics
- 3.1. Introduction
- 3.2. Market Drivers
- 3.3. Market Restrains
- 3.4. Market Trends
- 3.4.1. Motor Insurance Dominates the Non Life Insurance Segment in Sweden
- 4. Market Factor Analysis
- 4.1. Porters Five Forces
- 4.2. Supply/Value Chain
- 4.3. PESTEL analysis
- 4.4. Market Entropy
- 4.5. Patent/Trademark Analysis
- 5. Global Property & Casualty Insurance Market Analysis, Insights and Forecast, 2019-2031
- 5.1. Market Analysis, Insights and Forecast - by Insurance Type
- 5.1.1. Home Insurance
- 5.1.2. Auto Insurance
- 5.1.3. Other Insurance Types
- 5.2. Market Analysis, Insights and Forecast - by Distribution Channel
- 5.2.1. Direct
- 5.2.2. Agencies
- 5.2.3. Banks
- 5.2.4. Other Distribution Channels
- 5.3. Market Analysis, Insights and Forecast - by Region
- 5.3.1. North America
- 5.3.2. South America
- 5.3.3. Europe
- 5.3.4. Middle East & Africa
- 5.3.5. Asia Pacific
- 5.1. Market Analysis, Insights and Forecast - by Insurance Type
- 6. North America Property & Casualty Insurance Market Analysis, Insights and Forecast, 2019-2031
- 6.1. Market Analysis, Insights and Forecast - by Insurance Type
- 6.1.1. Home Insurance
- 6.1.2. Auto Insurance
- 6.1.3. Other Insurance Types
- 6.2. Market Analysis, Insights and Forecast - by Distribution Channel
- 6.2.1. Direct
- 6.2.2. Agencies
- 6.2.3. Banks
- 6.2.4. Other Distribution Channels
- 6.1. Market Analysis, Insights and Forecast - by Insurance Type
- 7. South America Property & Casualty Insurance Market Analysis, Insights and Forecast, 2019-2031
- 7.1. Market Analysis, Insights and Forecast - by Insurance Type
- 7.1.1. Home Insurance
- 7.1.2. Auto Insurance
- 7.1.3. Other Insurance Types
- 7.2. Market Analysis, Insights and Forecast - by Distribution Channel
- 7.2.1. Direct
- 7.2.2. Agencies
- 7.2.3. Banks
- 7.2.4. Other Distribution Channels
- 7.1. Market Analysis, Insights and Forecast - by Insurance Type
- 8. Europe Property & Casualty Insurance Market Analysis, Insights and Forecast, 2019-2031
- 8.1. Market Analysis, Insights and Forecast - by Insurance Type
- 8.1.1. Home Insurance
- 8.1.2. Auto Insurance
- 8.1.3. Other Insurance Types
- 8.2. Market Analysis, Insights and Forecast - by Distribution Channel
- 8.2.1. Direct
- 8.2.2. Agencies
- 8.2.3. Banks
- 8.2.4. Other Distribution Channels
- 8.1. Market Analysis, Insights and Forecast - by Insurance Type
- 9. Middle East & Africa Property & Casualty Insurance Market Analysis, Insights and Forecast, 2019-2031
- 9.1. Market Analysis, Insights and Forecast - by Insurance Type
- 9.1.1. Home Insurance
- 9.1.2. Auto Insurance
- 9.1.3. Other Insurance Types
- 9.2. Market Analysis, Insights and Forecast - by Distribution Channel
- 9.2.1. Direct
- 9.2.2. Agencies
- 9.2.3. Banks
- 9.2.4. Other Distribution Channels
- 9.1. Market Analysis, Insights and Forecast - by Insurance Type
- 10. Asia Pacific Property & Casualty Insurance Market Analysis, Insights and Forecast, 2019-2031
- 10.1. Market Analysis, Insights and Forecast - by Insurance Type
- 10.1.1. Home Insurance
- 10.1.2. Auto Insurance
- 10.1.3. Other Insurance Types
- 10.2. Market Analysis, Insights and Forecast - by Distribution Channel
- 10.2.1. Direct
- 10.2.2. Agencies
- 10.2.3. Banks
- 10.2.4. Other Distribution Channels
- 10.1. Market Analysis, Insights and Forecast - by Insurance Type
- 11. Competitive Analysis
- 11.1. Global Market Share Analysis 2024
- 11.2. Company Profiles
- 11.2.1 Folksam Ömsesidig Sakförsäkring
- 11.2.1.1. Overview
- 11.2.1.2. Products
- 11.2.1.3. SWOT Analysis
- 11.2.1.4. Recent Developments
- 11.2.1.5. Financials (Based on Availability)
- 11.2.2 If Skadeförsäkring AB (publ)
- 11.2.2.1. Overview
- 11.2.2.2. Products
- 11.2.2.3. SWOT Analysis
- 11.2.2.4. Recent Developments
- 11.2.2.5. Financials (Based on Availability)
- 11.2.3 Länsförsäkringar Skåne - Ömsesidigt
- 11.2.3.1. Overview
- 11.2.3.2. Products
- 11.2.3.3. SWOT Analysis
- 11.2.3.4. Recent Developments
- 11.2.3.5. Financials (Based on Availability)
- 11.2.4 Trygg-hansa
- 11.2.4.1. Overview
- 11.2.4.2. Products
- 11.2.4.3. SWOT Analysis
- 11.2.4.4. Recent Developments
- 11.2.4.5. Financials (Based on Availability)
- 11.2.5 Dina Försäkring AB
- 11.2.5.1. Overview
- 11.2.5.2. Products
- 11.2.5.3. SWOT Analysis
- 11.2.5.4. Recent Developments
- 11.2.5.5. Financials (Based on Availability)
- 11.2.6 Sirius International Försäkrings AB (publ)
- 11.2.6.1. Overview
- 11.2.6.2. Products
- 11.2.6.3. SWOT Analysis
- 11.2.6.4. Recent Developments
- 11.2.6.5. Financials (Based on Availability)
- 11.2.7 Sveriges Ångfartygs Assurans Förening
- 11.2.7.1. Overview
- 11.2.7.2. Products
- 11.2.7.3. SWOT Analysis
- 11.2.7.4. Recent Developments
- 11.2.7.5. Financials (Based on Availability)
- 11.2.8 Solid Försäkrings AB
- 11.2.8.1. Overview
- 11.2.8.2. Products
- 11.2.8.3. SWOT Analysis
- 11.2.8.4. Recent Developments
- 11.2.8.5. Financials (Based on Availability)
- 11.2.9 Stockholms Stads Brandförsäkringskontor
- 11.2.9.1. Overview
- 11.2.9.2. Products
- 11.2.9.3. SWOT Analysis
- 11.2.9.4. Recent Developments
- 11.2.9.5. Financials (Based on Availability)
- 11.2.10 S
- 11.2.10.1. Overview
- 11.2.10.2. Products
- 11.2.10.3. SWOT Analysis
- 11.2.10.4. Recent Developments
- 11.2.10.5. Financials (Based on Availability)
- 11.2.1 Folksam Ömsesidig Sakförsäkring
List of Figures
- Figure 1: Global Property & Casualty Insurance Market Revenue Breakdown (Million, %) by Region 2024 & 2032
- Figure 2: Global Property & Casualty Insurance Market Volume Breakdown (Billion, %) by Region 2024 & 2032
- Figure 3: North America Property & Casualty Insurance Market Revenue (Million), by Insurance Type 2024 & 2032
- Figure 4: North America Property & Casualty Insurance Market Volume (Billion), by Insurance Type 2024 & 2032
- Figure 5: North America Property & Casualty Insurance Market Revenue Share (%), by Insurance Type 2024 & 2032
- Figure 6: North America Property & Casualty Insurance Market Volume Share (%), by Insurance Type 2024 & 2032
- Figure 7: North America Property & Casualty Insurance Market Revenue (Million), by Distribution Channel 2024 & 2032
- Figure 8: North America Property & Casualty Insurance Market Volume (Billion), by Distribution Channel 2024 & 2032
- Figure 9: North America Property & Casualty Insurance Market Revenue Share (%), by Distribution Channel 2024 & 2032
- Figure 10: North America Property & Casualty Insurance Market Volume Share (%), by Distribution Channel 2024 & 2032
- Figure 11: North America Property & Casualty Insurance Market Revenue (Million), by Country 2024 & 2032
- Figure 12: North America Property & Casualty Insurance Market Volume (Billion), by Country 2024 & 2032
- Figure 13: North America Property & Casualty Insurance Market Revenue Share (%), by Country 2024 & 2032
- Figure 14: North America Property & Casualty Insurance Market Volume Share (%), by Country 2024 & 2032
- Figure 15: South America Property & Casualty Insurance Market Revenue (Million), by Insurance Type 2024 & 2032
- Figure 16: South America Property & Casualty Insurance Market Volume (Billion), by Insurance Type 2024 & 2032
- Figure 17: South America Property & Casualty Insurance Market Revenue Share (%), by Insurance Type 2024 & 2032
- Figure 18: South America Property & Casualty Insurance Market Volume Share (%), by Insurance Type 2024 & 2032
- Figure 19: South America Property & Casualty Insurance Market Revenue (Million), by Distribution Channel 2024 & 2032
- Figure 20: South America Property & Casualty Insurance Market Volume (Billion), by Distribution Channel 2024 & 2032
- Figure 21: South America Property & Casualty Insurance Market Revenue Share (%), by Distribution Channel 2024 & 2032
- Figure 22: South America Property & Casualty Insurance Market Volume Share (%), by Distribution Channel 2024 & 2032
- Figure 23: South America Property & Casualty Insurance Market Revenue (Million), by Country 2024 & 2032
- Figure 24: South America Property & Casualty Insurance Market Volume (Billion), by Country 2024 & 2032
- Figure 25: South America Property & Casualty Insurance Market Revenue Share (%), by Country 2024 & 2032
- Figure 26: South America Property & Casualty Insurance Market Volume Share (%), by Country 2024 & 2032
- Figure 27: Europe Property & Casualty Insurance Market Revenue (Million), by Insurance Type 2024 & 2032
- Figure 28: Europe Property & Casualty Insurance Market Volume (Billion), by Insurance Type 2024 & 2032
- Figure 29: Europe Property & Casualty Insurance Market Revenue Share (%), by Insurance Type 2024 & 2032
- Figure 30: Europe Property & Casualty Insurance Market Volume Share (%), by Insurance Type 2024 & 2032
- Figure 31: Europe Property & Casualty Insurance Market Revenue (Million), by Distribution Channel 2024 & 2032
- Figure 32: Europe Property & Casualty Insurance Market Volume (Billion), by Distribution Channel 2024 & 2032
- Figure 33: Europe Property & Casualty Insurance Market Revenue Share (%), by Distribution Channel 2024 & 2032
- Figure 34: Europe Property & Casualty Insurance Market Volume Share (%), by Distribution Channel 2024 & 2032
- Figure 35: Europe Property & Casualty Insurance Market Revenue (Million), by Country 2024 & 2032
- Figure 36: Europe Property & Casualty Insurance Market Volume (Billion), by Country 2024 & 2032
- Figure 37: Europe Property & Casualty Insurance Market Revenue Share (%), by Country 2024 & 2032
- Figure 38: Europe Property & Casualty Insurance Market Volume Share (%), by Country 2024 & 2032
- Figure 39: Middle East & Africa Property & Casualty Insurance Market Revenue (Million), by Insurance Type 2024 & 2032
- Figure 40: Middle East & Africa Property & Casualty Insurance Market Volume (Billion), by Insurance Type 2024 & 2032
- Figure 41: Middle East & Africa Property & Casualty Insurance Market Revenue Share (%), by Insurance Type 2024 & 2032
- Figure 42: Middle East & Africa Property & Casualty Insurance Market Volume Share (%), by Insurance Type 2024 & 2032
- Figure 43: Middle East & Africa Property & Casualty Insurance Market Revenue (Million), by Distribution Channel 2024 & 2032
- Figure 44: Middle East & Africa Property & Casualty Insurance Market Volume (Billion), by Distribution Channel 2024 & 2032
- Figure 45: Middle East & Africa Property & Casualty Insurance Market Revenue Share (%), by Distribution Channel 2024 & 2032
- Figure 46: Middle East & Africa Property & Casualty Insurance Market Volume Share (%), by Distribution Channel 2024 & 2032
- Figure 47: Middle East & Africa Property & Casualty Insurance Market Revenue (Million), by Country 2024 & 2032
- Figure 48: Middle East & Africa Property & Casualty Insurance Market Volume (Billion), by Country 2024 & 2032
- Figure 49: Middle East & Africa Property & Casualty Insurance Market Revenue Share (%), by Country 2024 & 2032
- Figure 50: Middle East & Africa Property & Casualty Insurance Market Volume Share (%), by Country 2024 & 2032
- Figure 51: Asia Pacific Property & Casualty Insurance Market Revenue (Million), by Insurance Type 2024 & 2032
- Figure 52: Asia Pacific Property & Casualty Insurance Market Volume (Billion), by Insurance Type 2024 & 2032
- Figure 53: Asia Pacific Property & Casualty Insurance Market Revenue Share (%), by Insurance Type 2024 & 2032
- Figure 54: Asia Pacific Property & Casualty Insurance Market Volume Share (%), by Insurance Type 2024 & 2032
- Figure 55: Asia Pacific Property & Casualty Insurance Market Revenue (Million), by Distribution Channel 2024 & 2032
- Figure 56: Asia Pacific Property & Casualty Insurance Market Volume (Billion), by Distribution Channel 2024 & 2032
- Figure 57: Asia Pacific Property & Casualty Insurance Market Revenue Share (%), by Distribution Channel 2024 & 2032
- Figure 58: Asia Pacific Property & Casualty Insurance Market Volume Share (%), by Distribution Channel 2024 & 2032
- Figure 59: Asia Pacific Property & Casualty Insurance Market Revenue (Million), by Country 2024 & 2032
- Figure 60: Asia Pacific Property & Casualty Insurance Market Volume (Billion), by Country 2024 & 2032
- Figure 61: Asia Pacific Property & Casualty Insurance Market Revenue Share (%), by Country 2024 & 2032
- Figure 62: Asia Pacific Property & Casualty Insurance Market Volume Share (%), by Country 2024 & 2032
List of Tables
- Table 1: Global Property & Casualty Insurance Market Revenue Million Forecast, by Region 2019 & 2032
- Table 2: Global Property & Casualty Insurance Market Volume Billion Forecast, by Region 2019 & 2032
- Table 3: Global Property & Casualty Insurance Market Revenue Million Forecast, by Insurance Type 2019 & 2032
- Table 4: Global Property & Casualty Insurance Market Volume Billion Forecast, by Insurance Type 2019 & 2032
- Table 5: Global Property & Casualty Insurance Market Revenue Million Forecast, by Distribution Channel 2019 & 2032
- Table 6: Global Property & Casualty Insurance Market Volume Billion Forecast, by Distribution Channel 2019 & 2032
- Table 7: Global Property & Casualty Insurance Market Revenue Million Forecast, by Region 2019 & 2032
- Table 8: Global Property & Casualty Insurance Market Volume Billion Forecast, by Region 2019 & 2032
- Table 9: Global Property & Casualty Insurance Market Revenue Million Forecast, by Insurance Type 2019 & 2032
- Table 10: Global Property & Casualty Insurance Market Volume Billion Forecast, by Insurance Type 2019 & 2032
- Table 11: Global Property & Casualty Insurance Market Revenue Million Forecast, by Distribution Channel 2019 & 2032
- Table 12: Global Property & Casualty Insurance Market Volume Billion Forecast, by Distribution Channel 2019 & 2032
- Table 13: Global Property & Casualty Insurance Market Revenue Million Forecast, by Country 2019 & 2032
- Table 14: Global Property & Casualty Insurance Market Volume Billion Forecast, by Country 2019 & 2032
- Table 15: United States Property & Casualty Insurance Market Revenue (Million) Forecast, by Application 2019 & 2032
- Table 16: United States Property & Casualty Insurance Market Volume (Billion) Forecast, by Application 2019 & 2032
- Table 17: Canada Property & Casualty Insurance Market Revenue (Million) Forecast, by Application 2019 & 2032
- Table 18: Canada Property & Casualty Insurance Market Volume (Billion) Forecast, by Application 2019 & 2032
- Table 19: Mexico Property & Casualty Insurance Market Revenue (Million) Forecast, by Application 2019 & 2032
- Table 20: Mexico Property & Casualty Insurance Market Volume (Billion) Forecast, by Application 2019 & 2032
- Table 21: Global Property & Casualty Insurance Market Revenue Million Forecast, by Insurance Type 2019 & 2032
- Table 22: Global Property & Casualty Insurance Market Volume Billion Forecast, by Insurance Type 2019 & 2032
- Table 23: Global Property & Casualty Insurance Market Revenue Million Forecast, by Distribution Channel 2019 & 2032
- Table 24: Global Property & Casualty Insurance Market Volume Billion Forecast, by Distribution Channel 2019 & 2032
- Table 25: Global Property & Casualty Insurance Market Revenue Million Forecast, by Country 2019 & 2032
- Table 26: Global Property & Casualty Insurance Market Volume Billion Forecast, by Country 2019 & 2032
- Table 27: Brazil Property & Casualty Insurance Market Revenue (Million) Forecast, by Application 2019 & 2032
- Table 28: Brazil Property & Casualty Insurance Market Volume (Billion) Forecast, by Application 2019 & 2032
- Table 29: Argentina Property & Casualty Insurance Market Revenue (Million) Forecast, by Application 2019 & 2032
- Table 30: Argentina Property & Casualty Insurance Market Volume (Billion) Forecast, by Application 2019 & 2032
- Table 31: Rest of South America Property & Casualty Insurance Market Revenue (Million) Forecast, by Application 2019 & 2032
- Table 32: Rest of South America Property & Casualty Insurance Market Volume (Billion) Forecast, by Application 2019 & 2032
- Table 33: Global Property & Casualty Insurance Market Revenue Million Forecast, by Insurance Type 2019 & 2032
- Table 34: Global Property & Casualty Insurance Market Volume Billion Forecast, by Insurance Type 2019 & 2032
- Table 35: Global Property & Casualty Insurance Market Revenue Million Forecast, by Distribution Channel 2019 & 2032
- Table 36: Global Property & Casualty Insurance Market Volume Billion Forecast, by Distribution Channel 2019 & 2032
- Table 37: Global Property & Casualty Insurance Market Revenue Million Forecast, by Country 2019 & 2032
- Table 38: Global Property & Casualty Insurance Market Volume Billion Forecast, by Country 2019 & 2032
- Table 39: United Kingdom Property & Casualty Insurance Market Revenue (Million) Forecast, by Application 2019 & 2032
- Table 40: United Kingdom Property & Casualty Insurance Market Volume (Billion) Forecast, by Application 2019 & 2032
- Table 41: Germany Property & Casualty Insurance Market Revenue (Million) Forecast, by Application 2019 & 2032
- Table 42: Germany Property & Casualty Insurance Market Volume (Billion) Forecast, by Application 2019 & 2032
- Table 43: France Property & Casualty Insurance Market Revenue (Million) Forecast, by Application 2019 & 2032
- Table 44: France Property & Casualty Insurance Market Volume (Billion) Forecast, by Application 2019 & 2032
- Table 45: Italy Property & Casualty Insurance Market Revenue (Million) Forecast, by Application 2019 & 2032
- Table 46: Italy Property & Casualty Insurance Market Volume (Billion) Forecast, by Application 2019 & 2032
- Table 47: Spain Property & Casualty Insurance Market Revenue (Million) Forecast, by Application 2019 & 2032
- Table 48: Spain Property & Casualty Insurance Market Volume (Billion) Forecast, by Application 2019 & 2032
- Table 49: Russia Property & Casualty Insurance Market Revenue (Million) Forecast, by Application 2019 & 2032
- Table 50: Russia Property & Casualty Insurance Market Volume (Billion) Forecast, by Application 2019 & 2032
- Table 51: Benelux Property & Casualty Insurance Market Revenue (Million) Forecast, by Application 2019 & 2032
- Table 52: Benelux Property & Casualty Insurance Market Volume (Billion) Forecast, by Application 2019 & 2032
- Table 53: Nordics Property & Casualty Insurance Market Revenue (Million) Forecast, by Application 2019 & 2032
- Table 54: Nordics Property & Casualty Insurance Market Volume (Billion) Forecast, by Application 2019 & 2032
- Table 55: Rest of Europe Property & Casualty Insurance Market Revenue (Million) Forecast, by Application 2019 & 2032
- Table 56: Rest of Europe Property & Casualty Insurance Market Volume (Billion) Forecast, by Application 2019 & 2032
- Table 57: Global Property & Casualty Insurance Market Revenue Million Forecast, by Insurance Type 2019 & 2032
- Table 58: Global Property & Casualty Insurance Market Volume Billion Forecast, by Insurance Type 2019 & 2032
- Table 59: Global Property & Casualty Insurance Market Revenue Million Forecast, by Distribution Channel 2019 & 2032
- Table 60: Global Property & Casualty Insurance Market Volume Billion Forecast, by Distribution Channel 2019 & 2032
- Table 61: Global Property & Casualty Insurance Market Revenue Million Forecast, by Country 2019 & 2032
- Table 62: Global Property & Casualty Insurance Market Volume Billion Forecast, by Country 2019 & 2032
- Table 63: Turkey Property & Casualty Insurance Market Revenue (Million) Forecast, by Application 2019 & 2032
- Table 64: Turkey Property & Casualty Insurance Market Volume (Billion) Forecast, by Application 2019 & 2032
- Table 65: Israel Property & Casualty Insurance Market Revenue (Million) Forecast, by Application 2019 & 2032
- Table 66: Israel Property & Casualty Insurance Market Volume (Billion) Forecast, by Application 2019 & 2032
- Table 67: GCC Property & Casualty Insurance Market Revenue (Million) Forecast, by Application 2019 & 2032
- Table 68: GCC Property & Casualty Insurance Market Volume (Billion) Forecast, by Application 2019 & 2032
- Table 69: North Africa Property & Casualty Insurance Market Revenue (Million) Forecast, by Application 2019 & 2032
- Table 70: North Africa Property & Casualty Insurance Market Volume (Billion) Forecast, by Application 2019 & 2032
- Table 71: South Africa Property & Casualty Insurance Market Revenue (Million) Forecast, by Application 2019 & 2032
- Table 72: South Africa Property & Casualty Insurance Market Volume (Billion) Forecast, by Application 2019 & 2032
- Table 73: Rest of Middle East & Africa Property & Casualty Insurance Market Revenue (Million) Forecast, by Application 2019 & 2032
- Table 74: Rest of Middle East & Africa Property & Casualty Insurance Market Volume (Billion) Forecast, by Application 2019 & 2032
- Table 75: Global Property & Casualty Insurance Market Revenue Million Forecast, by Insurance Type 2019 & 2032
- Table 76: Global Property & Casualty Insurance Market Volume Billion Forecast, by Insurance Type 2019 & 2032
- Table 77: Global Property & Casualty Insurance Market Revenue Million Forecast, by Distribution Channel 2019 & 2032
- Table 78: Global Property & Casualty Insurance Market Volume Billion Forecast, by Distribution Channel 2019 & 2032
- Table 79: Global Property & Casualty Insurance Market Revenue Million Forecast, by Country 2019 & 2032
- Table 80: Global Property & Casualty Insurance Market Volume Billion Forecast, by Country 2019 & 2032
- Table 81: China Property & Casualty Insurance Market Revenue (Million) Forecast, by Application 2019 & 2032
- Table 82: China Property & Casualty Insurance Market Volume (Billion) Forecast, by Application 2019 & 2032
- Table 83: India Property & Casualty Insurance Market Revenue (Million) Forecast, by Application 2019 & 2032
- Table 84: India Property & Casualty Insurance Market Volume (Billion) Forecast, by Application 2019 & 2032
- Table 85: Japan Property & Casualty Insurance Market Revenue (Million) Forecast, by Application 2019 & 2032
- Table 86: Japan Property & Casualty Insurance Market Volume (Billion) Forecast, by Application 2019 & 2032
- Table 87: South Korea Property & Casualty Insurance Market Revenue (Million) Forecast, by Application 2019 & 2032
- Table 88: South Korea Property & Casualty Insurance Market Volume (Billion) Forecast, by Application 2019 & 2032
- Table 89: ASEAN Property & Casualty Insurance Market Revenue (Million) Forecast, by Application 2019 & 2032
- Table 90: ASEAN Property & Casualty Insurance Market Volume (Billion) Forecast, by Application 2019 & 2032
- Table 91: Oceania Property & Casualty Insurance Market Revenue (Million) Forecast, by Application 2019 & 2032
- Table 92: Oceania Property & Casualty Insurance Market Volume (Billion) Forecast, by Application 2019 & 2032
- Table 93: Rest of Asia Pacific Property & Casualty Insurance Market Revenue (Million) Forecast, by Application 2019 & 2032
- Table 94: Rest of Asia Pacific Property & Casualty Insurance Market Volume (Billion) Forecast, by Application 2019 & 2032
Frequently Asked Questions
1. What is the projected Compound Annual Growth Rate (CAGR) of the Property & Casualty Insurance Market?
The projected CAGR is approximately 4.25%.
2. Which companies are prominent players in the Property & Casualty Insurance Market?
Key companies in the market include Folksam Ömsesidig Sakförsäkring, If Skadeförsäkring AB (publ), Länsförsäkringar Skåne - Ömsesidigt, Trygg-hansa, Dina Försäkring AB, Sirius International Försäkrings AB (publ), Sveriges Ångfartygs Assurans Förening, Solid Försäkrings AB, Stockholms Stads Brandförsäkringskontor, S:t Erik Försäkrings AB**List Not Exhaustive.
3. What are the main segments of the Property & Casualty Insurance Market?
The market segments include Insurance Type, Distribution Channel.
4. Can you provide details about the market size?
The market size is estimated to be USD 10.14 Million as of 2022.
5. What are some drivers contributing to market growth?
N/A
6. What are the notable trends driving market growth?
Motor Insurance Dominates the Non Life Insurance Segment in Sweden.
7. Are there any restraints impacting market growth?
N/A
8. Can you provide examples of recent developments in the market?
March 2023: Gallagher acquired Brim, a specialty insurance and reinsurance broker that provides property/casualty insurance, credit and political risk, and affinity insurance products and services to its Scandinavian and international clients. Its credit and political risk practice provides financing support for major infrastructure projects, while its construction practice supports residential and commercial building development.
9. What pricing options are available for accessing the report?
Pricing options include single-user, multi-user, and enterprise licenses priced at USD 3800, USD 4500, and USD 5800 respectively.
10. Is the market size provided in terms of value or volume?
The market size is provided in terms of value, measured in Million and volume, measured in Billion.
11. Are there any specific market keywords associated with the report?
Yes, the market keyword associated with the report is "Property & Casualty Insurance Market," which aids in identifying and referencing the specific market segment covered.
12. How do I determine which pricing option suits my needs best?
The pricing options vary based on user requirements and access needs. Individual users may opt for single-user licenses, while businesses requiring broader access may choose multi-user or enterprise licenses for cost-effective access to the report.
13. Are there any additional resources or data provided in the Property & Casualty Insurance Market report?
While the report offers comprehensive insights, it's advisable to review the specific contents or supplementary materials provided to ascertain if additional resources or data are available.
14. How can I stay updated on further developments or reports in the Property & Casualty Insurance Market?
To stay informed about further developments, trends, and reports in the Property & Casualty Insurance Market, consider subscribing to industry newsletters, following relevant companies and organizations, or regularly checking reputable industry news sources and publications.
Methodology
Step 1 - Identification of Relevant Samples Size from Population Database


Step 2 - Approaches for Defining Global Market Size (Value, Volume* & Price*)

Note*: In applicable scenarios
Step 3 - Data Sources
Primary Research
- Web Analytics
- Survey Reports
- Research Institute
- Latest Research Reports
- Opinion Leaders
Secondary Research
- Annual Reports
- White Paper
- Latest Press Release
- Industry Association
- Paid Database
- Investor Presentations

Step 4 - Data Triangulation
Involves using different sources of information in order to increase the validity of a study
These sources are likely to be stakeholders in a program - participants, other researchers, program staff, other community members, and so on.
Then we put all data in single framework & apply various statistical tools to find out the dynamic on the market.
During the analysis stage, feedback from the stakeholder groups would be compared to determine areas of agreement as well as areas of divergence


