
Key Insights
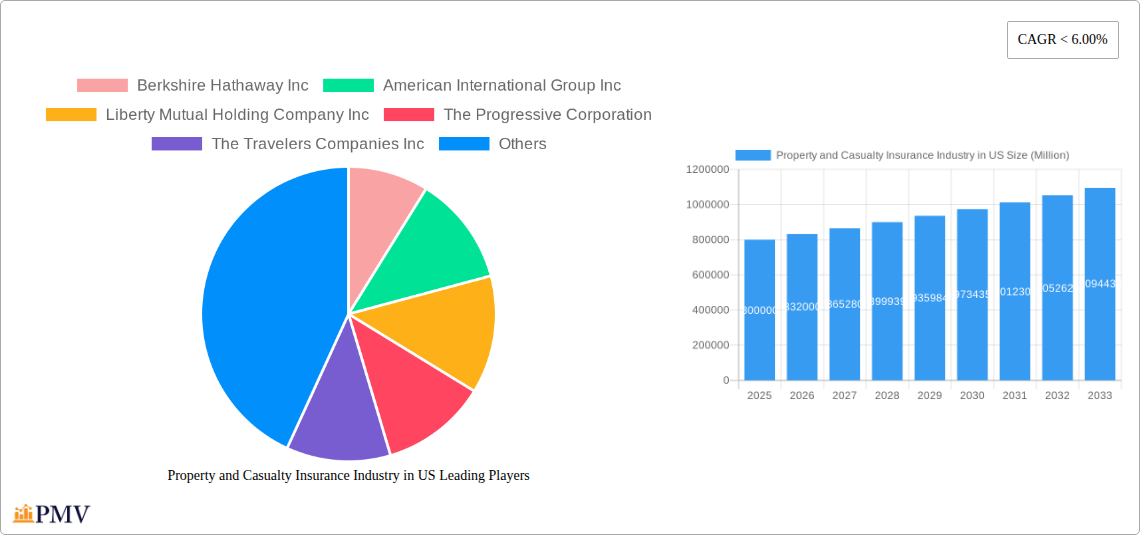
The US Property and Casualty (P&C) insurance market, a substantial segment of the broader insurance industry, exhibits robust growth driven by factors such as increasing urbanization, rising disposable incomes, and growing awareness of risk mitigation. The market's size in 2025 is estimated at $800 billion, reflecting a compound annual growth rate (CAGR) that has averaged approximately 4% over the historical period (2019-2024). This growth is fueled by consistent demand for property insurance, particularly in high-risk areas prone to natural disasters, as well as escalating liability concerns among businesses and individuals. Furthermore, technological advancements, such as the implementation of telematics and AI-driven risk assessment tools, are improving underwriting accuracy and efficiency, driving further market expansion. Increased regulatory scrutiny and the need for compliance are also influencing market growth, compelling insurers to adopt sophisticated risk management strategies and invest in compliance-related technologies. Competitive pressures remain intense, with established players vying for market share alongside emerging insurtech companies offering innovative digital solutions.
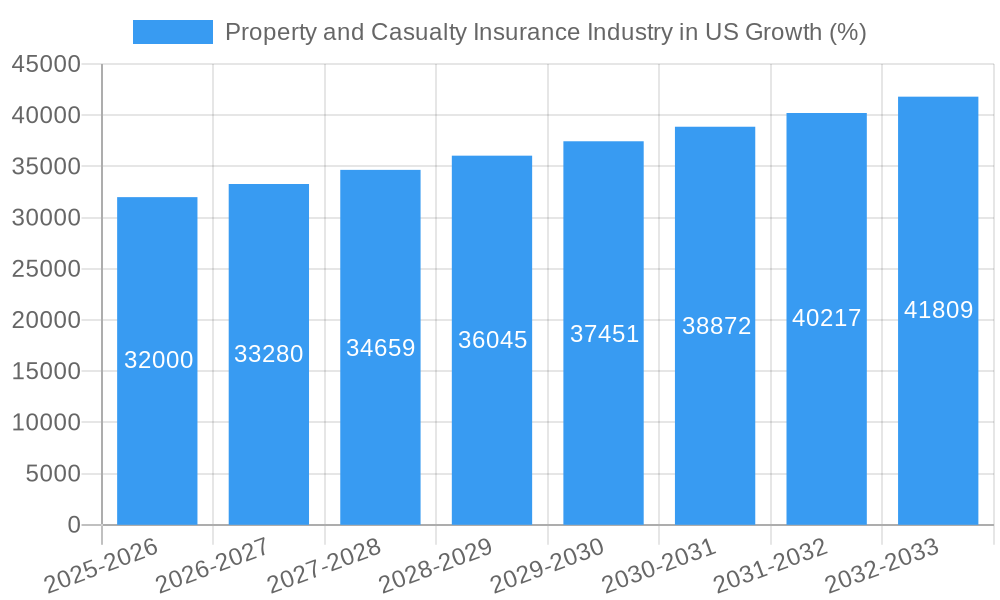
The forecast period (2025-2033) anticipates continued growth, albeit at a potentially slightly moderated pace. This moderation could be attributable to factors such as economic cycles and evolving consumer behavior, alongside the ongoing influence of intense competition and increasing regulatory requirements. The market is expected to continue its expansion, driven by the long-term trend of rising property values and expanding economic activity. However, insurers must strategically adapt to shifting demographics, evolving risk profiles, and the increasing demand for personalized and digital-first insurance solutions to maintain competitiveness and capture sustained market growth within the P&C sector. The focus on climate change risk and its impact on property insurance will undoubtedly play a crucial role in shaping the market's future.
Property & Casualty Insurance Industry in US: A Comprehensive Market Report (2019-2033)
This comprehensive report provides a detailed analysis of the US Property and Casualty (P&C) insurance industry, offering invaluable insights for investors, insurers, and industry stakeholders. Covering the period from 2019 to 2033, with a base year of 2025 and a forecast period of 2025-2033, this report delivers a robust understanding of market dynamics, competitive landscapes, and future growth potential. The report analyzes key segments, leading players like Berkshire Hathaway Inc., American International Group Inc., and Liberty Mutual Holding Company Inc., and emerging trends shaping the industry's trajectory.
Property and Casualty Insurance Industry in US Market Structure & Competitive Dynamics
The US P&C insurance market exhibits a concentrated structure, dominated by a few large players, while a significant number of smaller insurers compete for market share. Market concentration is measured by the Herfindahl-Hirschman Index (HHI), which is xx in 2025. Berkshire Hathaway Inc. holds a significant market share, estimated at xx% in 2025, followed by American International Group Inc. (AIG) with xx%. The industry's innovative ecosystem is driven by Insurtech companies developing technological solutions, such as AI-powered risk assessment and claims processing. Regulatory frameworks, such as those set by the National Association of Insurance Commissioners (NAIC), play a crucial role in shaping industry practices and consumer protection.
Product substitutes are limited, primarily focusing on self-insurance for certain risks. However, the rise of Insurtech and alternative risk transfer mechanisms is introducing new competition. End-user trends reveal an increasing demand for personalized and digital insurance solutions. The industry has seen notable M&A activity, with deal values exceeding $xx Million in 2024. Key examples include [Specific Example of M&A if available, otherwise state "xx"].
- Market Concentration: High, with top 5 players holding xx% of market share in 2025.
- Innovation Ecosystems: Driven by Insurtech and AI development.
- Regulatory Framework: Primarily governed by state-level regulations and the NAIC.
- M&A Activity: Significant activity, with total deal values exceeding $xx Million in 2024.
Property and Casualty Insurance Industry in US Industry Trends & Insights
The US P&C insurance market is projected to experience a Compound Annual Growth Rate (CAGR) of xx% during the forecast period (2025-2033), driven by factors such as increasing urbanization, rising personal and commercial property values, and the growing adoption of technology. Technological disruptions, particularly in areas like artificial intelligence (AI), telematics, and blockchain, are transforming operational efficiency and customer experience. Consumer preferences are shifting towards digital solutions, personalized coverage, and value-added services. The competitive dynamics are marked by intense rivalry among established players and the emergence of Insurtech disruptors. Market penetration for digital insurance products is expected to reach xx% by 2033.
The growth is further fueled by increasing awareness of insurance needs and changing economic conditions which create demand for risk mitigation and protection. The market is becoming increasingly fragmented with increasing entry of new players both locally and internationally. These market forces shape the landscape of the P&C industry, impacting pricing, competition, and technological advancements.
Dominant Markets & Segments in Property and Casualty Insurance Industry in US
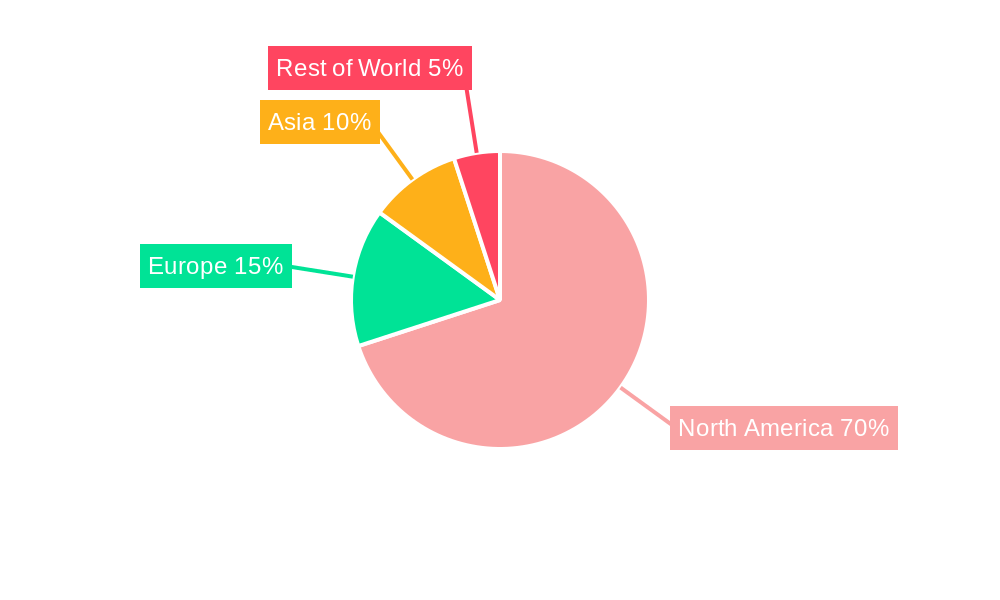
The dominant segment within the US P&C insurance market is commercial property insurance, which accounts for xx% of the total market value in 2025. This dominance is driven by the large and diversified commercial real estate sector, robust economic activity, and the inherent risks associated with commercial properties. The leading geographical region is the Northeast, exhibiting strong economic activity, high property values, and a significant concentration of commercial enterprises.
- Key Drivers of Commercial Property Insurance Dominance:
- High concentration of commercial real estate.
- Robust economic activity in specific regions.
- Increased risk awareness among businesses.
- Stringent regulatory requirements.
The Southeast shows promising growth potential with its expanding infrastructure and growing population. The Midwest and West regions present opportunities and challenges in the different segments of property and casualty insurance.
Property and Casualty Insurance Industry in US Product Innovations
Recent product innovations focus on leveraging technological advancements to improve risk assessment, pricing accuracy, and customer engagement. The integration of telematics into auto insurance, AI-powered fraud detection, and personalized pricing models are transforming the industry. These innovations offer competitive advantages by enhancing efficiency, reducing costs, and improving customer satisfaction. The market fit of these new products is largely determined by consumer adoption rates and regulatory acceptance.
Report Segmentation & Scope
The report segments the US P&C insurance market based on several factors, including:
Product Type: Auto, Homeowners, Commercial Property, Commercial Liability, and others. Each segment demonstrates varying growth projections, with the auto insurance segment anticipated to show a CAGR of xx% by 2033. The commercial segment is projected to maintain strong growth due to increasing commercial activities.
Distribution Channel: Independent agents, direct writers, and online platforms. The online channel is experiencing rapid growth, driven by consumer preference for digital solutions.
Geographic Location: Northeast, Southeast, Midwest, and West. Each region presents unique market characteristics impacting growth and competition.
Key Drivers of Property and Casualty Insurance Industry in US Growth
Growth is fueled by several factors, including increased awareness of risks, rising property values (both residential and commercial), and the adoption of advanced technology in risk management. Favorable economic conditions in certain regions also bolster demand. Stringent government regulations, focusing on consumer protection and risk mitigation, contribute indirectly to market growth. The development of new insurance products tailored to the specific needs of businesses and consumers further fuels industry growth.
Challenges in the Property and Casualty Insurance Industry in US Sector
The industry faces challenges including increasing regulatory scrutiny, impacting operational costs and product development timelines. Supply chain disruptions and inflation impact claims processing and pricing. Intense competition, including the emergence of Insurtech companies, puts pressure on profit margins. The impact is measured by reduced profitability and market share consolidation among established players. Catastrophic events, like hurricanes and wildfires, pose significant financial risks, potentially impacting insurer solvency. The challenges mentioned here are some of the major ones that negatively impact the sector and can be further analyzed in depth.
Leading Players in the Property and Casualty Insurance Industry in US Market
- Berkshire Hathaway Inc.
- American International Group Inc.
- Liberty Mutual Holding Company Inc.
- The Progressive Corporation
- The Travelers Companies Inc.
- United Services Automobile Association
- Farmers Group Inc.
- American Family Mutual Insurance Company S I
- W R Berkley Corporation
- American Financial Group Inc.
- List Not Exhaustive
Key Developments in Property and Casualty Insurance Industry in US Sector
- 2022 Q4: Increased adoption of telematics-based auto insurance.
- 2023 Q1: Launch of several AI-powered claims processing platforms.
- 2023 Q3: Significant M&A activity amongst Insurtech startups.
- 2024 Q2: Implementation of new cybersecurity regulations impacting data management.
- Further developments will be added based on latest data
Strategic Property and Casualty Insurance Industry in US Market Outlook
The US P&C insurance market holds significant future potential, driven by technological innovation, changing consumer preferences, and evolving risk landscapes. Strategic opportunities exist for companies that can leverage data analytics, AI, and personalized insurance offerings to improve efficiency and customer experience. Expansion into underserved markets and strategic partnerships offer further avenues for growth. The market is poised for continued consolidation, with larger players likely to acquire smaller firms to gain market share and scale.
Property and Casualty Insurance Industry in US Segmentation
-
1. Insurance Type
- 1.1. Home
- 1.2. Motor
- 1.3. Others
-
2. Channel of Distribution
- 2.1. Direct
- 2.2. Agency
- 2.3. Banks
- 2.4. Others
Property and Casualty Insurance Industry in US Segmentation By Geography
-
1. North America
- 1.1. United States
- 1.2. Canada
- 1.3. Mexico
-
2. South America
- 2.1. Brazil
- 2.2. Argentina
- 2.3. Rest of South America
-
3. Europe
- 3.1. United Kingdom
- 3.2. Germany
- 3.3. France
- 3.4. Italy
- 3.5. Spain
- 3.6. Russia
- 3.7. Benelux
- 3.8. Nordics
- 3.9. Rest of Europe
-
4. Middle East & Africa
- 4.1. Turkey
- 4.2. Israel
- 4.3. GCC
- 4.4. North Africa
- 4.5. South Africa
- 4.6. Rest of Middle East & Africa
-
5. Asia Pacific
- 5.1. China
- 5.2. India
- 5.3. Japan
- 5.4. South Korea
- 5.5. ASEAN
- 5.6. Oceania
- 5.7. Rest of Asia Pacific
Property and Casualty Insurance Industry in US REPORT HIGHLIGHTS
| Aspects | Details |
|---|---|
| Study Period | 2019-2033 |
| Base Year | 2024 |
| Estimated Year | 2025 |
| Forecast Period | 2025-2033 |
| Historical Period | 2019-2024 |
| Growth Rate | CAGR of < 6.00% from 2019-2033 |
| Segmentation |
|
Table of Contents
- 1. Introduction
- 1.1. Research Scope
- 1.2. Market Segmentation
- 1.3. Research Methodology
- 1.4. Definitions and Assumptions
- 2. Executive Summary
- 2.1. Introduction
- 3. Market Dynamics
- 3.1. Introduction
- 3.2. Market Drivers
- 3.3. Market Restrains
- 3.4. Market Trends
- 3.4.1. RPA is Going to Help in Quick Process
- 4. Market Factor Analysis
- 4.1. Porters Five Forces
- 4.2. Supply/Value Chain
- 4.3. PESTEL analysis
- 4.4. Market Entropy
- 4.5. Patent/Trademark Analysis
- 5. Global Property and Casualty Insurance Industry in US Analysis, Insights and Forecast, 2019-2031
- 5.1. Market Analysis, Insights and Forecast - by Insurance Type
- 5.1.1. Home
- 5.1.2. Motor
- 5.1.3. Others
- 5.2. Market Analysis, Insights and Forecast - by Channel of Distribution
- 5.2.1. Direct
- 5.2.2. Agency
- 5.2.3. Banks
- 5.2.4. Others
- 5.3. Market Analysis, Insights and Forecast - by Region
- 5.3.1. North America
- 5.3.2. South America
- 5.3.3. Europe
- 5.3.4. Middle East & Africa
- 5.3.5. Asia Pacific
- 5.1. Market Analysis, Insights and Forecast - by Insurance Type
- 6. North America Property and Casualty Insurance Industry in US Analysis, Insights and Forecast, 2019-2031
- 6.1. Market Analysis, Insights and Forecast - by Insurance Type
- 6.1.1. Home
- 6.1.2. Motor
- 6.1.3. Others
- 6.2. Market Analysis, Insights and Forecast - by Channel of Distribution
- 6.2.1. Direct
- 6.2.2. Agency
- 6.2.3. Banks
- 6.2.4. Others
- 6.1. Market Analysis, Insights and Forecast - by Insurance Type
- 7. South America Property and Casualty Insurance Industry in US Analysis, Insights and Forecast, 2019-2031
- 7.1. Market Analysis, Insights and Forecast - by Insurance Type
- 7.1.1. Home
- 7.1.2. Motor
- 7.1.3. Others
- 7.2. Market Analysis, Insights and Forecast - by Channel of Distribution
- 7.2.1. Direct
- 7.2.2. Agency
- 7.2.3. Banks
- 7.2.4. Others
- 7.1. Market Analysis, Insights and Forecast - by Insurance Type
- 8. Europe Property and Casualty Insurance Industry in US Analysis, Insights and Forecast, 2019-2031
- 8.1. Market Analysis, Insights and Forecast - by Insurance Type
- 8.1.1. Home
- 8.1.2. Motor
- 8.1.3. Others
- 8.2. Market Analysis, Insights and Forecast - by Channel of Distribution
- 8.2.1. Direct
- 8.2.2. Agency
- 8.2.3. Banks
- 8.2.4. Others
- 8.1. Market Analysis, Insights and Forecast - by Insurance Type
- 9. Middle East & Africa Property and Casualty Insurance Industry in US Analysis, Insights and Forecast, 2019-2031
- 9.1. Market Analysis, Insights and Forecast - by Insurance Type
- 9.1.1. Home
- 9.1.2. Motor
- 9.1.3. Others
- 9.2. Market Analysis, Insights and Forecast - by Channel of Distribution
- 9.2.1. Direct
- 9.2.2. Agency
- 9.2.3. Banks
- 9.2.4. Others
- 9.1. Market Analysis, Insights and Forecast - by Insurance Type
- 10. Asia Pacific Property and Casualty Insurance Industry in US Analysis, Insights and Forecast, 2019-2031
- 10.1. Market Analysis, Insights and Forecast - by Insurance Type
- 10.1.1. Home
- 10.1.2. Motor
- 10.1.3. Others
- 10.2. Market Analysis, Insights and Forecast - by Channel of Distribution
- 10.2.1. Direct
- 10.2.2. Agency
- 10.2.3. Banks
- 10.2.4. Others
- 10.1. Market Analysis, Insights and Forecast - by Insurance Type
- 11. Competitive Analysis
- 11.1. Global Market Share Analysis 2024
- 11.2. Company Profiles
- 11.2.1 Berkshire Hathaway Inc
- 11.2.1.1. Overview
- 11.2.1.2. Products
- 11.2.1.3. SWOT Analysis
- 11.2.1.4. Recent Developments
- 11.2.1.5. Financials (Based on Availability)
- 11.2.2 American International Group Inc
- 11.2.2.1. Overview
- 11.2.2.2. Products
- 11.2.2.3. SWOT Analysis
- 11.2.2.4. Recent Developments
- 11.2.2.5. Financials (Based on Availability)
- 11.2.3 Liberty Mutual Holding Company Inc
- 11.2.3.1. Overview
- 11.2.3.2. Products
- 11.2.3.3. SWOT Analysis
- 11.2.3.4. Recent Developments
- 11.2.3.5. Financials (Based on Availability)
- 11.2.4 The Progressive Corporation
- 11.2.4.1. Overview
- 11.2.4.2. Products
- 11.2.4.3. SWOT Analysis
- 11.2.4.4. Recent Developments
- 11.2.4.5. Financials (Based on Availability)
- 11.2.5 The Travelers Companies Inc
- 11.2.5.1. Overview
- 11.2.5.2. Products
- 11.2.5.3. SWOT Analysis
- 11.2.5.4. Recent Developments
- 11.2.5.5. Financials (Based on Availability)
- 11.2.6 United Services Automobile Association
- 11.2.6.1. Overview
- 11.2.6.2. Products
- 11.2.6.3. SWOT Analysis
- 11.2.6.4. Recent Developments
- 11.2.6.5. Financials (Based on Availability)
- 11.2.7 Farmers Group Inc
- 11.2.7.1. Overview
- 11.2.7.2. Products
- 11.2.7.3. SWOT Analysis
- 11.2.7.4. Recent Developments
- 11.2.7.5. Financials (Based on Availability)
- 11.2.8 American Family Mutual Insurance Company S I
- 11.2.8.1. Overview
- 11.2.8.2. Products
- 11.2.8.3. SWOT Analysis
- 11.2.8.4. Recent Developments
- 11.2.8.5. Financials (Based on Availability)
- 11.2.9 W R Berkley Corporation
- 11.2.9.1. Overview
- 11.2.9.2. Products
- 11.2.9.3. SWOT Analysis
- 11.2.9.4. Recent Developments
- 11.2.9.5. Financials (Based on Availability)
- 11.2.10 American Financial Group Inc *List Not Exhaustive
- 11.2.10.1. Overview
- 11.2.10.2. Products
- 11.2.10.3. SWOT Analysis
- 11.2.10.4. Recent Developments
- 11.2.10.5. Financials (Based on Availability)
- 11.2.1 Berkshire Hathaway Inc
List of Figures
- Figure 1: Global Property and Casualty Insurance Industry in US Revenue Breakdown (Million, %) by Region 2024 & 2032
- Figure 2: North America Property and Casualty Insurance Industry in US Revenue (Million), by Insurance Type 2024 & 2032
- Figure 3: North America Property and Casualty Insurance Industry in US Revenue Share (%), by Insurance Type 2024 & 2032
- Figure 4: North America Property and Casualty Insurance Industry in US Revenue (Million), by Channel of Distribution 2024 & 2032
- Figure 5: North America Property and Casualty Insurance Industry in US Revenue Share (%), by Channel of Distribution 2024 & 2032
- Figure 6: North America Property and Casualty Insurance Industry in US Revenue (Million), by Country 2024 & 2032
- Figure 7: North America Property and Casualty Insurance Industry in US Revenue Share (%), by Country 2024 & 2032
- Figure 8: South America Property and Casualty Insurance Industry in US Revenue (Million), by Insurance Type 2024 & 2032
- Figure 9: South America Property and Casualty Insurance Industry in US Revenue Share (%), by Insurance Type 2024 & 2032
- Figure 10: South America Property and Casualty Insurance Industry in US Revenue (Million), by Channel of Distribution 2024 & 2032
- Figure 11: South America Property and Casualty Insurance Industry in US Revenue Share (%), by Channel of Distribution 2024 & 2032
- Figure 12: South America Property and Casualty Insurance Industry in US Revenue (Million), by Country 2024 & 2032
- Figure 13: South America Property and Casualty Insurance Industry in US Revenue Share (%), by Country 2024 & 2032
- Figure 14: Europe Property and Casualty Insurance Industry in US Revenue (Million), by Insurance Type 2024 & 2032
- Figure 15: Europe Property and Casualty Insurance Industry in US Revenue Share (%), by Insurance Type 2024 & 2032
- Figure 16: Europe Property and Casualty Insurance Industry in US Revenue (Million), by Channel of Distribution 2024 & 2032
- Figure 17: Europe Property and Casualty Insurance Industry in US Revenue Share (%), by Channel of Distribution 2024 & 2032
- Figure 18: Europe Property and Casualty Insurance Industry in US Revenue (Million), by Country 2024 & 2032
- Figure 19: Europe Property and Casualty Insurance Industry in US Revenue Share (%), by Country 2024 & 2032
- Figure 20: Middle East & Africa Property and Casualty Insurance Industry in US Revenue (Million), by Insurance Type 2024 & 2032
- Figure 21: Middle East & Africa Property and Casualty Insurance Industry in US Revenue Share (%), by Insurance Type 2024 & 2032
- Figure 22: Middle East & Africa Property and Casualty Insurance Industry in US Revenue (Million), by Channel of Distribution 2024 & 2032
- Figure 23: Middle East & Africa Property and Casualty Insurance Industry in US Revenue Share (%), by Channel of Distribution 2024 & 2032
- Figure 24: Middle East & Africa Property and Casualty Insurance Industry in US Revenue (Million), by Country 2024 & 2032
- Figure 25: Middle East & Africa Property and Casualty Insurance Industry in US Revenue Share (%), by Country 2024 & 2032
- Figure 26: Asia Pacific Property and Casualty Insurance Industry in US Revenue (Million), by Insurance Type 2024 & 2032
- Figure 27: Asia Pacific Property and Casualty Insurance Industry in US Revenue Share (%), by Insurance Type 2024 & 2032
- Figure 28: Asia Pacific Property and Casualty Insurance Industry in US Revenue (Million), by Channel of Distribution 2024 & 2032
- Figure 29: Asia Pacific Property and Casualty Insurance Industry in US Revenue Share (%), by Channel of Distribution 2024 & 2032
- Figure 30: Asia Pacific Property and Casualty Insurance Industry in US Revenue (Million), by Country 2024 & 2032
- Figure 31: Asia Pacific Property and Casualty Insurance Industry in US Revenue Share (%), by Country 2024 & 2032
List of Tables
- Table 1: Global Property and Casualty Insurance Industry in US Revenue Million Forecast, by Region 2019 & 2032
- Table 2: Global Property and Casualty Insurance Industry in US Revenue Million Forecast, by Insurance Type 2019 & 2032
- Table 3: Global Property and Casualty Insurance Industry in US Revenue Million Forecast, by Channel of Distribution 2019 & 2032
- Table 4: Global Property and Casualty Insurance Industry in US Revenue Million Forecast, by Region 2019 & 2032
- Table 5: Global Property and Casualty Insurance Industry in US Revenue Million Forecast, by Insurance Type 2019 & 2032
- Table 6: Global Property and Casualty Insurance Industry in US Revenue Million Forecast, by Channel of Distribution 2019 & 2032
- Table 7: Global Property and Casualty Insurance Industry in US Revenue Million Forecast, by Country 2019 & 2032
- Table 8: United States Property and Casualty Insurance Industry in US Revenue (Million) Forecast, by Application 2019 & 2032
- Table 9: Canada Property and Casualty Insurance Industry in US Revenue (Million) Forecast, by Application 2019 & 2032
- Table 10: Mexico Property and Casualty Insurance Industry in US Revenue (Million) Forecast, by Application 2019 & 2032
- Table 11: Global Property and Casualty Insurance Industry in US Revenue Million Forecast, by Insurance Type 2019 & 2032
- Table 12: Global Property and Casualty Insurance Industry in US Revenue Million Forecast, by Channel of Distribution 2019 & 2032
- Table 13: Global Property and Casualty Insurance Industry in US Revenue Million Forecast, by Country 2019 & 2032
- Table 14: Brazil Property and Casualty Insurance Industry in US Revenue (Million) Forecast, by Application 2019 & 2032
- Table 15: Argentina Property and Casualty Insurance Industry in US Revenue (Million) Forecast, by Application 2019 & 2032
- Table 16: Rest of South America Property and Casualty Insurance Industry in US Revenue (Million) Forecast, by Application 2019 & 2032
- Table 17: Global Property and Casualty Insurance Industry in US Revenue Million Forecast, by Insurance Type 2019 & 2032
- Table 18: Global Property and Casualty Insurance Industry in US Revenue Million Forecast, by Channel of Distribution 2019 & 2032
- Table 19: Global Property and Casualty Insurance Industry in US Revenue Million Forecast, by Country 2019 & 2032
- Table 20: United Kingdom Property and Casualty Insurance Industry in US Revenue (Million) Forecast, by Application 2019 & 2032
- Table 21: Germany Property and Casualty Insurance Industry in US Revenue (Million) Forecast, by Application 2019 & 2032
- Table 22: France Property and Casualty Insurance Industry in US Revenue (Million) Forecast, by Application 2019 & 2032
- Table 23: Italy Property and Casualty Insurance Industry in US Revenue (Million) Forecast, by Application 2019 & 2032
- Table 24: Spain Property and Casualty Insurance Industry in US Revenue (Million) Forecast, by Application 2019 & 2032
- Table 25: Russia Property and Casualty Insurance Industry in US Revenue (Million) Forecast, by Application 2019 & 2032
- Table 26: Benelux Property and Casualty Insurance Industry in US Revenue (Million) Forecast, by Application 2019 & 2032
- Table 27: Nordics Property and Casualty Insurance Industry in US Revenue (Million) Forecast, by Application 2019 & 2032
- Table 28: Rest of Europe Property and Casualty Insurance Industry in US Revenue (Million) Forecast, by Application 2019 & 2032
- Table 29: Global Property and Casualty Insurance Industry in US Revenue Million Forecast, by Insurance Type 2019 & 2032
- Table 30: Global Property and Casualty Insurance Industry in US Revenue Million Forecast, by Channel of Distribution 2019 & 2032
- Table 31: Global Property and Casualty Insurance Industry in US Revenue Million Forecast, by Country 2019 & 2032
- Table 32: Turkey Property and Casualty Insurance Industry in US Revenue (Million) Forecast, by Application 2019 & 2032
- Table 33: Israel Property and Casualty Insurance Industry in US Revenue (Million) Forecast, by Application 2019 & 2032
- Table 34: GCC Property and Casualty Insurance Industry in US Revenue (Million) Forecast, by Application 2019 & 2032
- Table 35: North Africa Property and Casualty Insurance Industry in US Revenue (Million) Forecast, by Application 2019 & 2032
- Table 36: South Africa Property and Casualty Insurance Industry in US Revenue (Million) Forecast, by Application 2019 & 2032
- Table 37: Rest of Middle East & Africa Property and Casualty Insurance Industry in US Revenue (Million) Forecast, by Application 2019 & 2032
- Table 38: Global Property and Casualty Insurance Industry in US Revenue Million Forecast, by Insurance Type 2019 & 2032
- Table 39: Global Property and Casualty Insurance Industry in US Revenue Million Forecast, by Channel of Distribution 2019 & 2032
- Table 40: Global Property and Casualty Insurance Industry in US Revenue Million Forecast, by Country 2019 & 2032
- Table 41: China Property and Casualty Insurance Industry in US Revenue (Million) Forecast, by Application 2019 & 2032
- Table 42: India Property and Casualty Insurance Industry in US Revenue (Million) Forecast, by Application 2019 & 2032
- Table 43: Japan Property and Casualty Insurance Industry in US Revenue (Million) Forecast, by Application 2019 & 2032
- Table 44: South Korea Property and Casualty Insurance Industry in US Revenue (Million) Forecast, by Application 2019 & 2032
- Table 45: ASEAN Property and Casualty Insurance Industry in US Revenue (Million) Forecast, by Application 2019 & 2032
- Table 46: Oceania Property and Casualty Insurance Industry in US Revenue (Million) Forecast, by Application 2019 & 2032
- Table 47: Rest of Asia Pacific Property and Casualty Insurance Industry in US Revenue (Million) Forecast, by Application 2019 & 2032
Frequently Asked Questions
1. What is the projected Compound Annual Growth Rate (CAGR) of the Property and Casualty Insurance Industry in US?
The projected CAGR is approximately < 6.00%.
2. Which companies are prominent players in the Property and Casualty Insurance Industry in US?
Key companies in the market include Berkshire Hathaway Inc, American International Group Inc, Liberty Mutual Holding Company Inc, The Progressive Corporation, The Travelers Companies Inc, United Services Automobile Association, Farmers Group Inc, American Family Mutual Insurance Company S I, W R Berkley Corporation, American Financial Group Inc *List Not Exhaustive.
3. What are the main segments of the Property and Casualty Insurance Industry in US?
The market segments include Insurance Type, Channel of Distribution.
4. Can you provide details about the market size?
The market size is estimated to be USD XX Million as of 2022.
5. What are some drivers contributing to market growth?
N/A
6. What are the notable trends driving market growth?
RPA is Going to Help in Quick Process:.
7. Are there any restraints impacting market growth?
N/A
8. Can you provide examples of recent developments in the market?
N/A
9. What pricing options are available for accessing the report?
Pricing options include single-user, multi-user, and enterprise licenses priced at USD 3800, USD 4500, and USD 5800 respectively.
10. Is the market size provided in terms of value or volume?
The market size is provided in terms of value, measured in Million.
11. Are there any specific market keywords associated with the report?
Yes, the market keyword associated with the report is "Property and Casualty Insurance Industry in US," which aids in identifying and referencing the specific market segment covered.
12. How do I determine which pricing option suits my needs best?
The pricing options vary based on user requirements and access needs. Individual users may opt for single-user licenses, while businesses requiring broader access may choose multi-user or enterprise licenses for cost-effective access to the report.
13. Are there any additional resources or data provided in the Property and Casualty Insurance Industry in US report?
While the report offers comprehensive insights, it's advisable to review the specific contents or supplementary materials provided to ascertain if additional resources or data are available.
14. How can I stay updated on further developments or reports in the Property and Casualty Insurance Industry in US?
To stay informed about further developments, trends, and reports in the Property and Casualty Insurance Industry in US, consider subscribing to industry newsletters, following relevant companies and organizations, or regularly checking reputable industry news sources and publications.
Methodology
Step 1 - Identification of Relevant Samples Size from Population Database


Step 2 - Approaches for Defining Global Market Size (Value, Volume* & Price*)

Note*: In applicable scenarios
Step 3 - Data Sources
Primary Research
- Web Analytics
- Survey Reports
- Research Institute
- Latest Research Reports
- Opinion Leaders
Secondary Research
- Annual Reports
- White Paper
- Latest Press Release
- Industry Association
- Paid Database
- Investor Presentations

Step 4 - Data Triangulation
Involves using different sources of information in order to increase the validity of a study
These sources are likely to be stakeholders in a program - participants, other researchers, program staff, other community members, and so on.
Then we put all data in single framework & apply various statistical tools to find out the dynamic on the market.
During the analysis stage, feedback from the stakeholder groups would be compared to determine areas of agreement as well as areas of divergence


