
Key Insights
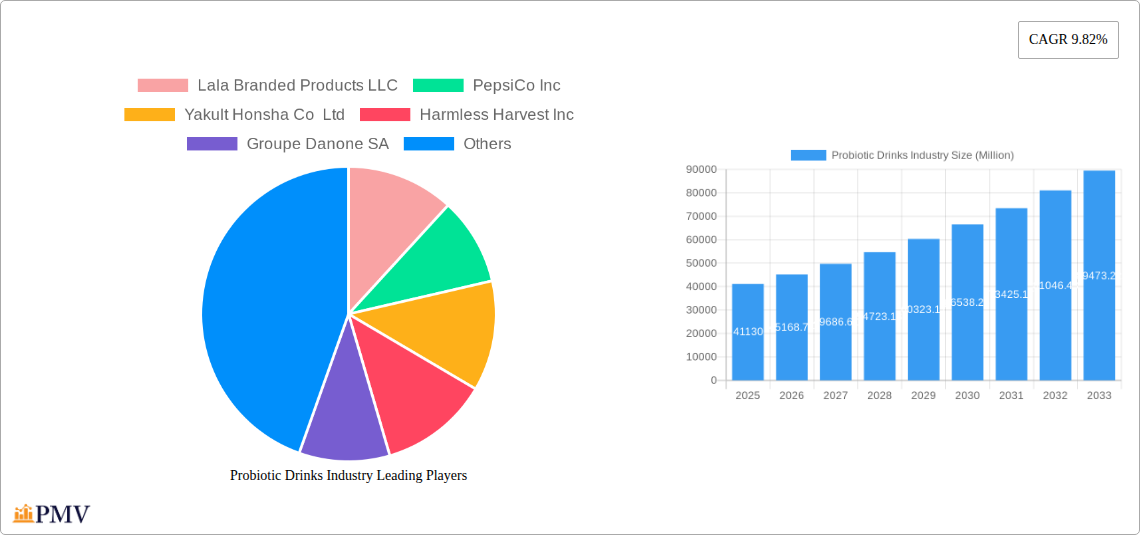
The global probiotic drinks market, valued at $41.13 billion in 2025, is projected to experience robust growth, driven by increasing consumer awareness of gut health and the associated benefits of probiotic consumption. This burgeoning market is fueled by several key factors. The rising prevalence of lifestyle diseases like obesity and diabetes, linked to gut microbiota imbalance, is significantly boosting demand. Furthermore, the growing preference for functional beverages offering health benefits beyond simple hydration is driving consumption. Product innovation, including the development of novel flavors and formats (e.g., ready-to-drink probiotic shots, sparkling probiotic beverages), caters to evolving consumer preferences and expands market reach. The expansion into various distribution channels, including online retail and specialized health stores, also contributes to market growth. Yogurt drinks and fermented milk drinks currently dominate the product type segment, but kombucha and kefir are experiencing significant growth, fueled by their perceived health benefits and trendy appeal. Geographically, North America and Europe currently hold substantial market share, but Asia-Pacific is projected to witness the fastest growth rate due to rising disposable incomes and increased health consciousness. However, challenges remain, such as maintaining product stability and addressing potential consumer concerns about taste and texture.
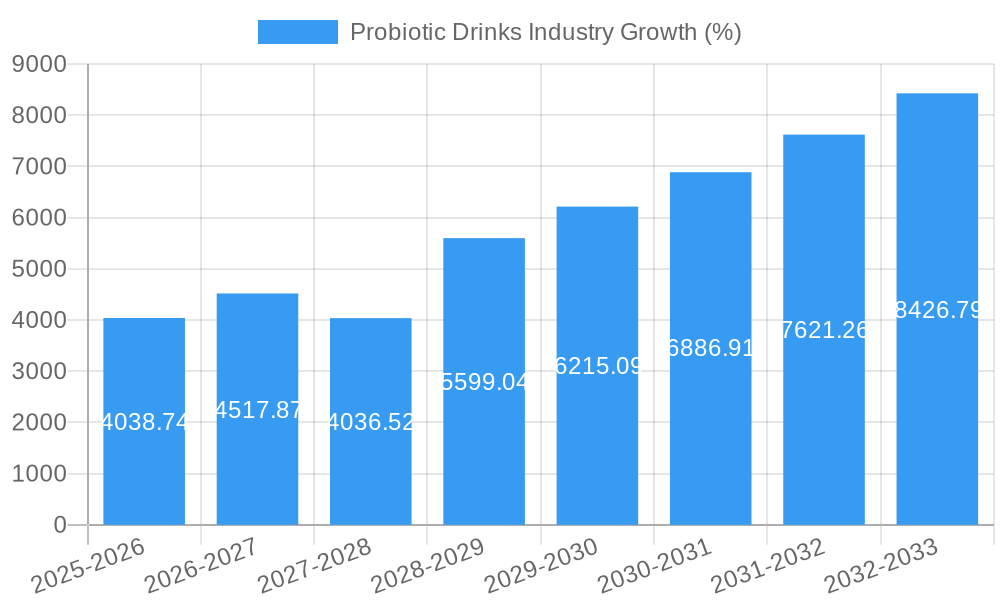
The projected Compound Annual Growth Rate (CAGR) of 9.82% from 2025 to 2033 signifies substantial future expansion. This growth trajectory is expected to be influenced by several factors including advancements in probiotic strain research leading to enhanced efficacy and improved product formulations. Strategic collaborations between probiotic manufacturers and food and beverage companies further facilitate market penetration and brand recognition. Regulatory changes and evolving consumer perceptions around health and wellness will also play pivotal roles in shaping the market's future. Competitive dynamics will continue to impact growth, with established players focusing on innovation and expansion while smaller, niche brands leverage their specialization and focus on unique product offerings to carve out market share. The market's future success will largely depend on effectively addressing consumer demands for natural, high-quality, and convenient probiotic products.
Probiotic Drinks Industry: A Comprehensive Market Report (2019-2033)
This comprehensive report provides an in-depth analysis of the global probiotic drinks industry, offering valuable insights into market dynamics, competitive landscapes, and future growth prospects. Covering the period from 2019 to 2033, with a focus on 2025, this report is an indispensable resource for industry stakeholders, investors, and researchers seeking to navigate this rapidly evolving market. The report is valued at xx Million and is expected to reach xx Million by 2033.
Probiotic Drinks Industry Market Structure & Competitive Dynamics
The probiotic drinks market is characterized by a diverse range of players, from multinational corporations to smaller niche brands. Market concentration is moderate, with a few key players holding significant market share, but a large number of smaller players contributing to overall market volume. The innovation ecosystem is vibrant, driven by ongoing research into probiotic strains, delivery systems, and functional benefits. Regulatory frameworks vary across regions, impacting product labeling, claims, and approval processes. Substitutes exist in the form of other functional beverages and dietary supplements, but the unique health benefits associated with probiotic drinks maintain a competitive edge. End-user trends increasingly favor healthier, natural products, boosting demand for probiotic drinks. M&A activity has been notable in recent years, with larger companies seeking to expand their portfolios through acquisitions of smaller, innovative players. Deal values have ranged from xx Million to xx Million in recent years, consolidating market share amongst leading players.
- Key Players: Lala Branded Products LLC, PepsiCo Inc, Yakult Honsha Co Ltd, Harmless Harvest Inc, Groupe Danone SA, Lifeway Foods Inc, Kerry Group PLC (Bio-K Plus International Inc), Obi Probiotic Soda, Fonterra Co-op Group Ltd, Groupe Lactalis (and others).
- Market Share Concentration: The top 5 players account for approximately xx% of the global market share in 2025.
- M&A Activity: An average of xx M&A deals have been recorded annually during the historical period (2019-2024), with deal values averaging xx Million.
Probiotic Drinks Industry Trends & Insights
The probiotic drinks market exhibits robust growth, driven by increasing consumer awareness of gut health's importance and the rising prevalence of health-conscious lifestyles. The market is expected to experience a Compound Annual Growth Rate (CAGR) of xx% during the forecast period (2025-2033). Technological advancements in probiotic strain development and product formulation are further fueling growth. Consumer preferences shift towards convenient, naturally flavored, and functional beverages with added benefits beyond gut health, such as immunity support and improved digestion. Market penetration is highest in developed countries but is experiencing rapid expansion in emerging markets with rising disposable incomes and increased health awareness. Competitive dynamics are marked by both innovation and consolidation, with larger companies engaging in both product diversification and strategic acquisitions.
Dominant Markets & Segments in Probiotic Drinks Industry
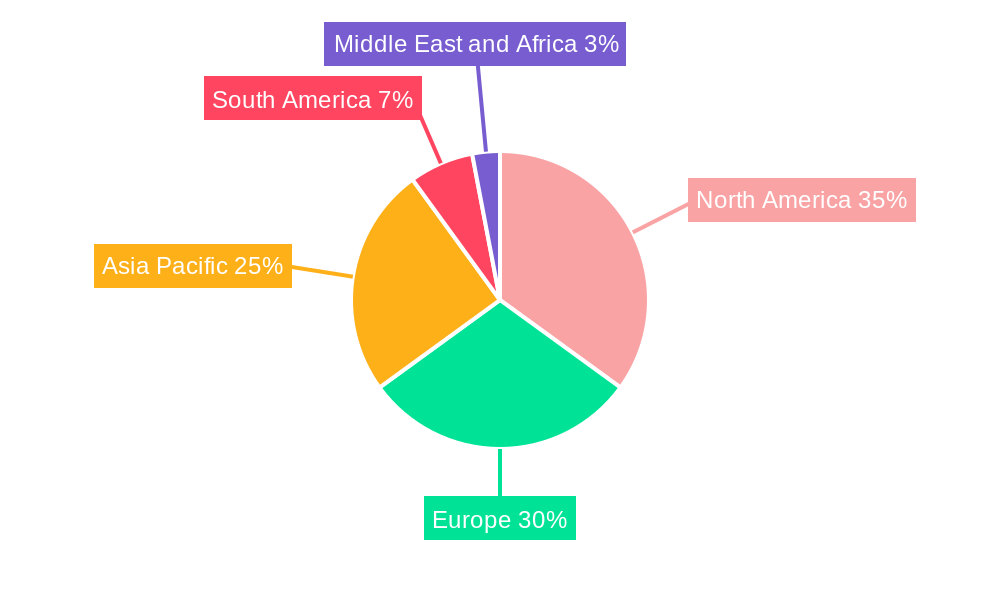
The North American region currently dominates the global probiotic drinks market, driven by high consumer health awareness and a well-established distribution network. Within product types, Yogurt Drinks and Fermented Milk Drinks hold the largest market share, followed by Kombucha and Kefir. Supermarkets/Hypermarkets remain the primary distribution channel, though convenience stores and pharmacies/health stores are experiencing significant growth.
- Leading Region: North America
- Dominant Product Type: Yogurt Drinks
- Leading Distribution Channel: Supermarkets/Hypermarkets
Key Drivers for Dominant Segments:
- North America: High disposable income, strong health-conscious culture, established retail infrastructure.
- Yogurt Drinks: Established consumer base, diverse product offerings, and widespread availability.
- Supermarkets/Hypermarkets: Extensive reach, established supply chains, and consumer familiarity.
Probiotic Drinks Industry Product Innovations
Recent innovations focus on enhancing taste profiles, improving shelf life, and developing unique functional blends. Technological advancements include the use of advanced probiotic strains with improved viability and efficacy and exploring novel delivery systems to optimize probiotic survival. This allows for the introduction of new product categories and functionalities to cater to evolving consumer preferences. Companies are increasingly focusing on creating convenient, portable formats, and incorporating natural ingredients and functional components to attract health-conscious consumers.
Report Segmentation & Scope
This report segments the probiotic drinks market by product type (Yogurt Drinks, Fermented Milk Drinks, Kombucha, Kefir, Probiotics Juices, Other Product Types) and distribution channel (Supermarkets/Hypermarkets, Convenience Stores, Pharmacies/Health Stores, Other Distribution Channels). Each segment's market size, growth projections, and competitive dynamics are analyzed. Yogurt drinks are expected to maintain significant market share, while the Kombucha and Kefir segments are anticipated to experience the highest growth rates during the forecast period. Supermarkets/Hypermarkets will remain the dominant distribution channel, with increasing penetration of convenience stores and specialized health stores.
Key Drivers of Probiotic Drinks Industry Growth
Several key factors drive the growth of the probiotic drinks industry:
- Increasing consumer awareness of gut health benefits.
- Rising demand for functional foods and beverages.
- Technological advancements in probiotic strain development and product formulation.
- Growth in health and wellness spending.
- Expansion of retail channels.
Challenges in the Probiotic Drinks Industry Sector
Despite the industry's growth potential, several challenges exist:
- Stringent regulatory frameworks for probiotic claims and labeling.
- Maintaining probiotic viability and stability throughout the product's shelf life.
- Intense competition from established players and new entrants.
- Fluctuations in raw material prices.
- Maintaining consistent product quality and supply chain reliability.
Leading Players in the Probiotic Drinks Industry Market
- Lala Branded Products LLC
- PepsiCo Inc
- Yakult Honsha Co Ltd
- Harmless Harvest Inc
- Groupe Danone SA
- Lifeway Foods Inc
- Kerry Group PLC (Bio-K Plus International Inc)
- Obi Probiotic Soda
- Fonterra Co-op Group Ltd
- Groupe Lactalis
Key Developments in Probiotic Drinks Industry Sector
- July 2021: PepsiCo launched KeVita Prebiotic Shots, a range of water-kefir-culture drinks.
- May 2022: Fonterra launched Nurture cultured milk in Singapore.
- June 2022: Danone launched Activa+, a multi-benefit drinkable yogurt.
Strategic Probiotic Drinks Industry Market Outlook
The probiotic drinks market presents significant growth potential driven by ongoing innovation, expanding consumer awareness, and the increasing demand for convenient, healthy beverages. Strategic opportunities exist in developing novel product formulations, expanding into new markets, and forging strategic partnerships to enhance market penetration and brand visibility. Focusing on sustainable and ethically sourced ingredients will resonate with environmentally conscious consumers, further strengthening market position. The focus on personalized nutrition and targeted health benefits will shape future product development and market segmentation.
Probiotic Drinks Industry Segmentation
-
1. Product Type
- 1.1. Yogurt Drinks
- 1.2. Fermented Milk Drinks
- 1.3. Kombucha
- 1.4. Kefir
- 1.5. Probiotics Juices
- 1.6. Other Product Types
-
2. Distribution Channel
- 2.1. Supermarkets/Hypermarkets
- 2.2. Convenience Stores
- 2.3. Pharmacies/Health Stores
- 2.4. Other Distribution Channels
Probiotic Drinks Industry Segmentation By Geography
-
1. North America
- 1.1. United States
- 1.2. Canada
- 1.3. Mexico
- 1.4. Rest of North America
-
2. Europe
- 2.1. United Kingdom
- 2.2. France
- 2.3. Germany
- 2.4. Italy
- 2.5. Spain
- 2.6. Russia
- 2.7. Rest of Europe
-
3. Asia Pacific
- 3.1. China
- 3.2. Japan
- 3.3. Australia
- 3.4. India
- 3.5. Rest of Asia Pacific
-
4. South America
- 4.1. Brazil
- 4.2. Argentina
- 4.3. Rest of South America
-
5. Middle East and Africa
- 5.1. South Africa
- 5.2. United Arab Emirates
- 5.3. Rest of Middle East and Africa
Probiotic Drinks Industry REPORT HIGHLIGHTS
| Aspects | Details |
|---|---|
| Study Period | 2019-2033 |
| Base Year | 2024 |
| Estimated Year | 2025 |
| Forecast Period | 2025-2033 |
| Historical Period | 2019-2024 |
| Growth Rate | CAGR of 9.82% from 2019-2033 |
| Segmentation |
|
Table of Contents
- 1. Introduction
- 1.1. Research Scope
- 1.2. Market Segmentation
- 1.3. Research Methodology
- 1.4. Definitions and Assumptions
- 2. Executive Summary
- 2.1. Introduction
- 3. Market Dynamics
- 3.1. Introduction
- 3.2. Market Drivers
- 3.2.1. Increasing Demand for Protein Rich Food and Supplements; Increasing Application of Collagen in Personal Care Products
- 3.3. Market Restrains
- 3.3.1. Increasing Demand for Plant-Based Protein
- 3.4. Market Trends
- 3.4.1. Growing Demand for Functional Beverages
- 4. Market Factor Analysis
- 4.1. Porters Five Forces
- 4.2. Supply/Value Chain
- 4.3. PESTEL analysis
- 4.4. Market Entropy
- 4.5. Patent/Trademark Analysis
- 5. Global Probiotic Drinks Industry Analysis, Insights and Forecast, 2019-2031
- 5.1. Market Analysis, Insights and Forecast - by Product Type
- 5.1.1. Yogurt Drinks
- 5.1.2. Fermented Milk Drinks
- 5.1.3. Kombucha
- 5.1.4. Kefir
- 5.1.5. Probiotics Juices
- 5.1.6. Other Product Types
- 5.2. Market Analysis, Insights and Forecast - by Distribution Channel
- 5.2.1. Supermarkets/Hypermarkets
- 5.2.2. Convenience Stores
- 5.2.3. Pharmacies/Health Stores
- 5.2.4. Other Distribution Channels
- 5.3. Market Analysis, Insights and Forecast - by Region
- 5.3.1. North America
- 5.3.2. Europe
- 5.3.3. Asia Pacific
- 5.3.4. South America
- 5.3.5. Middle East and Africa
- 5.1. Market Analysis, Insights and Forecast - by Product Type
- 6. North America Probiotic Drinks Industry Analysis, Insights and Forecast, 2019-2031
- 6.1. Market Analysis, Insights and Forecast - by Product Type
- 6.1.1. Yogurt Drinks
- 6.1.2. Fermented Milk Drinks
- 6.1.3. Kombucha
- 6.1.4. Kefir
- 6.1.5. Probiotics Juices
- 6.1.6. Other Product Types
- 6.2. Market Analysis, Insights and Forecast - by Distribution Channel
- 6.2.1. Supermarkets/Hypermarkets
- 6.2.2. Convenience Stores
- 6.2.3. Pharmacies/Health Stores
- 6.2.4. Other Distribution Channels
- 6.1. Market Analysis, Insights and Forecast - by Product Type
- 7. Europe Probiotic Drinks Industry Analysis, Insights and Forecast, 2019-2031
- 7.1. Market Analysis, Insights and Forecast - by Product Type
- 7.1.1. Yogurt Drinks
- 7.1.2. Fermented Milk Drinks
- 7.1.3. Kombucha
- 7.1.4. Kefir
- 7.1.5. Probiotics Juices
- 7.1.6. Other Product Types
- 7.2. Market Analysis, Insights and Forecast - by Distribution Channel
- 7.2.1. Supermarkets/Hypermarkets
- 7.2.2. Convenience Stores
- 7.2.3. Pharmacies/Health Stores
- 7.2.4. Other Distribution Channels
- 7.1. Market Analysis, Insights and Forecast - by Product Type
- 8. Asia Pacific Probiotic Drinks Industry Analysis, Insights and Forecast, 2019-2031
- 8.1. Market Analysis, Insights and Forecast - by Product Type
- 8.1.1. Yogurt Drinks
- 8.1.2. Fermented Milk Drinks
- 8.1.3. Kombucha
- 8.1.4. Kefir
- 8.1.5. Probiotics Juices
- 8.1.6. Other Product Types
- 8.2. Market Analysis, Insights and Forecast - by Distribution Channel
- 8.2.1. Supermarkets/Hypermarkets
- 8.2.2. Convenience Stores
- 8.2.3. Pharmacies/Health Stores
- 8.2.4. Other Distribution Channels
- 8.1. Market Analysis, Insights and Forecast - by Product Type
- 9. South America Probiotic Drinks Industry Analysis, Insights and Forecast, 2019-2031
- 9.1. Market Analysis, Insights and Forecast - by Product Type
- 9.1.1. Yogurt Drinks
- 9.1.2. Fermented Milk Drinks
- 9.1.3. Kombucha
- 9.1.4. Kefir
- 9.1.5. Probiotics Juices
- 9.1.6. Other Product Types
- 9.2. Market Analysis, Insights and Forecast - by Distribution Channel
- 9.2.1. Supermarkets/Hypermarkets
- 9.2.2. Convenience Stores
- 9.2.3. Pharmacies/Health Stores
- 9.2.4. Other Distribution Channels
- 9.1. Market Analysis, Insights and Forecast - by Product Type
- 10. Middle East and Africa Probiotic Drinks Industry Analysis, Insights and Forecast, 2019-2031
- 10.1. Market Analysis, Insights and Forecast - by Product Type
- 10.1.1. Yogurt Drinks
- 10.1.2. Fermented Milk Drinks
- 10.1.3. Kombucha
- 10.1.4. Kefir
- 10.1.5. Probiotics Juices
- 10.1.6. Other Product Types
- 10.2. Market Analysis, Insights and Forecast - by Distribution Channel
- 10.2.1. Supermarkets/Hypermarkets
- 10.2.2. Convenience Stores
- 10.2.3. Pharmacies/Health Stores
- 10.2.4. Other Distribution Channels
- 10.1. Market Analysis, Insights and Forecast - by Product Type
- 11. North America Probiotic Drinks Industry Analysis, Insights and Forecast, 2019-2031
- 11.1. Market Analysis, Insights and Forecast - By Country/Sub-region
- 11.1.1 United States
- 11.1.2 Canada
- 11.1.3 Mexico
- 11.1.4 Rest of North America
- 12. Europe Probiotic Drinks Industry Analysis, Insights and Forecast, 2019-2031
- 12.1. Market Analysis, Insights and Forecast - By Country/Sub-region
- 12.1.1 United Kingdom
- 12.1.2 France
- 12.1.3 Germany
- 12.1.4 Italy
- 12.1.5 Spain
- 12.1.6 Russia
- 12.1.7 Rest of Europe
- 13. Asia Pacific Probiotic Drinks Industry Analysis, Insights and Forecast, 2019-2031
- 13.1. Market Analysis, Insights and Forecast - By Country/Sub-region
- 13.1.1 China
- 13.1.2 Japan
- 13.1.3 Australia
- 13.1.4 India
- 13.1.5 Rest of Asia Pacific
- 14. South America Probiotic Drinks Industry Analysis, Insights and Forecast, 2019-2031
- 14.1. Market Analysis, Insights and Forecast - By Country/Sub-region
- 14.1.1 Brazil
- 14.1.2 Argentina
- 14.1.3 Rest of South America
- 15. Middle East and Africa Probiotic Drinks Industry Analysis, Insights and Forecast, 2019-2031
- 15.1. Market Analysis, Insights and Forecast - By Country/Sub-region
- 15.1.1 South Africa
- 15.1.2 United Arab Emirates
- 15.1.3 Rest of Middle East and Africa
- 16. Competitive Analysis
- 16.1. Global Market Share Analysis 2024
- 16.2. Company Profiles
- 16.2.1 Lala Branded Products LLC
- 16.2.1.1. Overview
- 16.2.1.2. Products
- 16.2.1.3. SWOT Analysis
- 16.2.1.4. Recent Developments
- 16.2.1.5. Financials (Based on Availability)
- 16.2.2 PepsiCo Inc
- 16.2.2.1. Overview
- 16.2.2.2. Products
- 16.2.2.3. SWOT Analysis
- 16.2.2.4. Recent Developments
- 16.2.2.5. Financials (Based on Availability)
- 16.2.3 Yakult Honsha Co Ltd
- 16.2.3.1. Overview
- 16.2.3.2. Products
- 16.2.3.3. SWOT Analysis
- 16.2.3.4. Recent Developments
- 16.2.3.5. Financials (Based on Availability)
- 16.2.4 Harmless Harvest Inc
- 16.2.4.1. Overview
- 16.2.4.2. Products
- 16.2.4.3. SWOT Analysis
- 16.2.4.4. Recent Developments
- 16.2.4.5. Financials (Based on Availability)
- 16.2.5 Groupe Danone SA
- 16.2.5.1. Overview
- 16.2.5.2. Products
- 16.2.5.3. SWOT Analysis
- 16.2.5.4. Recent Developments
- 16.2.5.5. Financials (Based on Availability)
- 16.2.6 Lifeway Foods Inc
- 16.2.6.1. Overview
- 16.2.6.2. Products
- 16.2.6.3. SWOT Analysis
- 16.2.6.4. Recent Developments
- 16.2.6.5. Financials (Based on Availability)
- 16.2.7 Kerry Group PLC (Bio-K Plus International Inc )
- 16.2.7.1. Overview
- 16.2.7.2. Products
- 16.2.7.3. SWOT Analysis
- 16.2.7.4. Recent Developments
- 16.2.7.5. Financials (Based on Availability)
- 16.2.8 Obi Probiotic Soda*List Not Exhaustive
- 16.2.8.1. Overview
- 16.2.8.2. Products
- 16.2.8.3. SWOT Analysis
- 16.2.8.4. Recent Developments
- 16.2.8.5. Financials (Based on Availability)
- 16.2.9 Fonterra Co-op Group Ltd
- 16.2.9.1. Overview
- 16.2.9.2. Products
- 16.2.9.3. SWOT Analysis
- 16.2.9.4. Recent Developments
- 16.2.9.5. Financials (Based on Availability)
- 16.2.10 Groupe Lactalis
- 16.2.10.1. Overview
- 16.2.10.2. Products
- 16.2.10.3. SWOT Analysis
- 16.2.10.4. Recent Developments
- 16.2.10.5. Financials (Based on Availability)
- 16.2.1 Lala Branded Products LLC
List of Figures
- Figure 1: Global Probiotic Drinks Industry Revenue Breakdown (Million, %) by Region 2024 & 2032
- Figure 2: Global Probiotic Drinks Industry Volume Breakdown (K Units, %) by Region 2024 & 2032
- Figure 3: North America Probiotic Drinks Industry Revenue (Million), by Country 2024 & 2032
- Figure 4: North America Probiotic Drinks Industry Volume (K Units), by Country 2024 & 2032
- Figure 5: North America Probiotic Drinks Industry Revenue Share (%), by Country 2024 & 2032
- Figure 6: North America Probiotic Drinks Industry Volume Share (%), by Country 2024 & 2032
- Figure 7: Europe Probiotic Drinks Industry Revenue (Million), by Country 2024 & 2032
- Figure 8: Europe Probiotic Drinks Industry Volume (K Units), by Country 2024 & 2032
- Figure 9: Europe Probiotic Drinks Industry Revenue Share (%), by Country 2024 & 2032
- Figure 10: Europe Probiotic Drinks Industry Volume Share (%), by Country 2024 & 2032
- Figure 11: Asia Pacific Probiotic Drinks Industry Revenue (Million), by Country 2024 & 2032
- Figure 12: Asia Pacific Probiotic Drinks Industry Volume (K Units), by Country 2024 & 2032
- Figure 13: Asia Pacific Probiotic Drinks Industry Revenue Share (%), by Country 2024 & 2032
- Figure 14: Asia Pacific Probiotic Drinks Industry Volume Share (%), by Country 2024 & 2032
- Figure 15: South America Probiotic Drinks Industry Revenue (Million), by Country 2024 & 2032
- Figure 16: South America Probiotic Drinks Industry Volume (K Units), by Country 2024 & 2032
- Figure 17: South America Probiotic Drinks Industry Revenue Share (%), by Country 2024 & 2032
- Figure 18: South America Probiotic Drinks Industry Volume Share (%), by Country 2024 & 2032
- Figure 19: Middle East and Africa Probiotic Drinks Industry Revenue (Million), by Country 2024 & 2032
- Figure 20: Middle East and Africa Probiotic Drinks Industry Volume (K Units), by Country 2024 & 2032
- Figure 21: Middle East and Africa Probiotic Drinks Industry Revenue Share (%), by Country 2024 & 2032
- Figure 22: Middle East and Africa Probiotic Drinks Industry Volume Share (%), by Country 2024 & 2032
- Figure 23: North America Probiotic Drinks Industry Revenue (Million), by Product Type 2024 & 2032
- Figure 24: North America Probiotic Drinks Industry Volume (K Units), by Product Type 2024 & 2032
- Figure 25: North America Probiotic Drinks Industry Revenue Share (%), by Product Type 2024 & 2032
- Figure 26: North America Probiotic Drinks Industry Volume Share (%), by Product Type 2024 & 2032
- Figure 27: North America Probiotic Drinks Industry Revenue (Million), by Distribution Channel 2024 & 2032
- Figure 28: North America Probiotic Drinks Industry Volume (K Units), by Distribution Channel 2024 & 2032
- Figure 29: North America Probiotic Drinks Industry Revenue Share (%), by Distribution Channel 2024 & 2032
- Figure 30: North America Probiotic Drinks Industry Volume Share (%), by Distribution Channel 2024 & 2032
- Figure 31: North America Probiotic Drinks Industry Revenue (Million), by Country 2024 & 2032
- Figure 32: North America Probiotic Drinks Industry Volume (K Units), by Country 2024 & 2032
- Figure 33: North America Probiotic Drinks Industry Revenue Share (%), by Country 2024 & 2032
- Figure 34: North America Probiotic Drinks Industry Volume Share (%), by Country 2024 & 2032
- Figure 35: Europe Probiotic Drinks Industry Revenue (Million), by Product Type 2024 & 2032
- Figure 36: Europe Probiotic Drinks Industry Volume (K Units), by Product Type 2024 & 2032
- Figure 37: Europe Probiotic Drinks Industry Revenue Share (%), by Product Type 2024 & 2032
- Figure 38: Europe Probiotic Drinks Industry Volume Share (%), by Product Type 2024 & 2032
- Figure 39: Europe Probiotic Drinks Industry Revenue (Million), by Distribution Channel 2024 & 2032
- Figure 40: Europe Probiotic Drinks Industry Volume (K Units), by Distribution Channel 2024 & 2032
- Figure 41: Europe Probiotic Drinks Industry Revenue Share (%), by Distribution Channel 2024 & 2032
- Figure 42: Europe Probiotic Drinks Industry Volume Share (%), by Distribution Channel 2024 & 2032
- Figure 43: Europe Probiotic Drinks Industry Revenue (Million), by Country 2024 & 2032
- Figure 44: Europe Probiotic Drinks Industry Volume (K Units), by Country 2024 & 2032
- Figure 45: Europe Probiotic Drinks Industry Revenue Share (%), by Country 2024 & 2032
- Figure 46: Europe Probiotic Drinks Industry Volume Share (%), by Country 2024 & 2032
- Figure 47: Asia Pacific Probiotic Drinks Industry Revenue (Million), by Product Type 2024 & 2032
- Figure 48: Asia Pacific Probiotic Drinks Industry Volume (K Units), by Product Type 2024 & 2032
- Figure 49: Asia Pacific Probiotic Drinks Industry Revenue Share (%), by Product Type 2024 & 2032
- Figure 50: Asia Pacific Probiotic Drinks Industry Volume Share (%), by Product Type 2024 & 2032
- Figure 51: Asia Pacific Probiotic Drinks Industry Revenue (Million), by Distribution Channel 2024 & 2032
- Figure 52: Asia Pacific Probiotic Drinks Industry Volume (K Units), by Distribution Channel 2024 & 2032
- Figure 53: Asia Pacific Probiotic Drinks Industry Revenue Share (%), by Distribution Channel 2024 & 2032
- Figure 54: Asia Pacific Probiotic Drinks Industry Volume Share (%), by Distribution Channel 2024 & 2032
- Figure 55: Asia Pacific Probiotic Drinks Industry Revenue (Million), by Country 2024 & 2032
- Figure 56: Asia Pacific Probiotic Drinks Industry Volume (K Units), by Country 2024 & 2032
- Figure 57: Asia Pacific Probiotic Drinks Industry Revenue Share (%), by Country 2024 & 2032
- Figure 58: Asia Pacific Probiotic Drinks Industry Volume Share (%), by Country 2024 & 2032
- Figure 59: South America Probiotic Drinks Industry Revenue (Million), by Product Type 2024 & 2032
- Figure 60: South America Probiotic Drinks Industry Volume (K Units), by Product Type 2024 & 2032
- Figure 61: South America Probiotic Drinks Industry Revenue Share (%), by Product Type 2024 & 2032
- Figure 62: South America Probiotic Drinks Industry Volume Share (%), by Product Type 2024 & 2032
- Figure 63: South America Probiotic Drinks Industry Revenue (Million), by Distribution Channel 2024 & 2032
- Figure 64: South America Probiotic Drinks Industry Volume (K Units), by Distribution Channel 2024 & 2032
- Figure 65: South America Probiotic Drinks Industry Revenue Share (%), by Distribution Channel 2024 & 2032
- Figure 66: South America Probiotic Drinks Industry Volume Share (%), by Distribution Channel 2024 & 2032
- Figure 67: South America Probiotic Drinks Industry Revenue (Million), by Country 2024 & 2032
- Figure 68: South America Probiotic Drinks Industry Volume (K Units), by Country 2024 & 2032
- Figure 69: South America Probiotic Drinks Industry Revenue Share (%), by Country 2024 & 2032
- Figure 70: South America Probiotic Drinks Industry Volume Share (%), by Country 2024 & 2032
- Figure 71: Middle East and Africa Probiotic Drinks Industry Revenue (Million), by Product Type 2024 & 2032
- Figure 72: Middle East and Africa Probiotic Drinks Industry Volume (K Units), by Product Type 2024 & 2032
- Figure 73: Middle East and Africa Probiotic Drinks Industry Revenue Share (%), by Product Type 2024 & 2032
- Figure 74: Middle East and Africa Probiotic Drinks Industry Volume Share (%), by Product Type 2024 & 2032
- Figure 75: Middle East and Africa Probiotic Drinks Industry Revenue (Million), by Distribution Channel 2024 & 2032
- Figure 76: Middle East and Africa Probiotic Drinks Industry Volume (K Units), by Distribution Channel 2024 & 2032
- Figure 77: Middle East and Africa Probiotic Drinks Industry Revenue Share (%), by Distribution Channel 2024 & 2032
- Figure 78: Middle East and Africa Probiotic Drinks Industry Volume Share (%), by Distribution Channel 2024 & 2032
- Figure 79: Middle East and Africa Probiotic Drinks Industry Revenue (Million), by Country 2024 & 2032
- Figure 80: Middle East and Africa Probiotic Drinks Industry Volume (K Units), by Country 2024 & 2032
- Figure 81: Middle East and Africa Probiotic Drinks Industry Revenue Share (%), by Country 2024 & 2032
- Figure 82: Middle East and Africa Probiotic Drinks Industry Volume Share (%), by Country 2024 & 2032
List of Tables
- Table 1: Global Probiotic Drinks Industry Revenue Million Forecast, by Region 2019 & 2032
- Table 2: Global Probiotic Drinks Industry Volume K Units Forecast, by Region 2019 & 2032
- Table 3: Global Probiotic Drinks Industry Revenue Million Forecast, by Product Type 2019 & 2032
- Table 4: Global Probiotic Drinks Industry Volume K Units Forecast, by Product Type 2019 & 2032
- Table 5: Global Probiotic Drinks Industry Revenue Million Forecast, by Distribution Channel 2019 & 2032
- Table 6: Global Probiotic Drinks Industry Volume K Units Forecast, by Distribution Channel 2019 & 2032
- Table 7: Global Probiotic Drinks Industry Revenue Million Forecast, by Region 2019 & 2032
- Table 8: Global Probiotic Drinks Industry Volume K Units Forecast, by Region 2019 & 2032
- Table 9: Global Probiotic Drinks Industry Revenue Million Forecast, by Country 2019 & 2032
- Table 10: Global Probiotic Drinks Industry Volume K Units Forecast, by Country 2019 & 2032
- Table 11: United States Probiotic Drinks Industry Revenue (Million) Forecast, by Application 2019 & 2032
- Table 12: United States Probiotic Drinks Industry Volume (K Units) Forecast, by Application 2019 & 2032
- Table 13: Canada Probiotic Drinks Industry Revenue (Million) Forecast, by Application 2019 & 2032
- Table 14: Canada Probiotic Drinks Industry Volume (K Units) Forecast, by Application 2019 & 2032
- Table 15: Mexico Probiotic Drinks Industry Revenue (Million) Forecast, by Application 2019 & 2032
- Table 16: Mexico Probiotic Drinks Industry Volume (K Units) Forecast, by Application 2019 & 2032
- Table 17: Rest of North America Probiotic Drinks Industry Revenue (Million) Forecast, by Application 2019 & 2032
- Table 18: Rest of North America Probiotic Drinks Industry Volume (K Units) Forecast, by Application 2019 & 2032
- Table 19: Global Probiotic Drinks Industry Revenue Million Forecast, by Country 2019 & 2032
- Table 20: Global Probiotic Drinks Industry Volume K Units Forecast, by Country 2019 & 2032
- Table 21: United Kingdom Probiotic Drinks Industry Revenue (Million) Forecast, by Application 2019 & 2032
- Table 22: United Kingdom Probiotic Drinks Industry Volume (K Units) Forecast, by Application 2019 & 2032
- Table 23: France Probiotic Drinks Industry Revenue (Million) Forecast, by Application 2019 & 2032
- Table 24: France Probiotic Drinks Industry Volume (K Units) Forecast, by Application 2019 & 2032
- Table 25: Germany Probiotic Drinks Industry Revenue (Million) Forecast, by Application 2019 & 2032
- Table 26: Germany Probiotic Drinks Industry Volume (K Units) Forecast, by Application 2019 & 2032
- Table 27: Italy Probiotic Drinks Industry Revenue (Million) Forecast, by Application 2019 & 2032
- Table 28: Italy Probiotic Drinks Industry Volume (K Units) Forecast, by Application 2019 & 2032
- Table 29: Spain Probiotic Drinks Industry Revenue (Million) Forecast, by Application 2019 & 2032
- Table 30: Spain Probiotic Drinks Industry Volume (K Units) Forecast, by Application 2019 & 2032
- Table 31: Russia Probiotic Drinks Industry Revenue (Million) Forecast, by Application 2019 & 2032
- Table 32: Russia Probiotic Drinks Industry Volume (K Units) Forecast, by Application 2019 & 2032
- Table 33: Rest of Europe Probiotic Drinks Industry Revenue (Million) Forecast, by Application 2019 & 2032
- Table 34: Rest of Europe Probiotic Drinks Industry Volume (K Units) Forecast, by Application 2019 & 2032
- Table 35: Global Probiotic Drinks Industry Revenue Million Forecast, by Country 2019 & 2032
- Table 36: Global Probiotic Drinks Industry Volume K Units Forecast, by Country 2019 & 2032
- Table 37: China Probiotic Drinks Industry Revenue (Million) Forecast, by Application 2019 & 2032
- Table 38: China Probiotic Drinks Industry Volume (K Units) Forecast, by Application 2019 & 2032
- Table 39: Japan Probiotic Drinks Industry Revenue (Million) Forecast, by Application 2019 & 2032
- Table 40: Japan Probiotic Drinks Industry Volume (K Units) Forecast, by Application 2019 & 2032
- Table 41: Australia Probiotic Drinks Industry Revenue (Million) Forecast, by Application 2019 & 2032
- Table 42: Australia Probiotic Drinks Industry Volume (K Units) Forecast, by Application 2019 & 2032
- Table 43: India Probiotic Drinks Industry Revenue (Million) Forecast, by Application 2019 & 2032
- Table 44: India Probiotic Drinks Industry Volume (K Units) Forecast, by Application 2019 & 2032
- Table 45: Rest of Asia Pacific Probiotic Drinks Industry Revenue (Million) Forecast, by Application 2019 & 2032
- Table 46: Rest of Asia Pacific Probiotic Drinks Industry Volume (K Units) Forecast, by Application 2019 & 2032
- Table 47: Global Probiotic Drinks Industry Revenue Million Forecast, by Country 2019 & 2032
- Table 48: Global Probiotic Drinks Industry Volume K Units Forecast, by Country 2019 & 2032
- Table 49: Brazil Probiotic Drinks Industry Revenue (Million) Forecast, by Application 2019 & 2032
- Table 50: Brazil Probiotic Drinks Industry Volume (K Units) Forecast, by Application 2019 & 2032
- Table 51: Argentina Probiotic Drinks Industry Revenue (Million) Forecast, by Application 2019 & 2032
- Table 52: Argentina Probiotic Drinks Industry Volume (K Units) Forecast, by Application 2019 & 2032
- Table 53: Rest of South America Probiotic Drinks Industry Revenue (Million) Forecast, by Application 2019 & 2032
- Table 54: Rest of South America Probiotic Drinks Industry Volume (K Units) Forecast, by Application 2019 & 2032
- Table 55: Global Probiotic Drinks Industry Revenue Million Forecast, by Country 2019 & 2032
- Table 56: Global Probiotic Drinks Industry Volume K Units Forecast, by Country 2019 & 2032
- Table 57: South Africa Probiotic Drinks Industry Revenue (Million) Forecast, by Application 2019 & 2032
- Table 58: South Africa Probiotic Drinks Industry Volume (K Units) Forecast, by Application 2019 & 2032
- Table 59: United Arab Emirates Probiotic Drinks Industry Revenue (Million) Forecast, by Application 2019 & 2032
- Table 60: United Arab Emirates Probiotic Drinks Industry Volume (K Units) Forecast, by Application 2019 & 2032
- Table 61: Rest of Middle East and Africa Probiotic Drinks Industry Revenue (Million) Forecast, by Application 2019 & 2032
- Table 62: Rest of Middle East and Africa Probiotic Drinks Industry Volume (K Units) Forecast, by Application 2019 & 2032
- Table 63: Global Probiotic Drinks Industry Revenue Million Forecast, by Product Type 2019 & 2032
- Table 64: Global Probiotic Drinks Industry Volume K Units Forecast, by Product Type 2019 & 2032
- Table 65: Global Probiotic Drinks Industry Revenue Million Forecast, by Distribution Channel 2019 & 2032
- Table 66: Global Probiotic Drinks Industry Volume K Units Forecast, by Distribution Channel 2019 & 2032
- Table 67: Global Probiotic Drinks Industry Revenue Million Forecast, by Country 2019 & 2032
- Table 68: Global Probiotic Drinks Industry Volume K Units Forecast, by Country 2019 & 2032
- Table 69: United States Probiotic Drinks Industry Revenue (Million) Forecast, by Application 2019 & 2032
- Table 70: United States Probiotic Drinks Industry Volume (K Units) Forecast, by Application 2019 & 2032
- Table 71: Canada Probiotic Drinks Industry Revenue (Million) Forecast, by Application 2019 & 2032
- Table 72: Canada Probiotic Drinks Industry Volume (K Units) Forecast, by Application 2019 & 2032
- Table 73: Mexico Probiotic Drinks Industry Revenue (Million) Forecast, by Application 2019 & 2032
- Table 74: Mexico Probiotic Drinks Industry Volume (K Units) Forecast, by Application 2019 & 2032
- Table 75: Rest of North America Probiotic Drinks Industry Revenue (Million) Forecast, by Application 2019 & 2032
- Table 76: Rest of North America Probiotic Drinks Industry Volume (K Units) Forecast, by Application 2019 & 2032
- Table 77: Global Probiotic Drinks Industry Revenue Million Forecast, by Product Type 2019 & 2032
- Table 78: Global Probiotic Drinks Industry Volume K Units Forecast, by Product Type 2019 & 2032
- Table 79: Global Probiotic Drinks Industry Revenue Million Forecast, by Distribution Channel 2019 & 2032
- Table 80: Global Probiotic Drinks Industry Volume K Units Forecast, by Distribution Channel 2019 & 2032
- Table 81: Global Probiotic Drinks Industry Revenue Million Forecast, by Country 2019 & 2032
- Table 82: Global Probiotic Drinks Industry Volume K Units Forecast, by Country 2019 & 2032
- Table 83: United Kingdom Probiotic Drinks Industry Revenue (Million) Forecast, by Application 2019 & 2032
- Table 84: United Kingdom Probiotic Drinks Industry Volume (K Units) Forecast, by Application 2019 & 2032
- Table 85: France Probiotic Drinks Industry Revenue (Million) Forecast, by Application 2019 & 2032
- Table 86: France Probiotic Drinks Industry Volume (K Units) Forecast, by Application 2019 & 2032
- Table 87: Germany Probiotic Drinks Industry Revenue (Million) Forecast, by Application 2019 & 2032
- Table 88: Germany Probiotic Drinks Industry Volume (K Units) Forecast, by Application 2019 & 2032
- Table 89: Italy Probiotic Drinks Industry Revenue (Million) Forecast, by Application 2019 & 2032
- Table 90: Italy Probiotic Drinks Industry Volume (K Units) Forecast, by Application 2019 & 2032
- Table 91: Spain Probiotic Drinks Industry Revenue (Million) Forecast, by Application 2019 & 2032
- Table 92: Spain Probiotic Drinks Industry Volume (K Units) Forecast, by Application 2019 & 2032
- Table 93: Russia Probiotic Drinks Industry Revenue (Million) Forecast, by Application 2019 & 2032
- Table 94: Russia Probiotic Drinks Industry Volume (K Units) Forecast, by Application 2019 & 2032
- Table 95: Rest of Europe Probiotic Drinks Industry Revenue (Million) Forecast, by Application 2019 & 2032
- Table 96: Rest of Europe Probiotic Drinks Industry Volume (K Units) Forecast, by Application 2019 & 2032
- Table 97: Global Probiotic Drinks Industry Revenue Million Forecast, by Product Type 2019 & 2032
- Table 98: Global Probiotic Drinks Industry Volume K Units Forecast, by Product Type 2019 & 2032
- Table 99: Global Probiotic Drinks Industry Revenue Million Forecast, by Distribution Channel 2019 & 2032
- Table 100: Global Probiotic Drinks Industry Volume K Units Forecast, by Distribution Channel 2019 & 2032
- Table 101: Global Probiotic Drinks Industry Revenue Million Forecast, by Country 2019 & 2032
- Table 102: Global Probiotic Drinks Industry Volume K Units Forecast, by Country 2019 & 2032
- Table 103: China Probiotic Drinks Industry Revenue (Million) Forecast, by Application 2019 & 2032
- Table 104: China Probiotic Drinks Industry Volume (K Units) Forecast, by Application 2019 & 2032
- Table 105: Japan Probiotic Drinks Industry Revenue (Million) Forecast, by Application 2019 & 2032
- Table 106: Japan Probiotic Drinks Industry Volume (K Units) Forecast, by Application 2019 & 2032
- Table 107: Australia Probiotic Drinks Industry Revenue (Million) Forecast, by Application 2019 & 2032
- Table 108: Australia Probiotic Drinks Industry Volume (K Units) Forecast, by Application 2019 & 2032
- Table 109: India Probiotic Drinks Industry Revenue (Million) Forecast, by Application 2019 & 2032
- Table 110: India Probiotic Drinks Industry Volume (K Units) Forecast, by Application 2019 & 2032
- Table 111: Rest of Asia Pacific Probiotic Drinks Industry Revenue (Million) Forecast, by Application 2019 & 2032
- Table 112: Rest of Asia Pacific Probiotic Drinks Industry Volume (K Units) Forecast, by Application 2019 & 2032
- Table 113: Global Probiotic Drinks Industry Revenue Million Forecast, by Product Type 2019 & 2032
- Table 114: Global Probiotic Drinks Industry Volume K Units Forecast, by Product Type 2019 & 2032
- Table 115: Global Probiotic Drinks Industry Revenue Million Forecast, by Distribution Channel 2019 & 2032
- Table 116: Global Probiotic Drinks Industry Volume K Units Forecast, by Distribution Channel 2019 & 2032
- Table 117: Global Probiotic Drinks Industry Revenue Million Forecast, by Country 2019 & 2032
- Table 118: Global Probiotic Drinks Industry Volume K Units Forecast, by Country 2019 & 2032
- Table 119: Brazil Probiotic Drinks Industry Revenue (Million) Forecast, by Application 2019 & 2032
- Table 120: Brazil Probiotic Drinks Industry Volume (K Units) Forecast, by Application 2019 & 2032
- Table 121: Argentina Probiotic Drinks Industry Revenue (Million) Forecast, by Application 2019 & 2032
- Table 122: Argentina Probiotic Drinks Industry Volume (K Units) Forecast, by Application 2019 & 2032
- Table 123: Rest of South America Probiotic Drinks Industry Revenue (Million) Forecast, by Application 2019 & 2032
- Table 124: Rest of South America Probiotic Drinks Industry Volume (K Units) Forecast, by Application 2019 & 2032
- Table 125: Global Probiotic Drinks Industry Revenue Million Forecast, by Product Type 2019 & 2032
- Table 126: Global Probiotic Drinks Industry Volume K Units Forecast, by Product Type 2019 & 2032
- Table 127: Global Probiotic Drinks Industry Revenue Million Forecast, by Distribution Channel 2019 & 2032
- Table 128: Global Probiotic Drinks Industry Volume K Units Forecast, by Distribution Channel 2019 & 2032
- Table 129: Global Probiotic Drinks Industry Revenue Million Forecast, by Country 2019 & 2032
- Table 130: Global Probiotic Drinks Industry Volume K Units Forecast, by Country 2019 & 2032
- Table 131: South Africa Probiotic Drinks Industry Revenue (Million) Forecast, by Application 2019 & 2032
- Table 132: South Africa Probiotic Drinks Industry Volume (K Units) Forecast, by Application 2019 & 2032
- Table 133: United Arab Emirates Probiotic Drinks Industry Revenue (Million) Forecast, by Application 2019 & 2032
- Table 134: United Arab Emirates Probiotic Drinks Industry Volume (K Units) Forecast, by Application 2019 & 2032
- Table 135: Rest of Middle East and Africa Probiotic Drinks Industry Revenue (Million) Forecast, by Application 2019 & 2032
- Table 136: Rest of Middle East and Africa Probiotic Drinks Industry Volume (K Units) Forecast, by Application 2019 & 2032
Frequently Asked Questions
1. What is the projected Compound Annual Growth Rate (CAGR) of the Probiotic Drinks Industry?
The projected CAGR is approximately 9.82%.
2. Which companies are prominent players in the Probiotic Drinks Industry?
Key companies in the market include Lala Branded Products LLC, PepsiCo Inc, Yakult Honsha Co Ltd, Harmless Harvest Inc, Groupe Danone SA, Lifeway Foods Inc, Kerry Group PLC (Bio-K Plus International Inc ), Obi Probiotic Soda*List Not Exhaustive, Fonterra Co-op Group Ltd, Groupe Lactalis.
3. What are the main segments of the Probiotic Drinks Industry?
The market segments include Product Type, Distribution Channel.
4. Can you provide details about the market size?
The market size is estimated to be USD 41.13 Million as of 2022.
5. What are some drivers contributing to market growth?
Increasing Demand for Protein Rich Food and Supplements; Increasing Application of Collagen in Personal Care Products.
6. What are the notable trends driving market growth?
Growing Demand for Functional Beverages.
7. Are there any restraints impacting market growth?
Increasing Demand for Plant-Based Protein.
8. Can you provide examples of recent developments in the market?
June 2022: Danone launched the new drinkable yogurt Activa+. Activa+ is a multi-benefit drinkable yogurt made with active probiotic vitamins A, D, and zinc. The product is available in different flavors like raspberry, peach, and strawberry.
9. What pricing options are available for accessing the report?
Pricing options include single-user, multi-user, and enterprise licenses priced at USD 4750, USD 5250, and USD 8750 respectively.
10. Is the market size provided in terms of value or volume?
The market size is provided in terms of value, measured in Million and volume, measured in K Units.
11. Are there any specific market keywords associated with the report?
Yes, the market keyword associated with the report is "Probiotic Drinks Industry," which aids in identifying and referencing the specific market segment covered.
12. How do I determine which pricing option suits my needs best?
The pricing options vary based on user requirements and access needs. Individual users may opt for single-user licenses, while businesses requiring broader access may choose multi-user or enterprise licenses for cost-effective access to the report.
13. Are there any additional resources or data provided in the Probiotic Drinks Industry report?
While the report offers comprehensive insights, it's advisable to review the specific contents or supplementary materials provided to ascertain if additional resources or data are available.
14. How can I stay updated on further developments or reports in the Probiotic Drinks Industry?
To stay informed about further developments, trends, and reports in the Probiotic Drinks Industry, consider subscribing to industry newsletters, following relevant companies and organizations, or regularly checking reputable industry news sources and publications.
Methodology
Step 1 - Identification of Relevant Samples Size from Population Database


Step 2 - Approaches for Defining Global Market Size (Value, Volume* & Price*)

Note*: In applicable scenarios
Step 3 - Data Sources
Primary Research
- Web Analytics
- Survey Reports
- Research Institute
- Latest Research Reports
- Opinion Leaders
Secondary Research
- Annual Reports
- White Paper
- Latest Press Release
- Industry Association
- Paid Database
- Investor Presentations

Step 4 - Data Triangulation
Involves using different sources of information in order to increase the validity of a study
These sources are likely to be stakeholders in a program - participants, other researchers, program staff, other community members, and so on.
Then we put all data in single framework & apply various statistical tools to find out the dynamic on the market.
During the analysis stage, feedback from the stakeholder groups would be compared to determine areas of agreement as well as areas of divergence


