

Key Insights
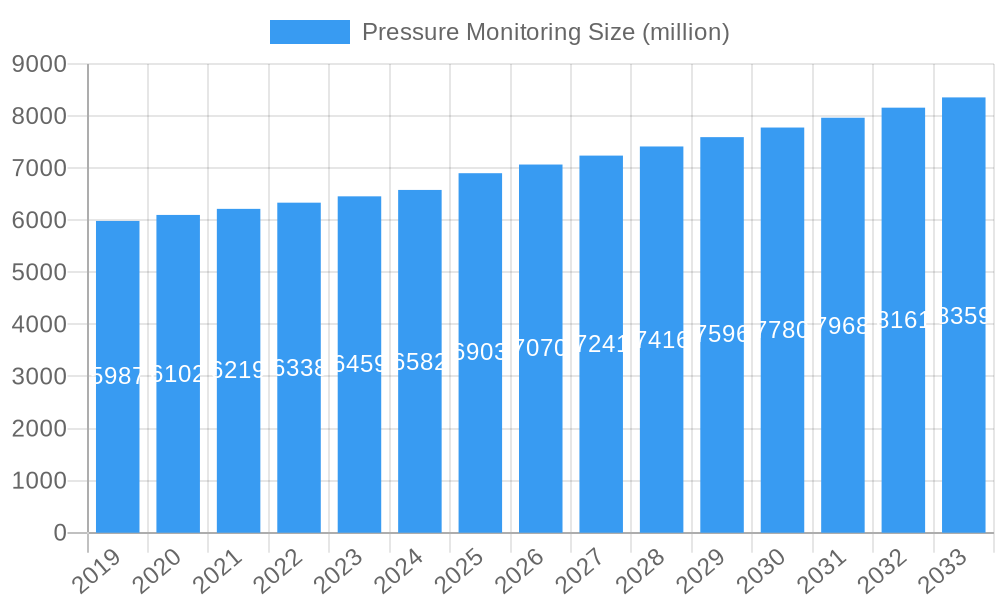
The global Pressure Monitoring market is poised for steady growth, projected to reach approximately $6,903 million by 2025, with a Compound Annual Growth Rate (CAGR) of 2.8% anticipated to extend through 2033. This expansion is primarily fueled by the increasing prevalence of chronic diseases such as hypertension and cardiovascular conditions, necessitating continuous and accurate blood pressure monitoring. The growing aging population worldwide also significantly contributes to market demand, as older individuals are more susceptible to conditions requiring regular pressure assessments. Furthermore, advancements in medical technology, leading to the development of more sophisticated, user-friendly, and portable pressure monitoring devices, are driving market adoption. The integration of these devices with digital health platforms and telehealth services is also a key trend, offering enhanced patient care, remote monitoring capabilities, and improved data management for healthcare professionals.
Pressure Monitoring Market Size (In Billion)
The market's segmentation reveals diverse application areas, with Hospitals and Home Care Settings emerging as the dominant segments due to the continuous need for critical care and convenient patient management, respectively. The increasing preference for home-based healthcare solutions and the rising awareness among patients about proactive health management are accelerating the adoption of BP Monitors/Cardiac Pressure Monitors in domestic environments. Ambulatory Surgical Centers and Clinics also represent a substantial segment, driven by the growing volume of minimally invasive procedures and outpatient care. While the market benefits from these drivers, it also faces certain restraints, including the high cost of advanced monitoring equipment and potential reimbursement challenges in certain regions. However, the ongoing innovation in device accuracy, connectivity, and affordability, coupled with a heightened global focus on preventive healthcare, is expected to outweigh these challenges, ensuring a positive trajectory for the Pressure Monitoring market.
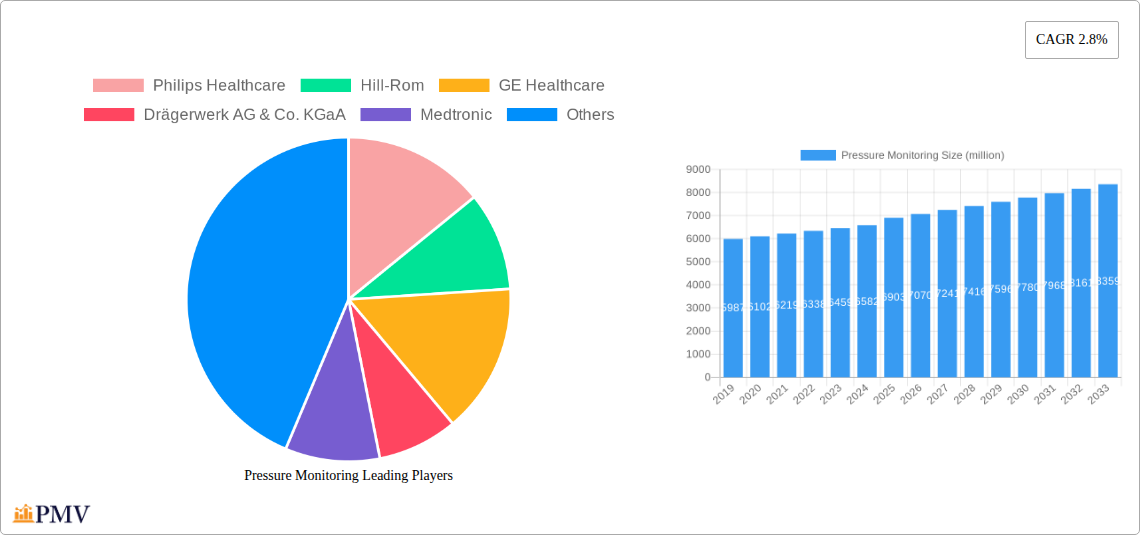
Pressure Monitoring Company Market Share
This in-depth pressure monitoring market report provides a detailed analysis of the global landscape, covering critical segments, industry trends, and competitive dynamics from 2019 to 2033. With a base year of 2025 and a forecast period extending to 2033, this report offers actionable insights for stakeholders seeking to understand and capitalize on the evolving medical device market and healthcare technology sector. The report delves into various pressure monitoring devices, including BP monitors, cardiac pressure monitors, pulmonary pressure monitors, intraocular pressure monitors, and intracranial pressure monitors, catering to applications in hospitals, home care settings, ambulatory surgical centers, clinics, and diagnostic laboratories.
Pressure Monitoring Market Structure & Competitive Dynamics
The global pressure monitoring market exhibits a moderately concentrated structure, with key players like Philips Healthcare, Hill-Rom, GE Healthcare, Drägerwerk AG & Co. KGaA, Medtronic, BD, Nonin Medical Inc., A&D Medical, NIHON KOHDEN CORPORATION, Smiths Medical, Icare Finland Oy, Essilor, NIDEK CO.,LTD., ICU Medical, and Merit Medical holding significant market shares, collectively estimated to be over 70 million of the total market. Innovation ecosystems are robust, driven by continuous research and development in advanced sensor technologies and data analytics. Regulatory frameworks, including FDA approvals and CE marking, play a crucial role in market entry and product validation, impacting product development timelines and investment strategies. Product substitutes, such as non-invasive diagnostic methods, present a degree of competition, particularly in the BP monitor segment. End-user trends favor devices offering greater accuracy, portability, and connectivity. Merger and acquisition (M&A) activities are strategic, aimed at expanding product portfolios, geographical reach, and technological capabilities. Notable M&A deal values have consistently exceeded 500 million in recent years, reflecting the market's consolidation and growth potential.
Pressure Monitoring Industry Trends & Insights
The pressure monitoring industry is poised for substantial growth, projected to expand at a Compound Annual Growth Rate (CAGR) of approximately 6.5% over the forecast period. This robust growth is fueled by several key factors. An aging global population, coupled with the increasing prevalence of chronic diseases such as hypertension, cardiovascular disorders, and neurological conditions, is significantly driving the demand for sophisticated pressure monitoring devices. The rising adoption of remote patient monitoring solutions, enabled by advancements in wireless technology and IoT, is revolutionizing how healthcare providers manage patient conditions outside traditional clinical settings. This trend is particularly evident in home care settings, where patients can continuously track their vital signs and transmit data to their healthcare providers, leading to early intervention and improved patient outcomes.
Technological disruptions are at the forefront of innovation. The integration of artificial intelligence (AI) and machine learning (ML) into pressure monitoring systems allows for predictive analytics, enabling early detection of potential health issues and personalized treatment plans. Miniaturization of sensors and development of wearable pressure monitoring devices are enhancing patient comfort and compliance, making continuous monitoring more feasible and less intrusive. The focus on non-invasive monitoring techniques is also gaining traction, offering a safer and more comfortable experience for patients.
Consumer preferences are shifting towards user-friendly, intuitive devices that provide actionable data. Patients are becoming more proactive in managing their health and are seeking tools that empower them with information about their vital signs. This has led to an increased demand for smart devices with mobile app integration and cloud-based data storage, allowing for easy access and sharing of health information.
Competitive dynamics within the industry are intensifying, with established players investing heavily in R&D and smaller, innovative startups emerging with novel solutions. Strategic partnerships and collaborations between device manufacturers, technology providers, and healthcare institutions are becoming increasingly common to accelerate product development and market penetration. The market penetration of advanced pressure monitoring solutions is expected to reach over 45% by 2033, indicating a significant shift towards digital health and proactive patient management. The estimated market size for pressure monitoring devices is projected to reach 120 million by 2033.
Dominant Markets & Segments in Pressure Monitoring
The pressure monitoring market is experiencing significant dominance in several key regions and segments. North America, particularly the United States, consistently leads the market due to its advanced healthcare infrastructure, high disposable income, and early adoption of new technologies. The region's robust reimbursement policies for medical devices and a strong focus on preventive healthcare further bolster its market position.
Application Dominance:
- Hospitals: This segment remains the largest and most dominant application, driven by the critical need for continuous and accurate pressure monitoring in intensive care units (ICUs), operating rooms, and general wards. The increasing number of complex surgical procedures and the management of critically ill patients necessitate the widespread use of advanced pressure monitoring systems.
- Home Care Settings: This segment is exhibiting the fastest growth rate, propelled by the surge in chronic disease management and the growing preference for remote patient monitoring. Government initiatives promoting telehealth and the increasing availability of user-friendly home-use devices are key drivers.
- Ambulatory Surgical Centers and Clinics: This segment is expanding rapidly as outpatient procedures become more common. The demand for portable and efficient monitoring solutions in these settings is on the rise.
Type Dominance:
- BP Monitors/Cardiac Pressure Monitors: This category constitutes the largest segment by volume and value. The global epidemic of hypertension and cardiovascular diseases ensures a perpetual demand for these devices, both in clinical and home settings. The continuous innovation in cuffless and wearable BP monitoring technologies is further fueling this segment's growth.
- Intraocular Pressure Monitors: Driven by the rising incidence of glaucoma and the increasing awareness of eye health, this segment is experiencing steady growth. Advancements in non-contact tonometry and portable IOP measurement devices are enhancing accessibility.
- Intracranial Pressure Monitors: While a more specialized segment, this is crucial for critical care and neurosurgery. The increasing incidence of traumatic brain injuries and neurological disorders contributes to the demand for these life-saving devices.
Key drivers for dominance in these segments include economic policies that support healthcare spending, robust healthcare infrastructure development, and strong government initiatives promoting digital health solutions. The sheer volume of patients requiring continuous monitoring for conditions like hypertension, cardiac arrhythmias, and post-operative recovery ensures the sustained dominance of BP and cardiac pressure monitors. The increasing focus on proactive health management and the shift towards decentralized healthcare models are significantly contributing to the growth and eventual dominance of home care applications.
Pressure Monitoring Product Innovations
Recent pressure monitoring product innovations have focused on enhanced accuracy, miniaturization, and wireless connectivity. Companies are developing novel sensor technologies for non-invasive blood pressure monitoring, aiming to eliminate the need for traditional cuffs. Wearable devices, such as smartwatches and patches, are integrating sophisticated pressure sensing capabilities for continuous cardiac and respiratory monitoring. AI-powered analytics are being embedded to provide predictive insights into patient conditions, offering significant competitive advantages. The market fit for these innovations is strong, addressing the growing demand for convenient, data-driven, and proactive healthcare solutions.
Report Segmentation & Scope
This report meticulously segments the pressure monitoring market across diverse applications and device types.
Applications: The scope encompasses Hospitals, where critical care and continuous monitoring are paramount; Home Care Settings, driven by the increasing trend of remote patient monitoring and chronic disease management; Ambulatory Surgical Centers and Clinics, reflecting the rise of outpatient procedures; Diagnostic Laboratories, for specific testing needs; and Others, including research institutions and specialized medical facilities. Growth projections indicate significant expansion in home care, with an estimated market size of 30 million by 2033.
Types: The report details the market for BP Monitors/Cardiac Pressure Monitors, representing the largest segment with an estimated market size of 50 million by 2033; Pulmonary Pressure Monitors, crucial for respiratory care; Intraocular Pressure Monitors, addressing eye health needs; Intracranial Pressure Monitors, vital for neurological critical care; and Others, encompassing specialized and emerging pressure monitoring technologies. The competitive dynamics within each type are analyzed to provide a comprehensive market overview.
Key Drivers of Pressure Monitoring Growth
The pressure monitoring sector is experiencing robust growth driven by a confluence of technological, economic, and regulatory factors. Technologically, the advent of AI and IoT in medical devices enables more sophisticated data analysis and remote monitoring capabilities, fostering preventative care. Economically, rising healthcare expenditure globally, particularly in emerging economies, and the increasing prevalence of chronic diseases like hypertension and cardiovascular issues create a substantial demand for diagnostic and monitoring tools. Regulatory bodies, by encouraging the adoption of digital health solutions and setting standards for device efficacy and safety, also play a pivotal role in driving innovation and market expansion. For instance, government incentives for telehealth adoption are directly fueling the growth of home-use pressure monitors.
Challenges in the Pressure Monitoring Sector
Despite its growth trajectory, the pressure monitoring sector faces several challenges. Regulatory hurdles, including stringent approval processes and evolving compliance requirements for new technologies, can impede market entry and increase development costs, estimated to impact product launches by 15%. Supply chain disruptions, exacerbated by global events, can lead to component shortages and production delays, affecting market availability and potentially increasing costs by 10%. Intense competitive pressures among established and emerging players necessitate continuous innovation, putting pressure on profit margins. Furthermore, data security and privacy concerns surrounding connected medical devices require significant investment in cybersecurity measures.
Leading Players in the Pressure Monitoring Market
- Philips Healthcare
- Hill-Rom
- GE Healthcare
- Drägerwerk AG & Co. KGaA
- Medtronic
- BD
- Nonin Medical Inc.
- A&D Medical
- NIHON KOHDEN CORPORATION
- Smiths Medical
- Icare Finland Oy
- Essilor
- NIDEK CO.,LTD.
- ICU Medical
- Merit Medical
Key Developments in Pressure Monitoring Sector
- 2023 February: Philips Healthcare launched its next-generation IntelliVue MX800 patient monitor, featuring advanced pressure monitoring capabilities and enhanced connectivity.
- 2023 April: Medtronic acquired Intersect ENT, strengthening its portfolio in ear, nose, and throat (ENT) medical devices, including those that may impact pressure monitoring applications.
- 2023 June: GE Healthcare introduced a new AI-powered algorithm for its CARESCAPE patient monitors, improving the accuracy and predictive power of pressure measurements.
- 2023 September: Hill-Rom (now Baxter International) announced expanded telehealth solutions, integrating remote pressure monitoring for chronic disease management.
- 2024 January: Drägerwerk AG & Co. KGaA presented innovative pulmonary pressure monitoring systems at a major European medical trade show.
- 2024 March: BD (Becton, Dickinson and Company) unveiled a new integrated system for critical care diagnostics, featuring advanced invasive pressure monitoring.
- 2024 May: Nonin Medical Inc. received FDA clearance for a new non-invasive respiratory pressure monitoring sensor.
- 2024 July: A&D Medical launched a cloud-based platform for home blood pressure monitoring, enhancing data sharing with healthcare providers.
- 2024 October: Smiths Medical introduced a new line of disposable pressure sensors designed for enhanced patient comfort and reduced infection risk.
Strategic Pressure Monitoring Market Outlook
The strategic pressure monitoring market outlook points towards sustained growth driven by innovation in wearable technology and AI-driven analytics. The increasing focus on preventative healthcare and personalized medicine will accelerate the adoption of continuous monitoring solutions in both clinical and home settings. Companies that prioritize the development of user-friendly, connected devices with robust data security will be well-positioned to capture market share. Strategic opportunities lie in expanding into emerging markets with growing healthcare needs and forming partnerships with telehealth providers. The market is expected to continue its upward trajectory, driven by a demand for more integrated and intelligent healthcare solutions, reaching an estimated market size of 120 million by 2033.
Pressure Monitoring Segmentation
-
1. Application
- 1.1. Hospitals
- 1.2. Home Care Settings
- 1.3. Ambulatory Surgical Centers and Clinics
- 1.4. Diagnostic Laboratories
- 1.5. Others
-
2. Types
- 2.1. BP Monitors/Cardiac Pressure Monitors
- 2.2. Pulmonary Pressure Monitors
- 2.3. Intraocular Pressure Monitors
- 2.4. Intracranial Pressure Monitors
- 2.5. Others
Pressure Monitoring Segmentation By Geography
-
1. North America
- 1.1. United States
- 1.2. Canada
- 1.3. Mexico
-
2. South America
- 2.1. Brazil
- 2.2. Argentina
- 2.3. Rest of South America
-
3. Europe
- 3.1. United Kingdom
- 3.2. Germany
- 3.3. France
- 3.4. Italy
- 3.5. Spain
- 3.6. Russia
- 3.7. Benelux
- 3.8. Nordics
- 3.9. Rest of Europe
-
4. Middle East & Africa
- 4.1. Turkey
- 4.2. Israel
- 4.3. GCC
- 4.4. North Africa
- 4.5. South Africa
- 4.6. Rest of Middle East & Africa
-
5. Asia Pacific
- 5.1. China
- 5.2. India
- 5.3. Japan
- 5.4. South Korea
- 5.5. ASEAN
- 5.6. Oceania
- 5.7. Rest of Asia Pacific
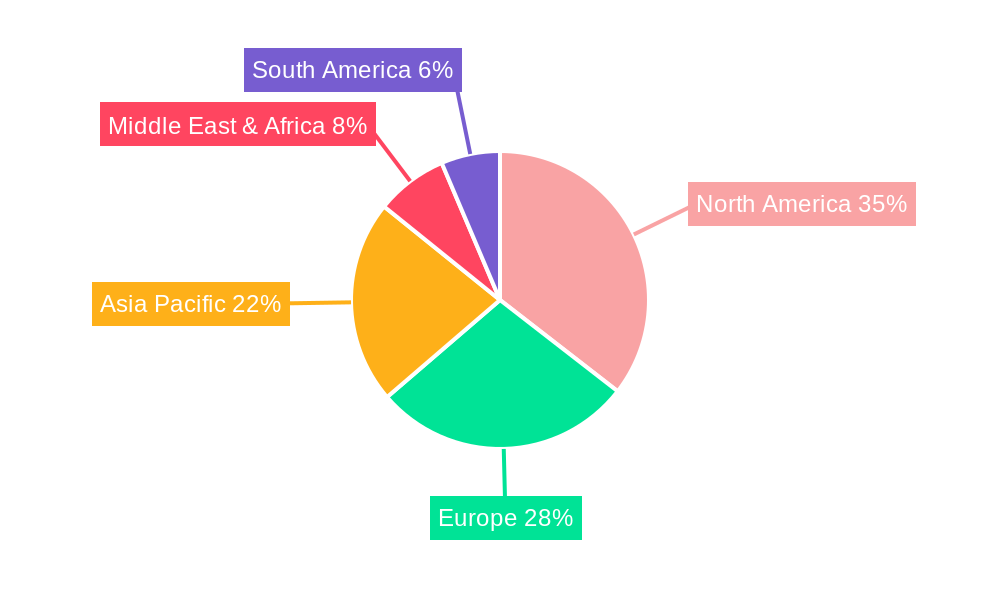
Pressure Monitoring Regional Market Share
Geographic Coverage of Pressure Monitoring
Pressure Monitoring REPORT HIGHLIGHTS
| Aspects | Details |
|---|---|
| Study Period | 2020-2034 |
| Base Year | 2025 |
| Estimated Year | 2026 |
| Forecast Period | 2026-2034 |
| Historical Period | 2020-2025 |
| Growth Rate | CAGR of 2.8% from 2020-2034 |
| Segmentation |
|
Table of Contents
- 1. Introduction
- 1.1. Research Scope
- 1.2. Market Segmentation
- 1.3. Research Objective
- 1.4. Definitions and Assumptions
- 2. Executive Summary
- 2.1. Market Snapshot
- 3. Market Dynamics
- 3.1. Market Drivers
- 3.2. Market Restrains
- 3.3. Market Trends
- 3.4. Market Opportunities
- 4. Market Factor Analysis
- 4.1. Porters Five Forces
- 4.1.1. Bargaining Power of Suppliers
- 4.1.2. Bargaining Power of Buyers
- 4.1.3. Threat of New Entrants
- 4.1.4. Threat of Substitutes
- 4.1.5. Competitive Rivalry
- 4.2. PESTEL analysis
- 4.3. BCG Analysis
- 4.3.1. Stars (High Growth, High Market Share)
- 4.3.2. Cash Cows (Low Growth, High Market Share)
- 4.3.3. Question Mark (High Growth, Low Market Share)
- 4.3.4. Dogs (Low Growth, Low Market Share)
- 4.4. Ansoff Matrix Analysis
- 4.5. Supply Chain Analysis
- 4.6. Regulatory Landscape
- 4.7. Current Market Potential and Opportunity Assessment (TAM–SAM–SOM Framework)
- 4.8. PMV Analyst Note
- 4.1. Porters Five Forces
- 5. Market Analysis, Insights and Forecast 2021-2033
- 5.1. Market Analysis, Insights and Forecast - by Application
- 5.1.1. Hospitals
- 5.1.2. Home Care Settings
- 5.1.3. Ambulatory Surgical Centers and Clinics
- 5.1.4. Diagnostic Laboratories
- 5.1.5. Others
- 5.2. Market Analysis, Insights and Forecast - by Types
- 5.2.1. BP Monitors/Cardiac Pressure Monitors
- 5.2.2. Pulmonary Pressure Monitors
- 5.2.3. Intraocular Pressure Monitors
- 5.2.4. Intracranial Pressure Monitors
- 5.2.5. Others
- 5.3. Market Analysis, Insights and Forecast - by Region
- 5.3.1. North America
- 5.3.2. South America
- 5.3.3. Europe
- 5.3.4. Middle East & Africa
- 5.3.5. Asia Pacific
- 5.1. Market Analysis, Insights and Forecast - by Application
- 6. Global Pressure Monitoring Analysis, Insights and Forecast, 2021-2033
- 6.1. Market Analysis, Insights and Forecast - by Application
- 6.1.1. Hospitals
- 6.1.2. Home Care Settings
- 6.1.3. Ambulatory Surgical Centers and Clinics
- 6.1.4. Diagnostic Laboratories
- 6.1.5. Others
- 6.2. Market Analysis, Insights and Forecast - by Types
- 6.2.1. BP Monitors/Cardiac Pressure Monitors
- 6.2.2. Pulmonary Pressure Monitors
- 6.2.3. Intraocular Pressure Monitors
- 6.2.4. Intracranial Pressure Monitors
- 6.2.5. Others
- 6.1. Market Analysis, Insights and Forecast - by Application
- 7. North America Pressure Monitoring Analysis, Insights and Forecast, 2020-2032
- 7.1. Market Analysis, Insights and Forecast - by Application
- 7.1.1. Hospitals
- 7.1.2. Home Care Settings
- 7.1.3. Ambulatory Surgical Centers and Clinics
- 7.1.4. Diagnostic Laboratories
- 7.1.5. Others
- 7.2. Market Analysis, Insights and Forecast - by Types
- 7.2.1. BP Monitors/Cardiac Pressure Monitors
- 7.2.2. Pulmonary Pressure Monitors
- 7.2.3. Intraocular Pressure Monitors
- 7.2.4. Intracranial Pressure Monitors
- 7.2.5. Others
- 7.1. Market Analysis, Insights and Forecast - by Application
- 8. South America Pressure Monitoring Analysis, Insights and Forecast, 2020-2032
- 8.1. Market Analysis, Insights and Forecast - by Application
- 8.1.1. Hospitals
- 8.1.2. Home Care Settings
- 8.1.3. Ambulatory Surgical Centers and Clinics
- 8.1.4. Diagnostic Laboratories
- 8.1.5. Others
- 8.2. Market Analysis, Insights and Forecast - by Types
- 8.2.1. BP Monitors/Cardiac Pressure Monitors
- 8.2.2. Pulmonary Pressure Monitors
- 8.2.3. Intraocular Pressure Monitors
- 8.2.4. Intracranial Pressure Monitors
- 8.2.5. Others
- 8.1. Market Analysis, Insights and Forecast - by Application
- 9. Europe Pressure Monitoring Analysis, Insights and Forecast, 2020-2032
- 9.1. Market Analysis, Insights and Forecast - by Application
- 9.1.1. Hospitals
- 9.1.2. Home Care Settings
- 9.1.3. Ambulatory Surgical Centers and Clinics
- 9.1.4. Diagnostic Laboratories
- 9.1.5. Others
- 9.2. Market Analysis, Insights and Forecast - by Types
- 9.2.1. BP Monitors/Cardiac Pressure Monitors
- 9.2.2. Pulmonary Pressure Monitors
- 9.2.3. Intraocular Pressure Monitors
- 9.2.4. Intracranial Pressure Monitors
- 9.2.5. Others
- 9.1. Market Analysis, Insights and Forecast - by Application
- 10. Middle East & Africa Pressure Monitoring Analysis, Insights and Forecast, 2020-2032
- 10.1. Market Analysis, Insights and Forecast - by Application
- 10.1.1. Hospitals
- 10.1.2. Home Care Settings
- 10.1.3. Ambulatory Surgical Centers and Clinics
- 10.1.4. Diagnostic Laboratories
- 10.1.5. Others
- 10.2. Market Analysis, Insights and Forecast - by Types
- 10.2.1. BP Monitors/Cardiac Pressure Monitors
- 10.2.2. Pulmonary Pressure Monitors
- 10.2.3. Intraocular Pressure Monitors
- 10.2.4. Intracranial Pressure Monitors
- 10.2.5. Others
- 10.1. Market Analysis, Insights and Forecast - by Application
- 11. Asia Pacific Pressure Monitoring Analysis, Insights and Forecast, 2020-2032
- 11.1. Market Analysis, Insights and Forecast - by Application
- 11.1.1. Hospitals
- 11.1.2. Home Care Settings
- 11.1.3. Ambulatory Surgical Centers and Clinics
- 11.1.4. Diagnostic Laboratories
- 11.1.5. Others
- 11.2. Market Analysis, Insights and Forecast - by Types
- 11.2.1. BP Monitors/Cardiac Pressure Monitors
- 11.2.2. Pulmonary Pressure Monitors
- 11.2.3. Intraocular Pressure Monitors
- 11.2.4. Intracranial Pressure Monitors
- 11.2.5. Others
- 11.1. Market Analysis, Insights and Forecast - by Application
- 12. Competitive Analysis
- 12.1. Company Profiles
- 12.1.1 Philips Healthcare
- 12.1.1.1. Company Overview
- 12.1.1.2. Products
- 12.1.1.3. Company Financials
- 12.1.1.4. SWOT Analysis
- 12.1.2 Hill-Rom
- 12.1.2.1. Company Overview
- 12.1.2.2. Products
- 12.1.2.3. Company Financials
- 12.1.2.4. SWOT Analysis
- 12.1.3 GE Healthcare
- 12.1.3.1. Company Overview
- 12.1.3.2. Products
- 12.1.3.3. Company Financials
- 12.1.3.4. SWOT Analysis
- 12.1.4 Drägerwerk AG & Co. KGaA
- 12.1.4.1. Company Overview
- 12.1.4.2. Products
- 12.1.4.3. Company Financials
- 12.1.4.4. SWOT Analysis
- 12.1.5 Medtronic
- 12.1.5.1. Company Overview
- 12.1.5.2. Products
- 12.1.5.3. Company Financials
- 12.1.5.4. SWOT Analysis
- 12.1.6 BD
- 12.1.6.1. Company Overview
- 12.1.6.2. Products
- 12.1.6.3. Company Financials
- 12.1.6.4. SWOT Analysis
- 12.1.7 Nonin Medical Inc.
- 12.1.7.1. Company Overview
- 12.1.7.2. Products
- 12.1.7.3. Company Financials
- 12.1.7.4. SWOT Analysis
- 12.1.8 A&D Medical
- 12.1.8.1. Company Overview
- 12.1.8.2. Products
- 12.1.8.3. Company Financials
- 12.1.8.4. SWOT Analysis
- 12.1.9 NIHON KOHDEN CORPORATION
- 12.1.9.1. Company Overview
- 12.1.9.2. Products
- 12.1.9.3. Company Financials
- 12.1.9.4. SWOT Analysis
- 12.1.10 Smiths Medical
- 12.1.10.1. Company Overview
- 12.1.10.2. Products
- 12.1.10.3. Company Financials
- 12.1.10.4. SWOT Analysis
- 12.1.11 Icare Finland Oy
- 12.1.11.1. Company Overview
- 12.1.11.2. Products
- 12.1.11.3. Company Financials
- 12.1.11.4. SWOT Analysis
- 12.1.12 Essilor
- 12.1.12.1. Company Overview
- 12.1.12.2. Products
- 12.1.12.3. Company Financials
- 12.1.12.4. SWOT Analysis
- 12.1.13 NIDEK CO.
- 12.1.13.1. Company Overview
- 12.1.13.2. Products
- 12.1.13.3. Company Financials
- 12.1.13.4. SWOT Analysis
- 12.1.14 LTD.
- 12.1.14.1. Company Overview
- 12.1.14.2. Products
- 12.1.14.3. Company Financials
- 12.1.14.4. SWOT Analysis
- 12.1.15 ICU Medical
- 12.1.15.1. Company Overview
- 12.1.15.2. Products
- 12.1.15.3. Company Financials
- 12.1.15.4. SWOT Analysis
- 12.1.16 Merit Medical
- 12.1.16.1. Company Overview
- 12.1.16.2. Products
- 12.1.16.3. Company Financials
- 12.1.16.4. SWOT Analysis
- 12.1.1 Philips Healthcare
- 12.2. Market Entropy
- 12.2.1 Company's Key Areas Served
- 12.2.2 Recent Developments
- 12.3. Company Market Share Analysis 2025
- 12.3.1 Top 5 Companies Market Share Analysis
- 12.3.2 Top 3 Companies Market Share Analysis
- 12.4. List of Potential Customers
- 13. Research Methodology
List of Figures
- Figure 1: Global Pressure Monitoring Revenue Breakdown (million, %) by Region 2025 & 2033
- Figure 2: Global Pressure Monitoring Volume Breakdown (K, %) by Region 2025 & 2033
- Figure 3: North America Pressure Monitoring Revenue (million), by Application 2025 & 2033
- Figure 4: North America Pressure Monitoring Volume (K), by Application 2025 & 2033
- Figure 5: North America Pressure Monitoring Revenue Share (%), by Application 2025 & 2033
- Figure 6: North America Pressure Monitoring Volume Share (%), by Application 2025 & 2033
- Figure 7: North America Pressure Monitoring Revenue (million), by Types 2025 & 2033
- Figure 8: North America Pressure Monitoring Volume (K), by Types 2025 & 2033
- Figure 9: North America Pressure Monitoring Revenue Share (%), by Types 2025 & 2033
- Figure 10: North America Pressure Monitoring Volume Share (%), by Types 2025 & 2033
- Figure 11: North America Pressure Monitoring Revenue (million), by Country 2025 & 2033
- Figure 12: North America Pressure Monitoring Volume (K), by Country 2025 & 2033
- Figure 13: North America Pressure Monitoring Revenue Share (%), by Country 2025 & 2033
- Figure 14: North America Pressure Monitoring Volume Share (%), by Country 2025 & 2033
- Figure 15: South America Pressure Monitoring Revenue (million), by Application 2025 & 2033
- Figure 16: South America Pressure Monitoring Volume (K), by Application 2025 & 2033
- Figure 17: South America Pressure Monitoring Revenue Share (%), by Application 2025 & 2033
- Figure 18: South America Pressure Monitoring Volume Share (%), by Application 2025 & 2033
- Figure 19: South America Pressure Monitoring Revenue (million), by Types 2025 & 2033
- Figure 20: South America Pressure Monitoring Volume (K), by Types 2025 & 2033
- Figure 21: South America Pressure Monitoring Revenue Share (%), by Types 2025 & 2033
- Figure 22: South America Pressure Monitoring Volume Share (%), by Types 2025 & 2033
- Figure 23: South America Pressure Monitoring Revenue (million), by Country 2025 & 2033
- Figure 24: South America Pressure Monitoring Volume (K), by Country 2025 & 2033
- Figure 25: South America Pressure Monitoring Revenue Share (%), by Country 2025 & 2033
- Figure 26: South America Pressure Monitoring Volume Share (%), by Country 2025 & 2033
- Figure 27: Europe Pressure Monitoring Revenue (million), by Application 2025 & 2033
- Figure 28: Europe Pressure Monitoring Volume (K), by Application 2025 & 2033
- Figure 29: Europe Pressure Monitoring Revenue Share (%), by Application 2025 & 2033
- Figure 30: Europe Pressure Monitoring Volume Share (%), by Application 2025 & 2033
- Figure 31: Europe Pressure Monitoring Revenue (million), by Types 2025 & 2033
- Figure 32: Europe Pressure Monitoring Volume (K), by Types 2025 & 2033
- Figure 33: Europe Pressure Monitoring Revenue Share (%), by Types 2025 & 2033
- Figure 34: Europe Pressure Monitoring Volume Share (%), by Types 2025 & 2033
- Figure 35: Europe Pressure Monitoring Revenue (million), by Country 2025 & 2033
- Figure 36: Europe Pressure Monitoring Volume (K), by Country 2025 & 2033
- Figure 37: Europe Pressure Monitoring Revenue Share (%), by Country 2025 & 2033
- Figure 38: Europe Pressure Monitoring Volume Share (%), by Country 2025 & 2033
- Figure 39: Middle East & Africa Pressure Monitoring Revenue (million), by Application 2025 & 2033
- Figure 40: Middle East & Africa Pressure Monitoring Volume (K), by Application 2025 & 2033
- Figure 41: Middle East & Africa Pressure Monitoring Revenue Share (%), by Application 2025 & 2033
- Figure 42: Middle East & Africa Pressure Monitoring Volume Share (%), by Application 2025 & 2033
- Figure 43: Middle East & Africa Pressure Monitoring Revenue (million), by Types 2025 & 2033
- Figure 44: Middle East & Africa Pressure Monitoring Volume (K), by Types 2025 & 2033
- Figure 45: Middle East & Africa Pressure Monitoring Revenue Share (%), by Types 2025 & 2033
- Figure 46: Middle East & Africa Pressure Monitoring Volume Share (%), by Types 2025 & 2033
- Figure 47: Middle East & Africa Pressure Monitoring Revenue (million), by Country 2025 & 2033
- Figure 48: Middle East & Africa Pressure Monitoring Volume (K), by Country 2025 & 2033
- Figure 49: Middle East & Africa Pressure Monitoring Revenue Share (%), by Country 2025 & 2033
- Figure 50: Middle East & Africa Pressure Monitoring Volume Share (%), by Country 2025 & 2033
- Figure 51: Asia Pacific Pressure Monitoring Revenue (million), by Application 2025 & 2033
- Figure 52: Asia Pacific Pressure Monitoring Volume (K), by Application 2025 & 2033
- Figure 53: Asia Pacific Pressure Monitoring Revenue Share (%), by Application 2025 & 2033
- Figure 54: Asia Pacific Pressure Monitoring Volume Share (%), by Application 2025 & 2033
- Figure 55: Asia Pacific Pressure Monitoring Revenue (million), by Types 2025 & 2033
- Figure 56: Asia Pacific Pressure Monitoring Volume (K), by Types 2025 & 2033
- Figure 57: Asia Pacific Pressure Monitoring Revenue Share (%), by Types 2025 & 2033
- Figure 58: Asia Pacific Pressure Monitoring Volume Share (%), by Types 2025 & 2033
- Figure 59: Asia Pacific Pressure Monitoring Revenue (million), by Country 2025 & 2033
- Figure 60: Asia Pacific Pressure Monitoring Volume (K), by Country 2025 & 2033
- Figure 61: Asia Pacific Pressure Monitoring Revenue Share (%), by Country 2025 & 2033
- Figure 62: Asia Pacific Pressure Monitoring Volume Share (%), by Country 2025 & 2033
List of Tables
- Table 1: Global Pressure Monitoring Revenue million Forecast, by Application 2020 & 2033
- Table 2: Global Pressure Monitoring Volume K Forecast, by Application 2020 & 2033
- Table 3: Global Pressure Monitoring Revenue million Forecast, by Types 2020 & 2033
- Table 4: Global Pressure Monitoring Volume K Forecast, by Types 2020 & 2033
- Table 5: Global Pressure Monitoring Revenue million Forecast, by Region 2020 & 2033
- Table 6: Global Pressure Monitoring Volume K Forecast, by Region 2020 & 2033
- Table 7: Global Pressure Monitoring Revenue million Forecast, by Application 2020 & 2033
- Table 8: Global Pressure Monitoring Volume K Forecast, by Application 2020 & 2033
- Table 9: Global Pressure Monitoring Revenue million Forecast, by Types 2020 & 2033
- Table 10: Global Pressure Monitoring Volume K Forecast, by Types 2020 & 2033
- Table 11: Global Pressure Monitoring Revenue million Forecast, by Country 2020 & 2033
- Table 12: Global Pressure Monitoring Volume K Forecast, by Country 2020 & 2033
- Table 13: United States Pressure Monitoring Revenue (million) Forecast, by Application 2020 & 2033
- Table 14: United States Pressure Monitoring Volume (K) Forecast, by Application 2020 & 2033
- Table 15: Canada Pressure Monitoring Revenue (million) Forecast, by Application 2020 & 2033
- Table 16: Canada Pressure Monitoring Volume (K) Forecast, by Application 2020 & 2033
- Table 17: Mexico Pressure Monitoring Revenue (million) Forecast, by Application 2020 & 2033
- Table 18: Mexico Pressure Monitoring Volume (K) Forecast, by Application 2020 & 2033
- Table 19: Global Pressure Monitoring Revenue million Forecast, by Application 2020 & 2033
- Table 20: Global Pressure Monitoring Volume K Forecast, by Application 2020 & 2033
- Table 21: Global Pressure Monitoring Revenue million Forecast, by Types 2020 & 2033
- Table 22: Global Pressure Monitoring Volume K Forecast, by Types 2020 & 2033
- Table 23: Global Pressure Monitoring Revenue million Forecast, by Country 2020 & 2033
- Table 24: Global Pressure Monitoring Volume K Forecast, by Country 2020 & 2033
- Table 25: Brazil Pressure Monitoring Revenue (million) Forecast, by Application 2020 & 2033
- Table 26: Brazil Pressure Monitoring Volume (K) Forecast, by Application 2020 & 2033
- Table 27: Argentina Pressure Monitoring Revenue (million) Forecast, by Application 2020 & 2033
- Table 28: Argentina Pressure Monitoring Volume (K) Forecast, by Application 2020 & 2033
- Table 29: Rest of South America Pressure Monitoring Revenue (million) Forecast, by Application 2020 & 2033
- Table 30: Rest of South America Pressure Monitoring Volume (K) Forecast, by Application 2020 & 2033
- Table 31: Global Pressure Monitoring Revenue million Forecast, by Application 2020 & 2033
- Table 32: Global Pressure Monitoring Volume K Forecast, by Application 2020 & 2033
- Table 33: Global Pressure Monitoring Revenue million Forecast, by Types 2020 & 2033
- Table 34: Global Pressure Monitoring Volume K Forecast, by Types 2020 & 2033
- Table 35: Global Pressure Monitoring Revenue million Forecast, by Country 2020 & 2033
- Table 36: Global Pressure Monitoring Volume K Forecast, by Country 2020 & 2033
- Table 37: United Kingdom Pressure Monitoring Revenue (million) Forecast, by Application 2020 & 2033
- Table 38: United Kingdom Pressure Monitoring Volume (K) Forecast, by Application 2020 & 2033
- Table 39: Germany Pressure Monitoring Revenue (million) Forecast, by Application 2020 & 2033
- Table 40: Germany Pressure Monitoring Volume (K) Forecast, by Application 2020 & 2033
- Table 41: France Pressure Monitoring Revenue (million) Forecast, by Application 2020 & 2033
- Table 42: France Pressure Monitoring Volume (K) Forecast, by Application 2020 & 2033
- Table 43: Italy Pressure Monitoring Revenue (million) Forecast, by Application 2020 & 2033
- Table 44: Italy Pressure Monitoring Volume (K) Forecast, by Application 2020 & 2033
- Table 45: Spain Pressure Monitoring Revenue (million) Forecast, by Application 2020 & 2033
- Table 46: Spain Pressure Monitoring Volume (K) Forecast, by Application 2020 & 2033
- Table 47: Russia Pressure Monitoring Revenue (million) Forecast, by Application 2020 & 2033
- Table 48: Russia Pressure Monitoring Volume (K) Forecast, by Application 2020 & 2033
- Table 49: Benelux Pressure Monitoring Revenue (million) Forecast, by Application 2020 & 2033
- Table 50: Benelux Pressure Monitoring Volume (K) Forecast, by Application 2020 & 2033
- Table 51: Nordics Pressure Monitoring Revenue (million) Forecast, by Application 2020 & 2033
- Table 52: Nordics Pressure Monitoring Volume (K) Forecast, by Application 2020 & 2033
- Table 53: Rest of Europe Pressure Monitoring Revenue (million) Forecast, by Application 2020 & 2033
- Table 54: Rest of Europe Pressure Monitoring Volume (K) Forecast, by Application 2020 & 2033
- Table 55: Global Pressure Monitoring Revenue million Forecast, by Application 2020 & 2033
- Table 56: Global Pressure Monitoring Volume K Forecast, by Application 2020 & 2033
- Table 57: Global Pressure Monitoring Revenue million Forecast, by Types 2020 & 2033
- Table 58: Global Pressure Monitoring Volume K Forecast, by Types 2020 & 2033
- Table 59: Global Pressure Monitoring Revenue million Forecast, by Country 2020 & 2033
- Table 60: Global Pressure Monitoring Volume K Forecast, by Country 2020 & 2033
- Table 61: Turkey Pressure Monitoring Revenue (million) Forecast, by Application 2020 & 2033
- Table 62: Turkey Pressure Monitoring Volume (K) Forecast, by Application 2020 & 2033
- Table 63: Israel Pressure Monitoring Revenue (million) Forecast, by Application 2020 & 2033
- Table 64: Israel Pressure Monitoring Volume (K) Forecast, by Application 2020 & 2033
- Table 65: GCC Pressure Monitoring Revenue (million) Forecast, by Application 2020 & 2033
- Table 66: GCC Pressure Monitoring Volume (K) Forecast, by Application 2020 & 2033
- Table 67: North Africa Pressure Monitoring Revenue (million) Forecast, by Application 2020 & 2033
- Table 68: North Africa Pressure Monitoring Volume (K) Forecast, by Application 2020 & 2033
- Table 69: South Africa Pressure Monitoring Revenue (million) Forecast, by Application 2020 & 2033
- Table 70: South Africa Pressure Monitoring Volume (K) Forecast, by Application 2020 & 2033
- Table 71: Rest of Middle East & Africa Pressure Monitoring Revenue (million) Forecast, by Application 2020 & 2033
- Table 72: Rest of Middle East & Africa Pressure Monitoring Volume (K) Forecast, by Application 2020 & 2033
- Table 73: Global Pressure Monitoring Revenue million Forecast, by Application 2020 & 2033
- Table 74: Global Pressure Monitoring Volume K Forecast, by Application 2020 & 2033
- Table 75: Global Pressure Monitoring Revenue million Forecast, by Types 2020 & 2033
- Table 76: Global Pressure Monitoring Volume K Forecast, by Types 2020 & 2033
- Table 77: Global Pressure Monitoring Revenue million Forecast, by Country 2020 & 2033
- Table 78: Global Pressure Monitoring Volume K Forecast, by Country 2020 & 2033
- Table 79: China Pressure Monitoring Revenue (million) Forecast, by Application 2020 & 2033
- Table 80: China Pressure Monitoring Volume (K) Forecast, by Application 2020 & 2033
- Table 81: India Pressure Monitoring Revenue (million) Forecast, by Application 2020 & 2033
- Table 82: India Pressure Monitoring Volume (K) Forecast, by Application 2020 & 2033
- Table 83: Japan Pressure Monitoring Revenue (million) Forecast, by Application 2020 & 2033
- Table 84: Japan Pressure Monitoring Volume (K) Forecast, by Application 2020 & 2033
- Table 85: South Korea Pressure Monitoring Revenue (million) Forecast, by Application 2020 & 2033
- Table 86: South Korea Pressure Monitoring Volume (K) Forecast, by Application 2020 & 2033
- Table 87: ASEAN Pressure Monitoring Revenue (million) Forecast, by Application 2020 & 2033
- Table 88: ASEAN Pressure Monitoring Volume (K) Forecast, by Application 2020 & 2033
- Table 89: Oceania Pressure Monitoring Revenue (million) Forecast, by Application 2020 & 2033
- Table 90: Oceania Pressure Monitoring Volume (K) Forecast, by Application 2020 & 2033
- Table 91: Rest of Asia Pacific Pressure Monitoring Revenue (million) Forecast, by Application 2020 & 2033
- Table 92: Rest of Asia Pacific Pressure Monitoring Volume (K) Forecast, by Application 2020 & 2033
Frequently Asked Questions
1. What is the projected Compound Annual Growth Rate (CAGR) of the Pressure Monitoring?
The projected CAGR is approximately 2.8%.
2. Which companies are prominent players in the Pressure Monitoring?
Key companies in the market include Philips Healthcare, Hill-Rom, GE Healthcare, Drägerwerk AG & Co. KGaA, Medtronic, BD, Nonin Medical Inc., A&D Medical, NIHON KOHDEN CORPORATION, Smiths Medical, Icare Finland Oy, Essilor, NIDEK CO., LTD., ICU Medical, Merit Medical.
3. What are the main segments of the Pressure Monitoring?
The market segments include Application, Types.
4. Can you provide details about the market size?
The market size is estimated to be USD 6903 million as of 2022.
5. What are some drivers contributing to market growth?
N/A
6. What are the notable trends driving market growth?
N/A
7. Are there any restraints impacting market growth?
N/A
8. Can you provide examples of recent developments in the market?
N/A
9. What pricing options are available for accessing the report?
Pricing options include single-user, multi-user, and enterprise licenses priced at USD 3950.00, USD 5925.00, and USD 7900.00 respectively.
10. Is the market size provided in terms of value or volume?
The market size is provided in terms of value, measured in million and volume, measured in K.
11. Are there any specific market keywords associated with the report?
Yes, the market keyword associated with the report is "Pressure Monitoring," which aids in identifying and referencing the specific market segment covered.
12. How do I determine which pricing option suits my needs best?
The pricing options vary based on user requirements and access needs. Individual users may opt for single-user licenses, while businesses requiring broader access may choose multi-user or enterprise licenses for cost-effective access to the report.
13. Are there any additional resources or data provided in the Pressure Monitoring report?
While the report offers comprehensive insights, it's advisable to review the specific contents or supplementary materials provided to ascertain if additional resources or data are available.
14. How can I stay updated on further developments or reports in the Pressure Monitoring?
To stay informed about further developments, trends, and reports in the Pressure Monitoring, consider subscribing to industry newsletters, following relevant companies and organizations, or regularly checking reputable industry news sources and publications.
Methodology
Step 1 - Identification of Relevant Samples Size from Population Database


Step 2 - Approaches for Defining Global Market Size (Value, Volume* & Price*)

Note*: In applicable scenarios
Step 3 - Data Sources
Primary Research
- Web Analytics
- Survey Reports
- Research Institute
- Latest Research Reports
- Opinion Leaders
Secondary Research
- Annual Reports
- White Paper
- Latest Press Release
- Industry Association
- Paid Database
- Investor Presentations

Step 4 - Data Triangulation
Involves using different sources of information in order to increase the validity of a study
These sources are likely to be stakeholders in a program - participants, other researchers, program staff, other community members, and so on.
Then we put all data in single framework & apply various statistical tools to find out the dynamic on the market.
During the analysis stage, feedback from the stakeholder groups would be compared to determine areas of agreement as well as areas of divergence