
Key Insights
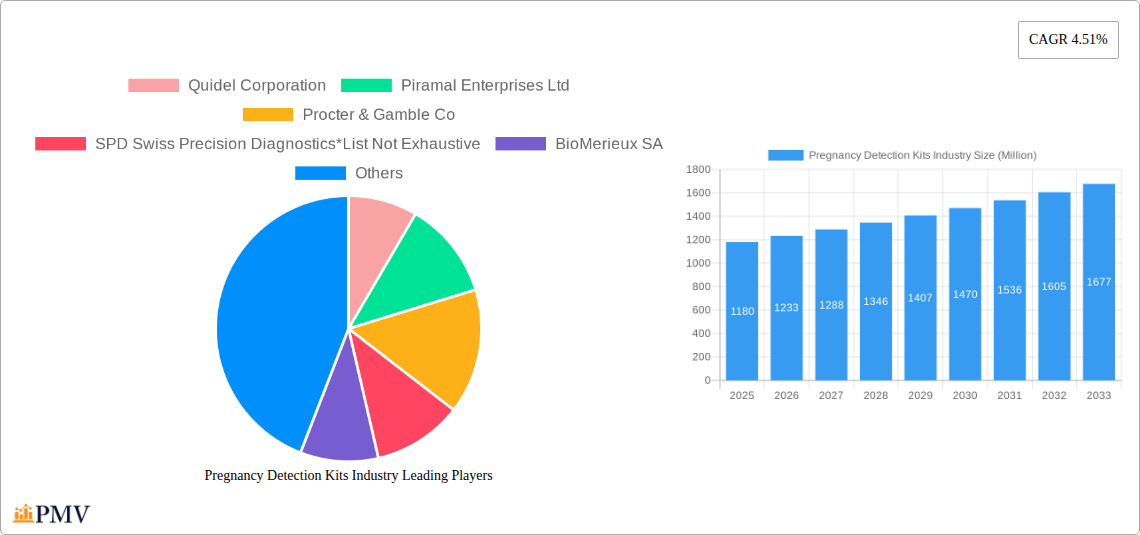
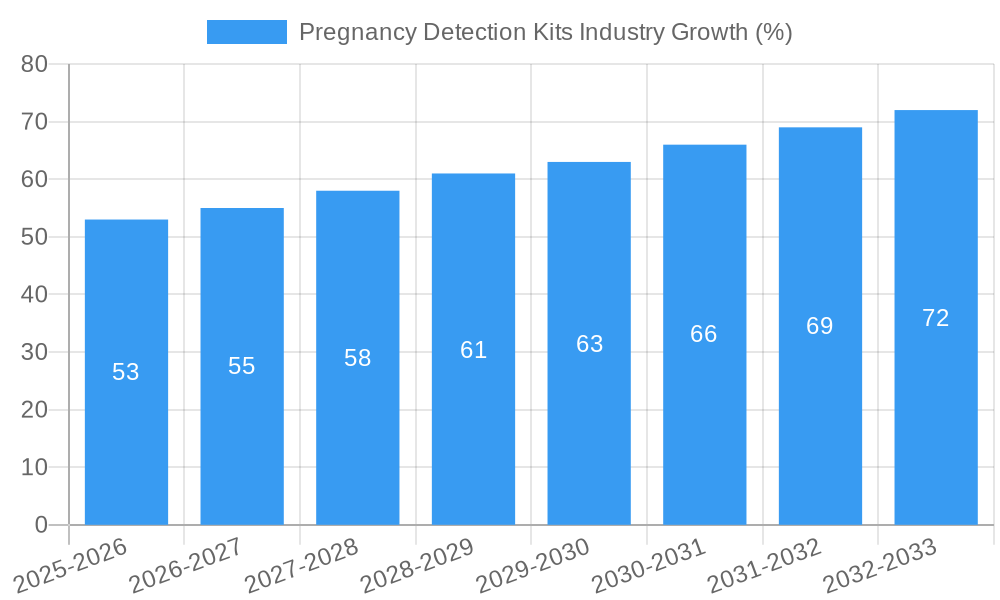
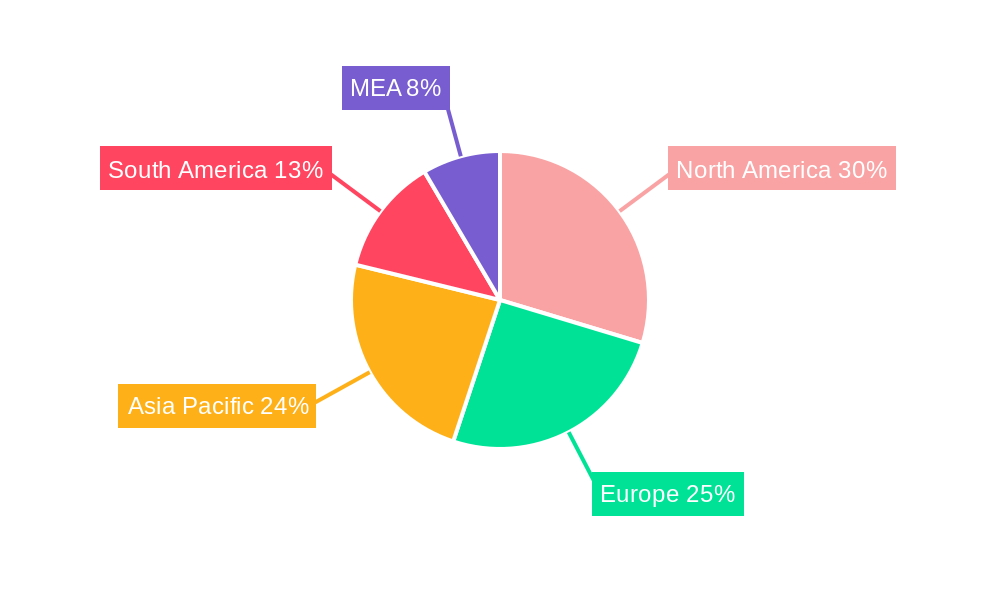
The global pregnancy detection kits market, valued at $1.18 billion in 2025, is projected to experience steady growth, driven by factors such as rising awareness of family planning, increasing female workforce participation, and advancements in testing technologies. The market's compound annual growth rate (CAGR) of 4.51% from 2025 to 2033 indicates a consistent expansion, with a significant contribution from developing economies witnessing rising disposable incomes and improved healthcare infrastructure. The increasing preference for convenient and accurate at-home tests, particularly digital pregnancy tests, is a key trend shaping market dynamics. While the rising cost of healthcare might pose a restraint, the convenience and affordability of over-the-counter options partly mitigate this. Market segmentation reveals the dominance of urine-based HCG tests, followed by blood tests, reflecting affordability and accessibility. Distribution channels are diverse, including hospital pharmacies, independent pharmacies, online retailers, and others, with online channels experiencing rapid growth driven by e-commerce penetration and consumer preference for home delivery. Key players like Quidel Corporation, Piramal Enterprises Ltd, and Procter & Gamble Co. are actively shaping market competition through innovation and product diversification, focusing on improved accuracy, user-friendliness, and digital connectivity in their offerings. The regional breakdown suggests strong market presence in North America and Europe, while Asia Pacific demonstrates significant growth potential due to population size and rising healthcare spending.
The forecast period of 2025-2033 anticipates continued expansion, with the market size expected to surpass $1.8 billion by 2033. This growth is fueled by ongoing technological advancements, including the development of early detection kits and improved accuracy levels. The increasing adoption of digital devices coupled with a rising preference for home testing contributes to market growth. Furthermore, effective marketing and distribution strategies by major players are expected to further drive market penetration. However, regulatory hurdles and the potential impact of alternative fertility solutions may influence market growth in the long term. Competitive landscape analysis indicates a blend of established players and emerging companies vying for market share, resulting in continuous innovation and improved product offerings for consumers.
Pregnancy Detection Kits Industry Market Report: 2019-2033
This comprehensive report provides an in-depth analysis of the global Pregnancy Detection Kits market, offering valuable insights for stakeholders across the industry value chain. The report covers the period from 2019 to 2033, with a focus on the forecast period 2025-2033 and a base year of 2025. The study encompasses detailed market segmentation by product type, test type, distribution channel, and geographic location, providing a granular understanding of market dynamics. Key players like Quidel Corporation, Piramal Enterprises Ltd, Procter & Gamble Co, SPD Swiss Precision Diagnostics, BioMerieux SA, Abbott Laboratories, Cardinal Health Inc, Axis Medicare, Mankind Pharma, Germaine Laboratories Inc, and Church & Dwight Co Inc. are analyzed in detail. The report’s xx Million USD market valuation provides a robust foundation for strategic decision-making.
Pregnancy Detection Kits Industry Market Structure & Competitive Dynamics
The global pregnancy detection kits market exhibits a moderately consolidated structure, with a few large multinational corporations holding significant market share. However, the presence of numerous smaller regional players and emerging companies contributes to a dynamic competitive landscape. Market concentration is assessed through the Herfindahl-Hirschman Index (HHI), revealing a xx score, indicating a moderately competitive environment. Innovation is a key driver, with continuous improvements in test accuracy, ease of use, and digitalization of devices. Regulatory frameworks governing medical devices vary across countries, influencing market access and product approvals. Substitutes for pregnancy detection kits are limited, with the primary alternative being blood tests conducted in clinical settings. End-user trends, including the increasing preference for at-home testing and a growing awareness of reproductive health, significantly impact market growth. Mergers and acquisitions (M&A) activity in the industry has been moderate, with xx Million USD worth of deals recorded in the past five years. Major M&A events have focused on expanding product portfolios, geographic reach, and technological capabilities.
- Market Share: Top 5 players hold approximately xx% of the global market share.
- M&A Deal Value (2019-2024): xx Million USD
- Average Deal Size: xx Million USD
Pregnancy Detection Kits Industry Industry Trends & Insights
The global pregnancy detection kits market is experiencing robust growth, driven by several factors. The rising prevalence of unintended pregnancies, increasing awareness of reproductive health, and the expanding accessibility of at-home testing options contribute significantly to market expansion. Technological advancements have led to the development of more accurate, sensitive, and user-friendly devices. The growing adoption of digital pregnancy tests with immediate results is a major trend. Consumer preferences are shifting towards convenient, rapid, and accurate tests, driving innovation and product development. The market is witnessing a shift from traditional urine-based tests to more advanced digital tests. The CAGR for the period 2019-2024 is estimated at xx%, and market penetration in developed regions is near saturation, while developing markets are showing high growth potential. The projected CAGR for the forecast period (2025-2033) is xx%, driven by factors such as rising disposable incomes in developing countries and increasing healthcare expenditure.
Dominant Markets & Segments in Pregnancy Detection Kits Industry
The North American market currently holds the largest share of the global pregnancy detection kits market, driven by high healthcare expenditure, strong consumer awareness, and widespread access to healthcare facilities. However, the Asia-Pacific region is predicted to experience the fastest growth during the forecast period, fueled by rising disposable incomes, increasing population, and improving healthcare infrastructure. Within market segments:
- By Product Type: Midstream pregnancy tests dominate the market due to ease of use and availability, followed by line pregnancy tests.
- By Test Type: Urine tests for HCG are the most prevalent and widely used method for home pregnancy tests, while blood tests for HCG remain popular in clinical settings.
- By Distribution Channel: Independent pharmacies and drugstores hold the largest market share in the distribution of pregnancy tests, however, the online pharmacy segment is witnessing rapid growth, with many businesses establishing an online presence to reach new customers.
Key Drivers:
- North America: High per capita income, advanced healthcare infrastructure, and high awareness levels.
- Asia-Pacific: Rapid population growth, rising disposable incomes, and improving healthcare access.
Pregnancy Detection Kits Industry Product Innovations
Recent innovations in pregnancy detection kits focus on improving accuracy, speed, and user experience. Digital pregnancy tests with immediate results are gaining popularity, along with the development of more sensitive tests capable of detecting pregnancy earlier. The integration of mobile apps with testing devices is also emerging as a key trend, offering users enhanced convenience and tracking capabilities. These innovations cater to the growing demand for convenient, reliable, and user-friendly at-home testing solutions.
Report Segmentation & Scope
The report comprehensively segments the pregnancy detection kits market based on several criteria:
- By Product Type: Line pregnancy tests and midstream pregnancy tests, with distinct growth projections for each segment based on market dynamics. Midstream tests are expected to retain their dominant position.
- By Test Type: Urine test for HCG and blood test for HCG, with growth projections shaped by accessibility and cost considerations. Urine tests dominate the home testing market.
- By Distribution Channel: Hospital pharmacies, independent pharmacies and drug stores, online pharmacies, and other distribution channels. Online pharmacies are expected to show high growth.
Each segment's market size, competitive dynamics, and growth projections are meticulously analyzed.
Key Drivers of Pregnancy Detection Kits Industry Growth
Several key factors fuel the growth of the pregnancy detection kits market. Increased awareness of reproductive health and family planning initiatives encourage testing. Rising disposable incomes in emerging economies increase accessibility to these products. The technological advancements resulting in more accurate and convenient tests further accelerate market expansion. Government regulations supporting access to healthcare also plays a key role.
Challenges in the Pregnancy Detection Kits Industry Sector
The pregnancy detection kits market faces challenges such as stringent regulatory approvals for new products, fluctuations in raw material prices affecting production costs, and the intense competition among numerous market players, leading to price wars and reduced profit margins. These factors significantly impact market growth and profitability.
Leading Players in the Pregnancy Detection Kits Industry Market
- Quidel Corporation
- Piramal Enterprises Ltd
- Procter & Gamble Co
- SPD Swiss Precision Diagnostics
- BioMerieux SA
- Abbott Laboratories
- Cardinal Health Inc
- Axis Medicare
- Mankind Pharma
- Germaine Laboratories Inc
- Church & Dwight Co Inc
Key Developments in Pregnancy Detection Kits Industry Sector
- April 2022: Mankind Pharma launched Prega News Advanced, a single-step pregnancy test in India.
- June 2022: Mylab Discovery Solutions launched PregaScreen, an at-home pregnancy test kit.
Strategic Pregnancy Detection Kits Industry Market Outlook
The future of the pregnancy detection kits market looks promising, with continued growth driven by technological innovation, rising awareness, and increasing demand for at-home testing. Strategic opportunities lie in expanding into untapped markets, developing innovative products with enhanced features, and focusing on digital solutions and e-commerce. The market presents significant potential for growth and profitability for companies that can adapt to evolving consumer needs and technological advancements.
Pregnancy Detection Kits Industry Segmentation
-
1. Product Type
-
1.1. Line Pregnancy Tests
- 1.1.1. Test Cassette Format
- 1.1.2. Test Strip Format
- 1.1.3. Test Midstream Format
- 1.2. Digital Devices
-
1.1. Line Pregnancy Tests
-
2. Type of Test
- 2.1. Urine test for HCG
- 2.2. Blood test for HCG
-
3. Distribution Channel
- 3.1. Hospital Pharmacies
- 3.2. Independent Pharmacies and Drug Store
- 3.3. Online Pharmacies
- 3.4. Other Distribution Channels
Pregnancy Detection Kits Industry Segmentation By Geography
-
1. North America
- 1.1. United States
- 1.2. Canada
- 1.3. Mexico
-
2. Europe
- 2.1. Germany
- 2.2. United Kingdom
- 2.3. France
- 2.4. Italy
- 2.5. Spain
- 2.6. Rest of Europe
-
3. Asia Pacific
- 3.1. China
- 3.2. Japan
- 3.3. India
- 3.4. Australia
- 3.5. South Korea
- 3.6. Rest of Asia Pacific
-
4. Middle East and Africa
- 4.1. GCC
- 4.2. South Africa
- 4.3. Rest of Middle East and Africa
-
5. South America
- 5.1. Brazil
- 5.2. Argentina
- 5.3. Rest of South America
Pregnancy Detection Kits Industry REPORT HIGHLIGHTS
| Aspects | Details |
|---|---|
| Study Period | 2019-2033 |
| Base Year | 2024 |
| Estimated Year | 2025 |
| Forecast Period | 2025-2033 |
| Historical Period | 2019-2024 |
| Growth Rate | CAGR of 4.51% from 2019-2033 |
| Segmentation |
|
Table of Contents
- 1. Introduction
- 1.1. Research Scope
- 1.2. Market Segmentation
- 1.3. Research Methodology
- 1.4. Definitions and Assumptions
- 2. Executive Summary
- 2.1. Introduction
- 3. Market Dynamics
- 3.1. Introduction
- 3.2. Market Drivers
- 3.2.1. Increase in Unplanned Pregnancies; Rise in Disposable Income; Changing Lifestyles and Growing Women Literacy Rate
- 3.3. Market Restrains
- 3.3.1. Lack of Availability and Awareness in Low Income Countries
- 3.4. Market Trends
- 3.4.1. Blood test for HCG Segment is Expected to Witness Growth Over the Forecast Period
- 4. Market Factor Analysis
- 4.1. Porters Five Forces
- 4.2. Supply/Value Chain
- 4.3. PESTEL analysis
- 4.4. Market Entropy
- 4.5. Patent/Trademark Analysis
- 5. Global Pregnancy Detection Kits Industry Analysis, Insights and Forecast, 2019-2031
- 5.1. Market Analysis, Insights and Forecast - by Product Type
- 5.1.1. Line Pregnancy Tests
- 5.1.1.1. Test Cassette Format
- 5.1.1.2. Test Strip Format
- 5.1.1.3. Test Midstream Format
- 5.1.2. Digital Devices
- 5.1.1. Line Pregnancy Tests
- 5.2. Market Analysis, Insights and Forecast - by Type of Test
- 5.2.1. Urine test for HCG
- 5.2.2. Blood test for HCG
- 5.3. Market Analysis, Insights and Forecast - by Distribution Channel
- 5.3.1. Hospital Pharmacies
- 5.3.2. Independent Pharmacies and Drug Store
- 5.3.3. Online Pharmacies
- 5.3.4. Other Distribution Channels
- 5.4. Market Analysis, Insights and Forecast - by Region
- 5.4.1. North America
- 5.4.2. Europe
- 5.4.3. Asia Pacific
- 5.4.4. Middle East and Africa
- 5.4.5. South America
- 5.1. Market Analysis, Insights and Forecast - by Product Type
- 6. North America Pregnancy Detection Kits Industry Analysis, Insights and Forecast, 2019-2031
- 6.1. Market Analysis, Insights and Forecast - by Product Type
- 6.1.1. Line Pregnancy Tests
- 6.1.1.1. Test Cassette Format
- 6.1.1.2. Test Strip Format
- 6.1.1.3. Test Midstream Format
- 6.1.2. Digital Devices
- 6.1.1. Line Pregnancy Tests
- 6.2. Market Analysis, Insights and Forecast - by Type of Test
- 6.2.1. Urine test for HCG
- 6.2.2. Blood test for HCG
- 6.3. Market Analysis, Insights and Forecast - by Distribution Channel
- 6.3.1. Hospital Pharmacies
- 6.3.2. Independent Pharmacies and Drug Store
- 6.3.3. Online Pharmacies
- 6.3.4. Other Distribution Channels
- 6.1. Market Analysis, Insights and Forecast - by Product Type
- 7. Europe Pregnancy Detection Kits Industry Analysis, Insights and Forecast, 2019-2031
- 7.1. Market Analysis, Insights and Forecast - by Product Type
- 7.1.1. Line Pregnancy Tests
- 7.1.1.1. Test Cassette Format
- 7.1.1.2. Test Strip Format
- 7.1.1.3. Test Midstream Format
- 7.1.2. Digital Devices
- 7.1.1. Line Pregnancy Tests
- 7.2. Market Analysis, Insights and Forecast - by Type of Test
- 7.2.1. Urine test for HCG
- 7.2.2. Blood test for HCG
- 7.3. Market Analysis, Insights and Forecast - by Distribution Channel
- 7.3.1. Hospital Pharmacies
- 7.3.2. Independent Pharmacies and Drug Store
- 7.3.3. Online Pharmacies
- 7.3.4. Other Distribution Channels
- 7.1. Market Analysis, Insights and Forecast - by Product Type
- 8. Asia Pacific Pregnancy Detection Kits Industry Analysis, Insights and Forecast, 2019-2031
- 8.1. Market Analysis, Insights and Forecast - by Product Type
- 8.1.1. Line Pregnancy Tests
- 8.1.1.1. Test Cassette Format
- 8.1.1.2. Test Strip Format
- 8.1.1.3. Test Midstream Format
- 8.1.2. Digital Devices
- 8.1.1. Line Pregnancy Tests
- 8.2. Market Analysis, Insights and Forecast - by Type of Test
- 8.2.1. Urine test for HCG
- 8.2.2. Blood test for HCG
- 8.3. Market Analysis, Insights and Forecast - by Distribution Channel
- 8.3.1. Hospital Pharmacies
- 8.3.2. Independent Pharmacies and Drug Store
- 8.3.3. Online Pharmacies
- 8.3.4. Other Distribution Channels
- 8.1. Market Analysis, Insights and Forecast - by Product Type
- 9. Middle East and Africa Pregnancy Detection Kits Industry Analysis, Insights and Forecast, 2019-2031
- 9.1. Market Analysis, Insights and Forecast - by Product Type
- 9.1.1. Line Pregnancy Tests
- 9.1.1.1. Test Cassette Format
- 9.1.1.2. Test Strip Format
- 9.1.1.3. Test Midstream Format
- 9.1.2. Digital Devices
- 9.1.1. Line Pregnancy Tests
- 9.2. Market Analysis, Insights and Forecast - by Type of Test
- 9.2.1. Urine test for HCG
- 9.2.2. Blood test for HCG
- 9.3. Market Analysis, Insights and Forecast - by Distribution Channel
- 9.3.1. Hospital Pharmacies
- 9.3.2. Independent Pharmacies and Drug Store
- 9.3.3. Online Pharmacies
- 9.3.4. Other Distribution Channels
- 9.1. Market Analysis, Insights and Forecast - by Product Type
- 10. South America Pregnancy Detection Kits Industry Analysis, Insights and Forecast, 2019-2031
- 10.1. Market Analysis, Insights and Forecast - by Product Type
- 10.1.1. Line Pregnancy Tests
- 10.1.1.1. Test Cassette Format
- 10.1.1.2. Test Strip Format
- 10.1.1.3. Test Midstream Format
- 10.1.2. Digital Devices
- 10.1.1. Line Pregnancy Tests
- 10.2. Market Analysis, Insights and Forecast - by Type of Test
- 10.2.1. Urine test for HCG
- 10.2.2. Blood test for HCG
- 10.3. Market Analysis, Insights and Forecast - by Distribution Channel
- 10.3.1. Hospital Pharmacies
- 10.3.2. Independent Pharmacies and Drug Store
- 10.3.3. Online Pharmacies
- 10.3.4. Other Distribution Channels
- 10.1. Market Analysis, Insights and Forecast - by Product Type
- 11. North Americ Pregnancy Detection Kits Industry Analysis, Insights and Forecast, 2019-2031
- 11.1. Market Analysis, Insights and Forecast - By Country/Sub-region
- 11.1.1 United States
- 11.1.2 Canada
- 11.1.3 Mexico
- 12. South America Pregnancy Detection Kits Industry Analysis, Insights and Forecast, 2019-2031
- 12.1. Market Analysis, Insights and Forecast - By Country/Sub-region
- 12.1.1 Brazil
- 12.1.2 Mexico
- 12.1.3 Rest of South America
- 13. Europe Pregnancy Detection Kits Industry Analysis, Insights and Forecast, 2019-2031
- 13.1. Market Analysis, Insights and Forecast - By Country/Sub-region
- 13.1.1 Germany
- 13.1.2 United Kingdom
- 13.1.3 France
- 13.1.4 Italy
- 13.1.5 Spain
- 13.1.6 Rest of Europe
- 14. Asia Pacific Pregnancy Detection Kits Industry Analysis, Insights and Forecast, 2019-2031
- 14.1. Market Analysis, Insights and Forecast - By Country/Sub-region
- 14.1.1 China
- 14.1.2 Japan
- 14.1.3 India
- 14.1.4 South Korea
- 14.1.5 Taiwan
- 14.1.6 Australia
- 14.1.7 Rest of Asia-Pacific
- 15. MEA Pregnancy Detection Kits Industry Analysis, Insights and Forecast, 2019-2031
- 15.1. Market Analysis, Insights and Forecast - By Country/Sub-region
- 15.1.1 Middle East
- 15.1.2 Africa
- 16. Competitive Analysis
- 16.1. Global Market Share Analysis 2024
- 16.2. Company Profiles
- 16.2.1 Quidel Corporation
- 16.2.1.1. Overview
- 16.2.1.2. Products
- 16.2.1.3. SWOT Analysis
- 16.2.1.4. Recent Developments
- 16.2.1.5. Financials (Based on Availability)
- 16.2.2 Piramal Enterprises Ltd
- 16.2.2.1. Overview
- 16.2.2.2. Products
- 16.2.2.3. SWOT Analysis
- 16.2.2.4. Recent Developments
- 16.2.2.5. Financials (Based on Availability)
- 16.2.3 Procter & Gamble Co
- 16.2.3.1. Overview
- 16.2.3.2. Products
- 16.2.3.3. SWOT Analysis
- 16.2.3.4. Recent Developments
- 16.2.3.5. Financials (Based on Availability)
- 16.2.4 SPD Swiss Precision Diagnostics*List Not Exhaustive
- 16.2.4.1. Overview
- 16.2.4.2. Products
- 16.2.4.3. SWOT Analysis
- 16.2.4.4. Recent Developments
- 16.2.4.5. Financials (Based on Availability)
- 16.2.5 BioMerieux SA
- 16.2.5.1. Overview
- 16.2.5.2. Products
- 16.2.5.3. SWOT Analysis
- 16.2.5.4. Recent Developments
- 16.2.5.5. Financials (Based on Availability)
- 16.2.6 Abbott Laboratories
- 16.2.6.1. Overview
- 16.2.6.2. Products
- 16.2.6.3. SWOT Analysis
- 16.2.6.4. Recent Developments
- 16.2.6.5. Financials (Based on Availability)
- 16.2.7 Cardinal Health Inc
- 16.2.7.1. Overview
- 16.2.7.2. Products
- 16.2.7.3. SWOT Analysis
- 16.2.7.4. Recent Developments
- 16.2.7.5. Financials (Based on Availability)
- 16.2.8 Axis Medicare
- 16.2.8.1. Overview
- 16.2.8.2. Products
- 16.2.8.3. SWOT Analysis
- 16.2.8.4. Recent Developments
- 16.2.8.5. Financials (Based on Availability)
- 16.2.9 Mankind Pharma
- 16.2.9.1. Overview
- 16.2.9.2. Products
- 16.2.9.3. SWOT Analysis
- 16.2.9.4. Recent Developments
- 16.2.9.5. Financials (Based on Availability)
- 16.2.10 Germaine Laboratories Inc
- 16.2.10.1. Overview
- 16.2.10.2. Products
- 16.2.10.3. SWOT Analysis
- 16.2.10.4. Recent Developments
- 16.2.10.5. Financials (Based on Availability)
- 16.2.11 Church & Dwight Co Inc
- 16.2.11.1. Overview
- 16.2.11.2. Products
- 16.2.11.3. SWOT Analysis
- 16.2.11.4. Recent Developments
- 16.2.11.5. Financials (Based on Availability)
- 16.2.1 Quidel Corporation
List of Figures
- Figure 1: Global Pregnancy Detection Kits Industry Revenue Breakdown (Million, %) by Region 2024 & 2032
- Figure 2: Global Pregnancy Detection Kits Industry Volume Breakdown (K Tons, %) by Region 2024 & 2032
- Figure 3: North Americ Pregnancy Detection Kits Industry Revenue (Million), by Country 2024 & 2032
- Figure 4: North Americ Pregnancy Detection Kits Industry Volume (K Tons), by Country 2024 & 2032
- Figure 5: North Americ Pregnancy Detection Kits Industry Revenue Share (%), by Country 2024 & 2032
- Figure 6: North Americ Pregnancy Detection Kits Industry Volume Share (%), by Country 2024 & 2032
- Figure 7: South America Pregnancy Detection Kits Industry Revenue (Million), by Country 2024 & 2032
- Figure 8: South America Pregnancy Detection Kits Industry Volume (K Tons), by Country 2024 & 2032
- Figure 9: South America Pregnancy Detection Kits Industry Revenue Share (%), by Country 2024 & 2032
- Figure 10: South America Pregnancy Detection Kits Industry Volume Share (%), by Country 2024 & 2032
- Figure 11: Europe Pregnancy Detection Kits Industry Revenue (Million), by Country 2024 & 2032
- Figure 12: Europe Pregnancy Detection Kits Industry Volume (K Tons), by Country 2024 & 2032
- Figure 13: Europe Pregnancy Detection Kits Industry Revenue Share (%), by Country 2024 & 2032
- Figure 14: Europe Pregnancy Detection Kits Industry Volume Share (%), by Country 2024 & 2032
- Figure 15: Asia Pacific Pregnancy Detection Kits Industry Revenue (Million), by Country 2024 & 2032
- Figure 16: Asia Pacific Pregnancy Detection Kits Industry Volume (K Tons), by Country 2024 & 2032
- Figure 17: Asia Pacific Pregnancy Detection Kits Industry Revenue Share (%), by Country 2024 & 2032
- Figure 18: Asia Pacific Pregnancy Detection Kits Industry Volume Share (%), by Country 2024 & 2032
- Figure 19: MEA Pregnancy Detection Kits Industry Revenue (Million), by Country 2024 & 2032
- Figure 20: MEA Pregnancy Detection Kits Industry Volume (K Tons), by Country 2024 & 2032
- Figure 21: MEA Pregnancy Detection Kits Industry Revenue Share (%), by Country 2024 & 2032
- Figure 22: MEA Pregnancy Detection Kits Industry Volume Share (%), by Country 2024 & 2032
- Figure 23: North America Pregnancy Detection Kits Industry Revenue (Million), by Product Type 2024 & 2032
- Figure 24: North America Pregnancy Detection Kits Industry Volume (K Tons), by Product Type 2024 & 2032
- Figure 25: North America Pregnancy Detection Kits Industry Revenue Share (%), by Product Type 2024 & 2032
- Figure 26: North America Pregnancy Detection Kits Industry Volume Share (%), by Product Type 2024 & 2032
- Figure 27: North America Pregnancy Detection Kits Industry Revenue (Million), by Type of Test 2024 & 2032
- Figure 28: North America Pregnancy Detection Kits Industry Volume (K Tons), by Type of Test 2024 & 2032
- Figure 29: North America Pregnancy Detection Kits Industry Revenue Share (%), by Type of Test 2024 & 2032
- Figure 30: North America Pregnancy Detection Kits Industry Volume Share (%), by Type of Test 2024 & 2032
- Figure 31: North America Pregnancy Detection Kits Industry Revenue (Million), by Distribution Channel 2024 & 2032
- Figure 32: North America Pregnancy Detection Kits Industry Volume (K Tons), by Distribution Channel 2024 & 2032
- Figure 33: North America Pregnancy Detection Kits Industry Revenue Share (%), by Distribution Channel 2024 & 2032
- Figure 34: North America Pregnancy Detection Kits Industry Volume Share (%), by Distribution Channel 2024 & 2032
- Figure 35: North America Pregnancy Detection Kits Industry Revenue (Million), by Country 2024 & 2032
- Figure 36: North America Pregnancy Detection Kits Industry Volume (K Tons), by Country 2024 & 2032
- Figure 37: North America Pregnancy Detection Kits Industry Revenue Share (%), by Country 2024 & 2032
- Figure 38: North America Pregnancy Detection Kits Industry Volume Share (%), by Country 2024 & 2032
- Figure 39: Europe Pregnancy Detection Kits Industry Revenue (Million), by Product Type 2024 & 2032
- Figure 40: Europe Pregnancy Detection Kits Industry Volume (K Tons), by Product Type 2024 & 2032
- Figure 41: Europe Pregnancy Detection Kits Industry Revenue Share (%), by Product Type 2024 & 2032
- Figure 42: Europe Pregnancy Detection Kits Industry Volume Share (%), by Product Type 2024 & 2032
- Figure 43: Europe Pregnancy Detection Kits Industry Revenue (Million), by Type of Test 2024 & 2032
- Figure 44: Europe Pregnancy Detection Kits Industry Volume (K Tons), by Type of Test 2024 & 2032
- Figure 45: Europe Pregnancy Detection Kits Industry Revenue Share (%), by Type of Test 2024 & 2032
- Figure 46: Europe Pregnancy Detection Kits Industry Volume Share (%), by Type of Test 2024 & 2032
- Figure 47: Europe Pregnancy Detection Kits Industry Revenue (Million), by Distribution Channel 2024 & 2032
- Figure 48: Europe Pregnancy Detection Kits Industry Volume (K Tons), by Distribution Channel 2024 & 2032
- Figure 49: Europe Pregnancy Detection Kits Industry Revenue Share (%), by Distribution Channel 2024 & 2032
- Figure 50: Europe Pregnancy Detection Kits Industry Volume Share (%), by Distribution Channel 2024 & 2032
- Figure 51: Europe Pregnancy Detection Kits Industry Revenue (Million), by Country 2024 & 2032
- Figure 52: Europe Pregnancy Detection Kits Industry Volume (K Tons), by Country 2024 & 2032
- Figure 53: Europe Pregnancy Detection Kits Industry Revenue Share (%), by Country 2024 & 2032
- Figure 54: Europe Pregnancy Detection Kits Industry Volume Share (%), by Country 2024 & 2032
- Figure 55: Asia Pacific Pregnancy Detection Kits Industry Revenue (Million), by Product Type 2024 & 2032
- Figure 56: Asia Pacific Pregnancy Detection Kits Industry Volume (K Tons), by Product Type 2024 & 2032
- Figure 57: Asia Pacific Pregnancy Detection Kits Industry Revenue Share (%), by Product Type 2024 & 2032
- Figure 58: Asia Pacific Pregnancy Detection Kits Industry Volume Share (%), by Product Type 2024 & 2032
- Figure 59: Asia Pacific Pregnancy Detection Kits Industry Revenue (Million), by Type of Test 2024 & 2032
- Figure 60: Asia Pacific Pregnancy Detection Kits Industry Volume (K Tons), by Type of Test 2024 & 2032
- Figure 61: Asia Pacific Pregnancy Detection Kits Industry Revenue Share (%), by Type of Test 2024 & 2032
- Figure 62: Asia Pacific Pregnancy Detection Kits Industry Volume Share (%), by Type of Test 2024 & 2032
- Figure 63: Asia Pacific Pregnancy Detection Kits Industry Revenue (Million), by Distribution Channel 2024 & 2032
- Figure 64: Asia Pacific Pregnancy Detection Kits Industry Volume (K Tons), by Distribution Channel 2024 & 2032
- Figure 65: Asia Pacific Pregnancy Detection Kits Industry Revenue Share (%), by Distribution Channel 2024 & 2032
- Figure 66: Asia Pacific Pregnancy Detection Kits Industry Volume Share (%), by Distribution Channel 2024 & 2032
- Figure 67: Asia Pacific Pregnancy Detection Kits Industry Revenue (Million), by Country 2024 & 2032
- Figure 68: Asia Pacific Pregnancy Detection Kits Industry Volume (K Tons), by Country 2024 & 2032
- Figure 69: Asia Pacific Pregnancy Detection Kits Industry Revenue Share (%), by Country 2024 & 2032
- Figure 70: Asia Pacific Pregnancy Detection Kits Industry Volume Share (%), by Country 2024 & 2032
- Figure 71: Middle East and Africa Pregnancy Detection Kits Industry Revenue (Million), by Product Type 2024 & 2032
- Figure 72: Middle East and Africa Pregnancy Detection Kits Industry Volume (K Tons), by Product Type 2024 & 2032
- Figure 73: Middle East and Africa Pregnancy Detection Kits Industry Revenue Share (%), by Product Type 2024 & 2032
- Figure 74: Middle East and Africa Pregnancy Detection Kits Industry Volume Share (%), by Product Type 2024 & 2032
- Figure 75: Middle East and Africa Pregnancy Detection Kits Industry Revenue (Million), by Type of Test 2024 & 2032
- Figure 76: Middle East and Africa Pregnancy Detection Kits Industry Volume (K Tons), by Type of Test 2024 & 2032
- Figure 77: Middle East and Africa Pregnancy Detection Kits Industry Revenue Share (%), by Type of Test 2024 & 2032
- Figure 78: Middle East and Africa Pregnancy Detection Kits Industry Volume Share (%), by Type of Test 2024 & 2032
- Figure 79: Middle East and Africa Pregnancy Detection Kits Industry Revenue (Million), by Distribution Channel 2024 & 2032
- Figure 80: Middle East and Africa Pregnancy Detection Kits Industry Volume (K Tons), by Distribution Channel 2024 & 2032
- Figure 81: Middle East and Africa Pregnancy Detection Kits Industry Revenue Share (%), by Distribution Channel 2024 & 2032
- Figure 82: Middle East and Africa Pregnancy Detection Kits Industry Volume Share (%), by Distribution Channel 2024 & 2032
- Figure 83: Middle East and Africa Pregnancy Detection Kits Industry Revenue (Million), by Country 2024 & 2032
- Figure 84: Middle East and Africa Pregnancy Detection Kits Industry Volume (K Tons), by Country 2024 & 2032
- Figure 85: Middle East and Africa Pregnancy Detection Kits Industry Revenue Share (%), by Country 2024 & 2032
- Figure 86: Middle East and Africa Pregnancy Detection Kits Industry Volume Share (%), by Country 2024 & 2032
- Figure 87: South America Pregnancy Detection Kits Industry Revenue (Million), by Product Type 2024 & 2032
- Figure 88: South America Pregnancy Detection Kits Industry Volume (K Tons), by Product Type 2024 & 2032
- Figure 89: South America Pregnancy Detection Kits Industry Revenue Share (%), by Product Type 2024 & 2032
- Figure 90: South America Pregnancy Detection Kits Industry Volume Share (%), by Product Type 2024 & 2032
- Figure 91: South America Pregnancy Detection Kits Industry Revenue (Million), by Type of Test 2024 & 2032
- Figure 92: South America Pregnancy Detection Kits Industry Volume (K Tons), by Type of Test 2024 & 2032
- Figure 93: South America Pregnancy Detection Kits Industry Revenue Share (%), by Type of Test 2024 & 2032
- Figure 94: South America Pregnancy Detection Kits Industry Volume Share (%), by Type of Test 2024 & 2032
- Figure 95: South America Pregnancy Detection Kits Industry Revenue (Million), by Distribution Channel 2024 & 2032
- Figure 96: South America Pregnancy Detection Kits Industry Volume (K Tons), by Distribution Channel 2024 & 2032
- Figure 97: South America Pregnancy Detection Kits Industry Revenue Share (%), by Distribution Channel 2024 & 2032
- Figure 98: South America Pregnancy Detection Kits Industry Volume Share (%), by Distribution Channel 2024 & 2032
- Figure 99: South America Pregnancy Detection Kits Industry Revenue (Million), by Country 2024 & 2032
- Figure 100: South America Pregnancy Detection Kits Industry Volume (K Tons), by Country 2024 & 2032
- Figure 101: South America Pregnancy Detection Kits Industry Revenue Share (%), by Country 2024 & 2032
- Figure 102: South America Pregnancy Detection Kits Industry Volume Share (%), by Country 2024 & 2032
List of Tables
- Table 1: Global Pregnancy Detection Kits Industry Revenue Million Forecast, by Region 2019 & 2032
- Table 2: Global Pregnancy Detection Kits Industry Volume K Tons Forecast, by Region 2019 & 2032
- Table 3: Global Pregnancy Detection Kits Industry Revenue Million Forecast, by Product Type 2019 & 2032
- Table 4: Global Pregnancy Detection Kits Industry Volume K Tons Forecast, by Product Type 2019 & 2032
- Table 5: Global Pregnancy Detection Kits Industry Revenue Million Forecast, by Type of Test 2019 & 2032
- Table 6: Global Pregnancy Detection Kits Industry Volume K Tons Forecast, by Type of Test 2019 & 2032
- Table 7: Global Pregnancy Detection Kits Industry Revenue Million Forecast, by Distribution Channel 2019 & 2032
- Table 8: Global Pregnancy Detection Kits Industry Volume K Tons Forecast, by Distribution Channel 2019 & 2032
- Table 9: Global Pregnancy Detection Kits Industry Revenue Million Forecast, by Region 2019 & 2032
- Table 10: Global Pregnancy Detection Kits Industry Volume K Tons Forecast, by Region 2019 & 2032
- Table 11: Global Pregnancy Detection Kits Industry Revenue Million Forecast, by Country 2019 & 2032
- Table 12: Global Pregnancy Detection Kits Industry Volume K Tons Forecast, by Country 2019 & 2032
- Table 13: United States Pregnancy Detection Kits Industry Revenue (Million) Forecast, by Application 2019 & 2032
- Table 14: United States Pregnancy Detection Kits Industry Volume (K Tons) Forecast, by Application 2019 & 2032
- Table 15: Canada Pregnancy Detection Kits Industry Revenue (Million) Forecast, by Application 2019 & 2032
- Table 16: Canada Pregnancy Detection Kits Industry Volume (K Tons) Forecast, by Application 2019 & 2032
- Table 17: Mexico Pregnancy Detection Kits Industry Revenue (Million) Forecast, by Application 2019 & 2032
- Table 18: Mexico Pregnancy Detection Kits Industry Volume (K Tons) Forecast, by Application 2019 & 2032
- Table 19: Global Pregnancy Detection Kits Industry Revenue Million Forecast, by Country 2019 & 2032
- Table 20: Global Pregnancy Detection Kits Industry Volume K Tons Forecast, by Country 2019 & 2032
- Table 21: Brazil Pregnancy Detection Kits Industry Revenue (Million) Forecast, by Application 2019 & 2032
- Table 22: Brazil Pregnancy Detection Kits Industry Volume (K Tons) Forecast, by Application 2019 & 2032
- Table 23: Mexico Pregnancy Detection Kits Industry Revenue (Million) Forecast, by Application 2019 & 2032
- Table 24: Mexico Pregnancy Detection Kits Industry Volume (K Tons) Forecast, by Application 2019 & 2032
- Table 25: Rest of South America Pregnancy Detection Kits Industry Revenue (Million) Forecast, by Application 2019 & 2032
- Table 26: Rest of South America Pregnancy Detection Kits Industry Volume (K Tons) Forecast, by Application 2019 & 2032
- Table 27: Global Pregnancy Detection Kits Industry Revenue Million Forecast, by Country 2019 & 2032
- Table 28: Global Pregnancy Detection Kits Industry Volume K Tons Forecast, by Country 2019 & 2032
- Table 29: Germany Pregnancy Detection Kits Industry Revenue (Million) Forecast, by Application 2019 & 2032
- Table 30: Germany Pregnancy Detection Kits Industry Volume (K Tons) Forecast, by Application 2019 & 2032
- Table 31: United Kingdom Pregnancy Detection Kits Industry Revenue (Million) Forecast, by Application 2019 & 2032
- Table 32: United Kingdom Pregnancy Detection Kits Industry Volume (K Tons) Forecast, by Application 2019 & 2032
- Table 33: France Pregnancy Detection Kits Industry Revenue (Million) Forecast, by Application 2019 & 2032
- Table 34: France Pregnancy Detection Kits Industry Volume (K Tons) Forecast, by Application 2019 & 2032
- Table 35: Italy Pregnancy Detection Kits Industry Revenue (Million) Forecast, by Application 2019 & 2032
- Table 36: Italy Pregnancy Detection Kits Industry Volume (K Tons) Forecast, by Application 2019 & 2032
- Table 37: Spain Pregnancy Detection Kits Industry Revenue (Million) Forecast, by Application 2019 & 2032
- Table 38: Spain Pregnancy Detection Kits Industry Volume (K Tons) Forecast, by Application 2019 & 2032
- Table 39: Rest of Europe Pregnancy Detection Kits Industry Revenue (Million) Forecast, by Application 2019 & 2032
- Table 40: Rest of Europe Pregnancy Detection Kits Industry Volume (K Tons) Forecast, by Application 2019 & 2032
- Table 41: Global Pregnancy Detection Kits Industry Revenue Million Forecast, by Country 2019 & 2032
- Table 42: Global Pregnancy Detection Kits Industry Volume K Tons Forecast, by Country 2019 & 2032
- Table 43: China Pregnancy Detection Kits Industry Revenue (Million) Forecast, by Application 2019 & 2032
- Table 44: China Pregnancy Detection Kits Industry Volume (K Tons) Forecast, by Application 2019 & 2032
- Table 45: Japan Pregnancy Detection Kits Industry Revenue (Million) Forecast, by Application 2019 & 2032
- Table 46: Japan Pregnancy Detection Kits Industry Volume (K Tons) Forecast, by Application 2019 & 2032
- Table 47: India Pregnancy Detection Kits Industry Revenue (Million) Forecast, by Application 2019 & 2032
- Table 48: India Pregnancy Detection Kits Industry Volume (K Tons) Forecast, by Application 2019 & 2032
- Table 49: South Korea Pregnancy Detection Kits Industry Revenue (Million) Forecast, by Application 2019 & 2032
- Table 50: South Korea Pregnancy Detection Kits Industry Volume (K Tons) Forecast, by Application 2019 & 2032
- Table 51: Taiwan Pregnancy Detection Kits Industry Revenue (Million) Forecast, by Application 2019 & 2032
- Table 52: Taiwan Pregnancy Detection Kits Industry Volume (K Tons) Forecast, by Application 2019 & 2032
- Table 53: Australia Pregnancy Detection Kits Industry Revenue (Million) Forecast, by Application 2019 & 2032
- Table 54: Australia Pregnancy Detection Kits Industry Volume (K Tons) Forecast, by Application 2019 & 2032
- Table 55: Rest of Asia-Pacific Pregnancy Detection Kits Industry Revenue (Million) Forecast, by Application 2019 & 2032
- Table 56: Rest of Asia-Pacific Pregnancy Detection Kits Industry Volume (K Tons) Forecast, by Application 2019 & 2032
- Table 57: Global Pregnancy Detection Kits Industry Revenue Million Forecast, by Country 2019 & 2032
- Table 58: Global Pregnancy Detection Kits Industry Volume K Tons Forecast, by Country 2019 & 2032
- Table 59: Middle East Pregnancy Detection Kits Industry Revenue (Million) Forecast, by Application 2019 & 2032
- Table 60: Middle East Pregnancy Detection Kits Industry Volume (K Tons) Forecast, by Application 2019 & 2032
- Table 61: Africa Pregnancy Detection Kits Industry Revenue (Million) Forecast, by Application 2019 & 2032
- Table 62: Africa Pregnancy Detection Kits Industry Volume (K Tons) Forecast, by Application 2019 & 2032
- Table 63: Global Pregnancy Detection Kits Industry Revenue Million Forecast, by Product Type 2019 & 2032
- Table 64: Global Pregnancy Detection Kits Industry Volume K Tons Forecast, by Product Type 2019 & 2032
- Table 65: Global Pregnancy Detection Kits Industry Revenue Million Forecast, by Type of Test 2019 & 2032
- Table 66: Global Pregnancy Detection Kits Industry Volume K Tons Forecast, by Type of Test 2019 & 2032
- Table 67: Global Pregnancy Detection Kits Industry Revenue Million Forecast, by Distribution Channel 2019 & 2032
- Table 68: Global Pregnancy Detection Kits Industry Volume K Tons Forecast, by Distribution Channel 2019 & 2032
- Table 69: Global Pregnancy Detection Kits Industry Revenue Million Forecast, by Country 2019 & 2032
- Table 70: Global Pregnancy Detection Kits Industry Volume K Tons Forecast, by Country 2019 & 2032
- Table 71: United States Pregnancy Detection Kits Industry Revenue (Million) Forecast, by Application 2019 & 2032
- Table 72: United States Pregnancy Detection Kits Industry Volume (K Tons) Forecast, by Application 2019 & 2032
- Table 73: Canada Pregnancy Detection Kits Industry Revenue (Million) Forecast, by Application 2019 & 2032
- Table 74: Canada Pregnancy Detection Kits Industry Volume (K Tons) Forecast, by Application 2019 & 2032
- Table 75: Mexico Pregnancy Detection Kits Industry Revenue (Million) Forecast, by Application 2019 & 2032
- Table 76: Mexico Pregnancy Detection Kits Industry Volume (K Tons) Forecast, by Application 2019 & 2032
- Table 77: Global Pregnancy Detection Kits Industry Revenue Million Forecast, by Product Type 2019 & 2032
- Table 78: Global Pregnancy Detection Kits Industry Volume K Tons Forecast, by Product Type 2019 & 2032
- Table 79: Global Pregnancy Detection Kits Industry Revenue Million Forecast, by Type of Test 2019 & 2032
- Table 80: Global Pregnancy Detection Kits Industry Volume K Tons Forecast, by Type of Test 2019 & 2032
- Table 81: Global Pregnancy Detection Kits Industry Revenue Million Forecast, by Distribution Channel 2019 & 2032
- Table 82: Global Pregnancy Detection Kits Industry Volume K Tons Forecast, by Distribution Channel 2019 & 2032
- Table 83: Global Pregnancy Detection Kits Industry Revenue Million Forecast, by Country 2019 & 2032
- Table 84: Global Pregnancy Detection Kits Industry Volume K Tons Forecast, by Country 2019 & 2032
- Table 85: Germany Pregnancy Detection Kits Industry Revenue (Million) Forecast, by Application 2019 & 2032
- Table 86: Germany Pregnancy Detection Kits Industry Volume (K Tons) Forecast, by Application 2019 & 2032
- Table 87: United Kingdom Pregnancy Detection Kits Industry Revenue (Million) Forecast, by Application 2019 & 2032
- Table 88: United Kingdom Pregnancy Detection Kits Industry Volume (K Tons) Forecast, by Application 2019 & 2032
- Table 89: France Pregnancy Detection Kits Industry Revenue (Million) Forecast, by Application 2019 & 2032
- Table 90: France Pregnancy Detection Kits Industry Volume (K Tons) Forecast, by Application 2019 & 2032
- Table 91: Italy Pregnancy Detection Kits Industry Revenue (Million) Forecast, by Application 2019 & 2032
- Table 92: Italy Pregnancy Detection Kits Industry Volume (K Tons) Forecast, by Application 2019 & 2032
- Table 93: Spain Pregnancy Detection Kits Industry Revenue (Million) Forecast, by Application 2019 & 2032
- Table 94: Spain Pregnancy Detection Kits Industry Volume (K Tons) Forecast, by Application 2019 & 2032
- Table 95: Rest of Europe Pregnancy Detection Kits Industry Revenue (Million) Forecast, by Application 2019 & 2032
- Table 96: Rest of Europe Pregnancy Detection Kits Industry Volume (K Tons) Forecast, by Application 2019 & 2032
- Table 97: Global Pregnancy Detection Kits Industry Revenue Million Forecast, by Product Type 2019 & 2032
- Table 98: Global Pregnancy Detection Kits Industry Volume K Tons Forecast, by Product Type 2019 & 2032
- Table 99: Global Pregnancy Detection Kits Industry Revenue Million Forecast, by Type of Test 2019 & 2032
- Table 100: Global Pregnancy Detection Kits Industry Volume K Tons Forecast, by Type of Test 2019 & 2032
- Table 101: Global Pregnancy Detection Kits Industry Revenue Million Forecast, by Distribution Channel 2019 & 2032
- Table 102: Global Pregnancy Detection Kits Industry Volume K Tons Forecast, by Distribution Channel 2019 & 2032
- Table 103: Global Pregnancy Detection Kits Industry Revenue Million Forecast, by Country 2019 & 2032
- Table 104: Global Pregnancy Detection Kits Industry Volume K Tons Forecast, by Country 2019 & 2032
- Table 105: China Pregnancy Detection Kits Industry Revenue (Million) Forecast, by Application 2019 & 2032
- Table 106: China Pregnancy Detection Kits Industry Volume (K Tons) Forecast, by Application 2019 & 2032
- Table 107: Japan Pregnancy Detection Kits Industry Revenue (Million) Forecast, by Application 2019 & 2032
- Table 108: Japan Pregnancy Detection Kits Industry Volume (K Tons) Forecast, by Application 2019 & 2032
- Table 109: India Pregnancy Detection Kits Industry Revenue (Million) Forecast, by Application 2019 & 2032
- Table 110: India Pregnancy Detection Kits Industry Volume (K Tons) Forecast, by Application 2019 & 2032
- Table 111: Australia Pregnancy Detection Kits Industry Revenue (Million) Forecast, by Application 2019 & 2032
- Table 112: Australia Pregnancy Detection Kits Industry Volume (K Tons) Forecast, by Application 2019 & 2032
- Table 113: South Korea Pregnancy Detection Kits Industry Revenue (Million) Forecast, by Application 2019 & 2032
- Table 114: South Korea Pregnancy Detection Kits Industry Volume (K Tons) Forecast, by Application 2019 & 2032
- Table 115: Rest of Asia Pacific Pregnancy Detection Kits Industry Revenue (Million) Forecast, by Application 2019 & 2032
- Table 116: Rest of Asia Pacific Pregnancy Detection Kits Industry Volume (K Tons) Forecast, by Application 2019 & 2032
- Table 117: Global Pregnancy Detection Kits Industry Revenue Million Forecast, by Product Type 2019 & 2032
- Table 118: Global Pregnancy Detection Kits Industry Volume K Tons Forecast, by Product Type 2019 & 2032
- Table 119: Global Pregnancy Detection Kits Industry Revenue Million Forecast, by Type of Test 2019 & 2032
- Table 120: Global Pregnancy Detection Kits Industry Volume K Tons Forecast, by Type of Test 2019 & 2032
- Table 121: Global Pregnancy Detection Kits Industry Revenue Million Forecast, by Distribution Channel 2019 & 2032
- Table 122: Global Pregnancy Detection Kits Industry Volume K Tons Forecast, by Distribution Channel 2019 & 2032
- Table 123: Global Pregnancy Detection Kits Industry Revenue Million Forecast, by Country 2019 & 2032
- Table 124: Global Pregnancy Detection Kits Industry Volume K Tons Forecast, by Country 2019 & 2032
- Table 125: GCC Pregnancy Detection Kits Industry Revenue (Million) Forecast, by Application 2019 & 2032
- Table 126: GCC Pregnancy Detection Kits Industry Volume (K Tons) Forecast, by Application 2019 & 2032
- Table 127: South Africa Pregnancy Detection Kits Industry Revenue (Million) Forecast, by Application 2019 & 2032
- Table 128: South Africa Pregnancy Detection Kits Industry Volume (K Tons) Forecast, by Application 2019 & 2032
- Table 129: Rest of Middle East and Africa Pregnancy Detection Kits Industry Revenue (Million) Forecast, by Application 2019 & 2032
- Table 130: Rest of Middle East and Africa Pregnancy Detection Kits Industry Volume (K Tons) Forecast, by Application 2019 & 2032
- Table 131: Global Pregnancy Detection Kits Industry Revenue Million Forecast, by Product Type 2019 & 2032
- Table 132: Global Pregnancy Detection Kits Industry Volume K Tons Forecast, by Product Type 2019 & 2032
- Table 133: Global Pregnancy Detection Kits Industry Revenue Million Forecast, by Type of Test 2019 & 2032
- Table 134: Global Pregnancy Detection Kits Industry Volume K Tons Forecast, by Type of Test 2019 & 2032
- Table 135: Global Pregnancy Detection Kits Industry Revenue Million Forecast, by Distribution Channel 2019 & 2032
- Table 136: Global Pregnancy Detection Kits Industry Volume K Tons Forecast, by Distribution Channel 2019 & 2032
- Table 137: Global Pregnancy Detection Kits Industry Revenue Million Forecast, by Country 2019 & 2032
- Table 138: Global Pregnancy Detection Kits Industry Volume K Tons Forecast, by Country 2019 & 2032
- Table 139: Brazil Pregnancy Detection Kits Industry Revenue (Million) Forecast, by Application 2019 & 2032
- Table 140: Brazil Pregnancy Detection Kits Industry Volume (K Tons) Forecast, by Application 2019 & 2032
- Table 141: Argentina Pregnancy Detection Kits Industry Revenue (Million) Forecast, by Application 2019 & 2032
- Table 142: Argentina Pregnancy Detection Kits Industry Volume (K Tons) Forecast, by Application 2019 & 2032
- Table 143: Rest of South America Pregnancy Detection Kits Industry Revenue (Million) Forecast, by Application 2019 & 2032
- Table 144: Rest of South America Pregnancy Detection Kits Industry Volume (K Tons) Forecast, by Application 2019 & 2032
Frequently Asked Questions
1. What is the projected Compound Annual Growth Rate (CAGR) of the Pregnancy Detection Kits Industry?
The projected CAGR is approximately 4.51%.
2. Which companies are prominent players in the Pregnancy Detection Kits Industry?
Key companies in the market include Quidel Corporation, Piramal Enterprises Ltd, Procter & Gamble Co, SPD Swiss Precision Diagnostics*List Not Exhaustive, BioMerieux SA, Abbott Laboratories, Cardinal Health Inc, Axis Medicare, Mankind Pharma, Germaine Laboratories Inc, Church & Dwight Co Inc.
3. What are the main segments of the Pregnancy Detection Kits Industry?
The market segments include Product Type, Type of Test, Distribution Channel.
4. Can you provide details about the market size?
The market size is estimated to be USD 1.18 Million as of 2022.
5. What are some drivers contributing to market growth?
Increase in Unplanned Pregnancies; Rise in Disposable Income; Changing Lifestyles and Growing Women Literacy Rate.
6. What are the notable trends driving market growth?
Blood test for HCG Segment is Expected to Witness Growth Over the Forecast Period.
7. Are there any restraints impacting market growth?
Lack of Availability and Awareness in Low Income Countries.
8. Can you provide examples of recent developments in the market?
In April 2022, Mankind Pharma launched a new and advanced pregnancy detection test kit for the Indian market, Prega News Advanced. The product has a single-step pregnancy test device that does not require the collection of urine in a dropper or a container, thereby making it the easiest and most convenient method to test pregnancy at home.
9. What pricing options are available for accessing the report?
Pricing options include single-user, multi-user, and enterprise licenses priced at USD 4750, USD 5250, and USD 8750 respectively.
10. Is the market size provided in terms of value or volume?
The market size is provided in terms of value, measured in Million and volume, measured in K Tons.
11. Are there any specific market keywords associated with the report?
Yes, the market keyword associated with the report is "Pregnancy Detection Kits Industry," which aids in identifying and referencing the specific market segment covered.
12. How do I determine which pricing option suits my needs best?
The pricing options vary based on user requirements and access needs. Individual users may opt for single-user licenses, while businesses requiring broader access may choose multi-user or enterprise licenses for cost-effective access to the report.
13. Are there any additional resources or data provided in the Pregnancy Detection Kits Industry report?
While the report offers comprehensive insights, it's advisable to review the specific contents or supplementary materials provided to ascertain if additional resources or data are available.
14. How can I stay updated on further developments or reports in the Pregnancy Detection Kits Industry?
To stay informed about further developments, trends, and reports in the Pregnancy Detection Kits Industry, consider subscribing to industry newsletters, following relevant companies and organizations, or regularly checking reputable industry news sources and publications.
Methodology
Step 1 - Identification of Relevant Samples Size from Population Database


Step 2 - Approaches for Defining Global Market Size (Value, Volume* & Price*)

Note*: In applicable scenarios
Step 3 - Data Sources
Primary Research
- Web Analytics
- Survey Reports
- Research Institute
- Latest Research Reports
- Opinion Leaders
Secondary Research
- Annual Reports
- White Paper
- Latest Press Release
- Industry Association
- Paid Database
- Investor Presentations

Step 4 - Data Triangulation
Involves using different sources of information in order to increase the validity of a study
These sources are likely to be stakeholders in a program - participants, other researchers, program staff, other community members, and so on.
Then we put all data in single framework & apply various statistical tools to find out the dynamic on the market.
During the analysis stage, feedback from the stakeholder groups would be compared to determine areas of agreement as well as areas of divergence


