

Key Insights
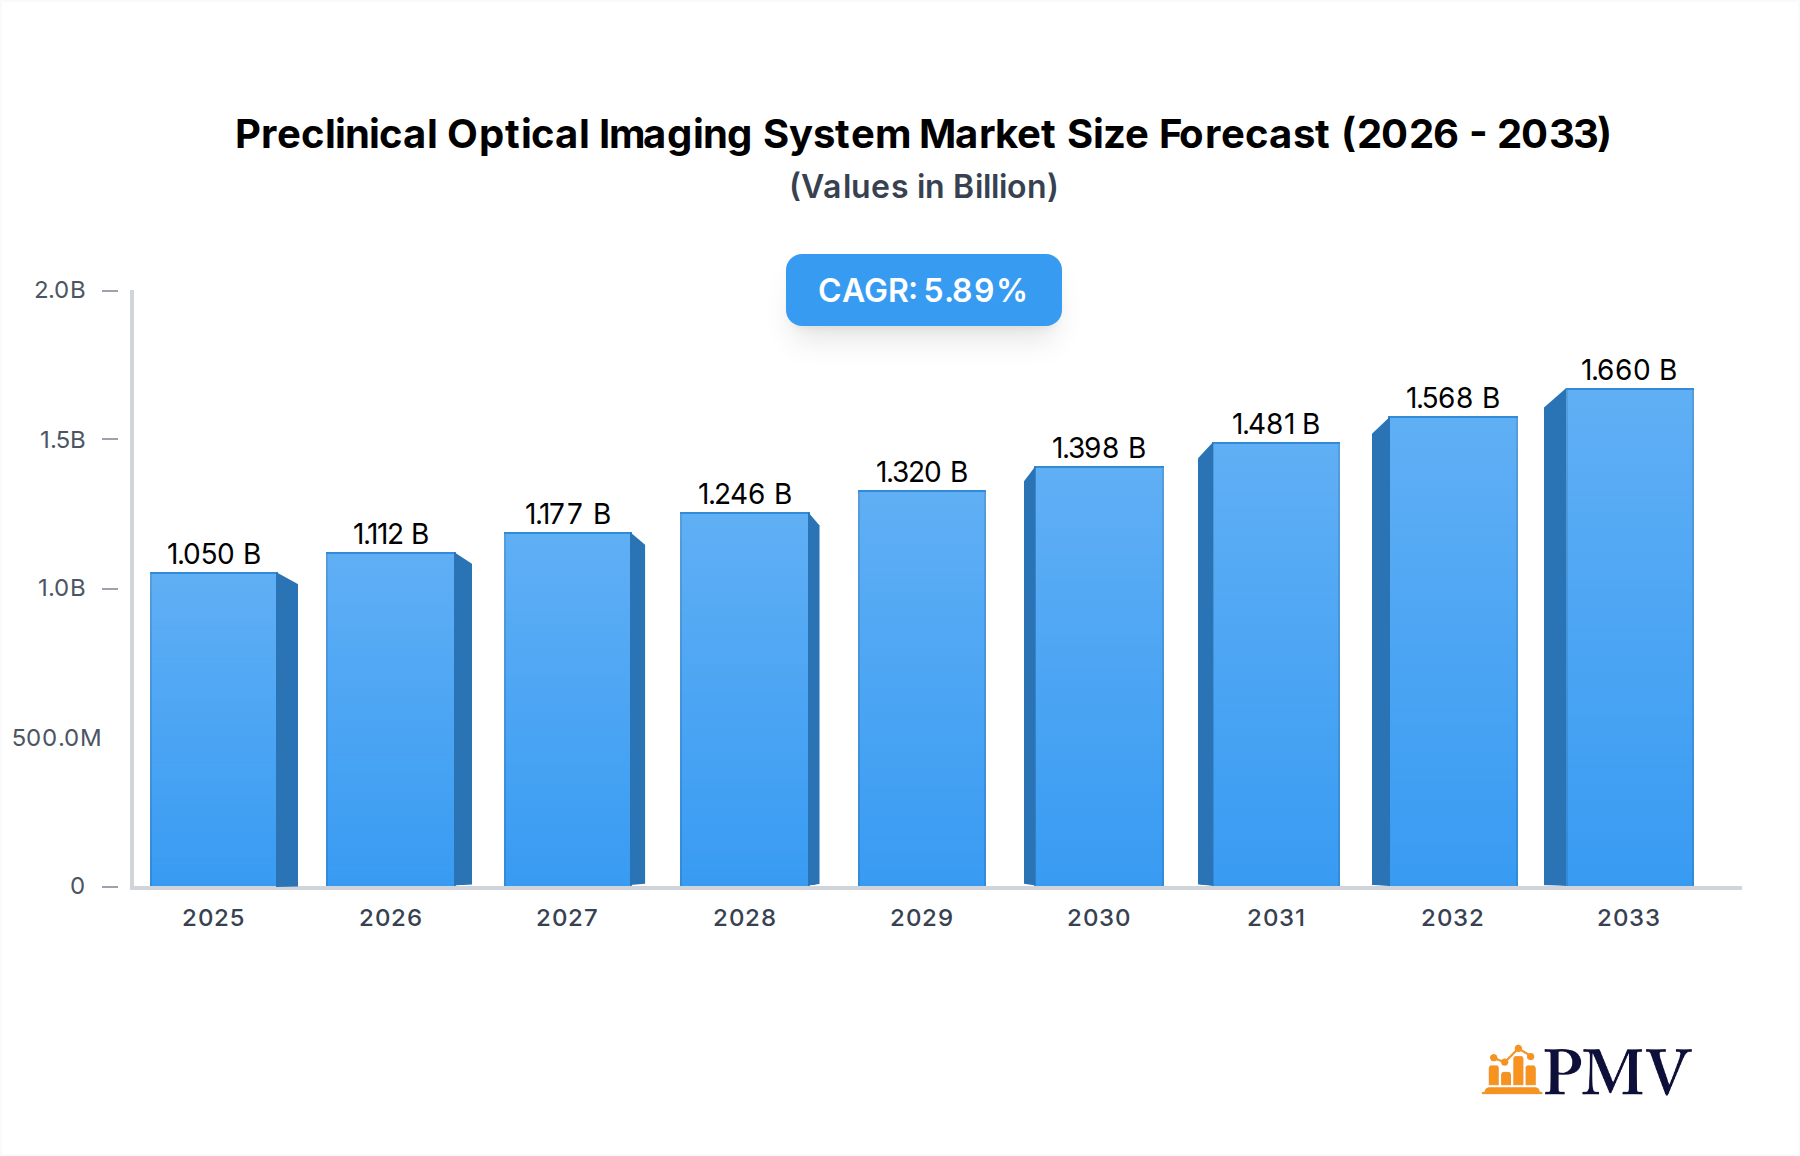
The preclinical optical imaging system market is poised for significant expansion, projected to reach approximately USD 1.05 billion in 2025. This growth is fueled by an anticipated Compound Annual Growth Rate (CAGR) of 5.6% from 2019 to 2033, indicating a robust and sustained upward trajectory. The primary drivers for this market's ascent include the increasing demand for advanced imaging solutions in pharmaceutical and biotechnology research, a growing emphasis on non-invasive diagnostic and therapeutic monitoring techniques, and the continuous innovation in imaging technologies offering higher resolution and sensitivity. Furthermore, the escalating investment in drug discovery and development, particularly in areas like oncology, neurology, and infectious diseases, directly correlates with the need for sophisticated preclinical imaging tools to validate drug efficacy and safety. The expanding scope of applications in academic research for understanding disease mechanisms and evaluating novel treatment strategies also contributes substantially to market expansion.

Preclinical Optical Imaging System Market Size (In Billion)
The market is segmented into key application areas, with Pharma and Biotech Companies and Research Institutes dominating the demand landscape due to their intensive R&D activities. The "Others" segment, encompassing contract research organizations and government research facilities, also presents growth opportunities. In terms of technology types, Fluorescence and Bioluminescence imaging are the leading segments, offering versatile capabilities for studying biological processes in vivo. Emerging trends include the integration of artificial intelligence (AI) and machine learning (ML) for enhanced image analysis and interpretation, as well as the development of multi-modal imaging systems combining optical techniques with other modalities. Restraints, such as the high initial cost of advanced systems and the need for skilled personnel, are being gradually addressed through technological advancements and the availability of service-based models. Key players like Bruker Corporation, PerkinElmer, Inc., and Fujifilm Holdings Corporation are instrumental in shaping the market through continuous product development and strategic collaborations.
Preclinical Optical Imaging System Company Market Share
This detailed report offers an in-depth analysis of the global Preclinical Optical Imaging System market, encompassing a study period from 2019 to 2033, with a base year and estimated year of 2025, and a forecast period from 2025 to 2033. It delves into market structure, competitive dynamics, industry trends, key segments, product innovations, growth drivers, challenges, and strategic outlook. This report is essential for stakeholders seeking actionable insights and high-level market understanding.
Preclinical Optical Imaging System Market Structure & Competitive Dynamics
The preclinical optical imaging system market exhibits a moderate to high level of concentration, driven by a few key players. Innovation ecosystems are vibrant, with significant R&D investments focusing on enhanced sensitivity, resolution, and multiplexing capabilities. Regulatory frameworks, particularly those governing animal research and data integrity, play a crucial role in shaping market entry and product development. Product substitutes, such as MRI and PET imaging, exist but are often complementary rather than direct replacements due to the unique advantages of optical techniques. End-user trends indicate a growing demand for non-invasive imaging solutions in drug discovery and development, personalized medicine, and basic research. Mergers and acquisitions (M&A) activities are strategically important, with deal values in the hundreds of billions, aiming to consolidate market share, acquire novel technologies, and expand geographical reach. For instance, acquisitions of promising startups with proprietary optical probe technologies or advanced imaging platforms are common. The competitive landscape is characterized by a blend of established conglomerates and specialized innovators, each vying for market dominance through technological differentiation and strategic partnerships. Market share is meticulously tracked, with leading companies holding substantial portions of the multi-billion dollar market.
Preclinical Optical Imaging System Industry Trends & Insights
The global preclinical optical imaging system market is poised for substantial growth, projected to achieve a Compound Annual Growth Rate (CAGR) of approximately 9.7 billion across the forecast period. This expansion is primarily fueled by escalating investments in pharmaceutical R&D, particularly in oncology, neuroscience, and infectious diseases, where optical imaging offers unparalleled insight into biological processes at the cellular and molecular level. Technological advancements are a significant disruptor, with the emergence of highly sensitive detectors, advanced fluorescent probes, and multimodal imaging solutions enhancing diagnostic accuracy and therapeutic monitoring. The demand for in vivo imaging systems that provide real-time visualization of disease progression and drug efficacy is surging. Consumer preferences, particularly within the pharma and biotech sectors, are shifting towards systems that offer higher throughput, reduced animal usage through improved precision, and integrated data analysis capabilities. This has led to a greater market penetration of sophisticated fluorescence and bioluminescence imaging systems. Competitive dynamics are intensifying, with companies continuously innovating to offer more comprehensive solutions, including software for advanced image analysis and quantification. The market penetration of advanced optical imaging techniques is growing across research institutes and academic centers, complementing the established dominance in the pharmaceutical industry. The overall market size is projected to reach several hundred billion by the end of the forecast period, reflecting sustained demand and technological progress.
Dominant Markets & Segments in Preclinical Optical Imaging System
The Pharma and Biotech Companies segment is the undisputed leader in the preclinical optical imaging system market, commanding a substantial market share worth hundreds of billions. This dominance is driven by the critical role of these systems in every stage of drug discovery and development, from target validation and lead optimization to preclinical efficacy and safety studies. Key drivers for this segment's supremacy include:
- Significant R&D Budgets: Pharmaceutical and biotechnology firms allocate billions annually to R&D, with a considerable portion dedicated to advanced preclinical research tools like optical imaging systems.
- Regulatory Mandates for Efficacy and Safety: Stringent regulatory requirements from bodies like the FDA and EMA necessitate comprehensive preclinical testing, where optical imaging provides crucial data.
- Demand for Precision Medicine: The push towards personalized therapies requires detailed understanding of disease mechanisms at the molecular level, a capability well-suited for optical imaging.
- Technological Sophistication: The availability of advanced optical imaging systems with high resolution and sensitivity directly addresses the complex research needs of these companies.
Within the Types segmentation, Fluorescence imaging systems represent the largest and fastest-growing category, valued in the hundreds of billions. This is due to the broad applicability of fluorescent probes for visualizing a wide range of biological targets and processes, offering excellent signal-to-noise ratios and diverse labeling options. Bioluminescence imaging, while also significant, is often utilized for specific applications requiring high sensitivity in deep tissues where autofluorescence is less of a concern. The dominance of fluorescence is further cemented by continuous innovation in fluorescent dye chemistry and imaging hardware. Geographically, North America and Europe lead the market, driven by well-established research infrastructure, significant government funding for life sciences, and a strong presence of leading pharmaceutical and biotech companies. Asia Pacific, however, is emerging as a rapidly growing region, propelled by increasing R&D investments and a burgeoning biotech industry.
Preclinical Optical Imaging System Product Innovations
Product innovations in preclinical optical imaging systems are primarily focused on enhancing sensitivity, spatial resolution, and temporal imaging capabilities. Advancements include the development of novel, highly multiplexed fluorescent probes for simultaneous visualization of multiple biological targets, and sophisticated detector technologies that reduce noise and increase signal acquisition speed. Furthermore, the integration of artificial intelligence (AI) for automated image analysis and data interpretation is a significant trend, allowing researchers to extract deeper insights from imaging studies. Companies are also developing smaller, more cost-effective benchtop systems alongside high-performance multimodal systems that combine optical imaging with other modalities like PET or MRI, offering a more comprehensive understanding of biological processes. These innovations directly address the growing need for faster, more accurate, and more informative preclinical research.
Report Segmentation & Scope
This report segments the Preclinical Optical Imaging System market by Application and Type. The Application segment is further divided into Pharma and Biotech Companies, Research Institutes, and Others. The Pharma and Biotech Companies segment is projected to dominate, with a market size in the hundreds of billions, due to extensive R&D activities. Research Institutes follow, contributing billions to the market, driven by academic research and government grants. The Types segment includes Fluorescence, Bioluminescence, and Others. Fluorescence imaging is expected to lead, with a market size in the hundreds of billions, owing to its versatility and advancements in probes. Bioluminescence imaging holds a significant market share in the billions, favored for its high sensitivity in specific applications.
Key Drivers of Preclinical Optical Imaging System Growth
The growth of the preclinical optical imaging system market is propelled by several key factors. The escalating R&D expenditures by pharmaceutical and biotechnology companies, amounting to hundreds of billions globally, is a primary driver, as these systems are indispensable for drug discovery and development. Technological advancements, including the development of more sensitive detectors and novel fluorescent probes, are continuously expanding the capabilities of optical imaging, making it more attractive for researchers. Furthermore, the increasing prevalence of chronic diseases and the growing demand for targeted therapies necessitate advanced in vivo imaging solutions. Regulatory bodies' emphasis on the efficacy and safety of new drugs also fuels the demand for reliable preclinical imaging data. Economic policies that support life sciences research, coupled with the expansion of research infrastructure in emerging economies, further contribute to market expansion, projected to be in the billions.
Challenges in the Preclinical Optical Imaging System Sector
Despite robust growth, the preclinical optical imaging system sector faces several challenges that could impede its full potential. High initial investment costs for advanced imaging systems, often in the millions, can be a barrier for smaller research institutions and companies. Stringent regulatory approvals for new imaging agents and probes can lead to lengthy development timelines and increased R&D expenses. Competition from alternative imaging modalities like PET and MRI, while often complementary, can also pose a challenge in certain applications, especially for deeper tissue imaging where optical penetration is limited. Furthermore, the need for skilled personnel to operate and interpret data from complex imaging systems can be a bottleneck, impacting the widespread adoption of these technologies, with training and support costs contributing to the operational expenditure in the billions.
Leading Players in the Preclinical Optical Imaging System Market
- Bruker Corporation
- Perkin Elmer, Inc.
- MR Solutions
- BioTek Instruments, Inc.
- Milabs B.V.
- Fujifilm Holdings Corporation
- Magnetic Insight, Inc.
- MBF Bioscience
- Mediso Ltd.
Key Developments in Preclinical Optical Imaging System Sector
- 2023 October: Launch of a next-generation high-resolution fluorescence imaging system by PerkinElmer, Inc., offering enhanced sensitivity for molecular imaging studies.
- 2023 September: Bruker Corporation announces a strategic partnership with a leading AI company to integrate advanced image analysis software into their optical imaging platforms, enhancing data interpretation capabilities.
- 2023 July: MR Solutions unveils a novel multimodal preclinical imaging system combining optical and MRI capabilities, providing comprehensive anatomical and functional insights.
- 2023 March: Fujifilm Holdings Corporation expands its preclinical imaging portfolio with the acquisition of a specialized bioluminescence imaging technology company, strengthening its offerings in molecular diagnostics.
- 2022 December: Magnetic Insight, Inc. receives regulatory clearance for a new fluorescence imaging probe targeting neurodegenerative diseases, paving the way for novel therapeutic development.
Strategic Preclinical Optical Imaging System Market Outlook
The strategic outlook for the preclinical optical imaging system market remains highly optimistic, with continued innovation and increasing demand driving expansion. Future growth accelerators will focus on developing even higher-throughput systems, integrating AI for predictive analytics in drug development, and creating more targeted and responsive optical probes for early disease detection. The trend towards multimodal imaging will intensify, offering researchers a more holistic view of biological processes. Furthermore, the expanding research infrastructure and growing R&D investments in emerging markets present significant opportunities for market players. Strategic collaborations, mergers, and acquisitions will continue to shape the competitive landscape, allowing companies to leverage each other’s strengths and address unmet market needs, collectively driving the market's value into the hundreds of billions.
Preclinical Optical Imaging System Segmentation
-
1. Application
- 1.1. Pharma and Biotech Companies
- 1.2. Research Institutes
- 1.3. Others
-
2. Types
- 2.1. Fluorescence
- 2.2. Bioluminescence
- 2.3. Others
Preclinical Optical Imaging System Segmentation By Geography
-
1. North America
- 1.1. United States
- 1.2. Canada
- 1.3. Mexico
-
2. South America
- 2.1. Brazil
- 2.2. Argentina
- 2.3. Rest of South America
-
3. Europe
- 3.1. United Kingdom
- 3.2. Germany
- 3.3. France
- 3.4. Italy
- 3.5. Spain
- 3.6. Russia
- 3.7. Benelux
- 3.8. Nordics
- 3.9. Rest of Europe
-
4. Middle East & Africa
- 4.1. Turkey
- 4.2. Israel
- 4.3. GCC
- 4.4. North Africa
- 4.5. South Africa
- 4.6. Rest of Middle East & Africa
-
5. Asia Pacific
- 5.1. China
- 5.2. India
- 5.3. Japan
- 5.4. South Korea
- 5.5. ASEAN
- 5.6. Oceania
- 5.7. Rest of Asia Pacific
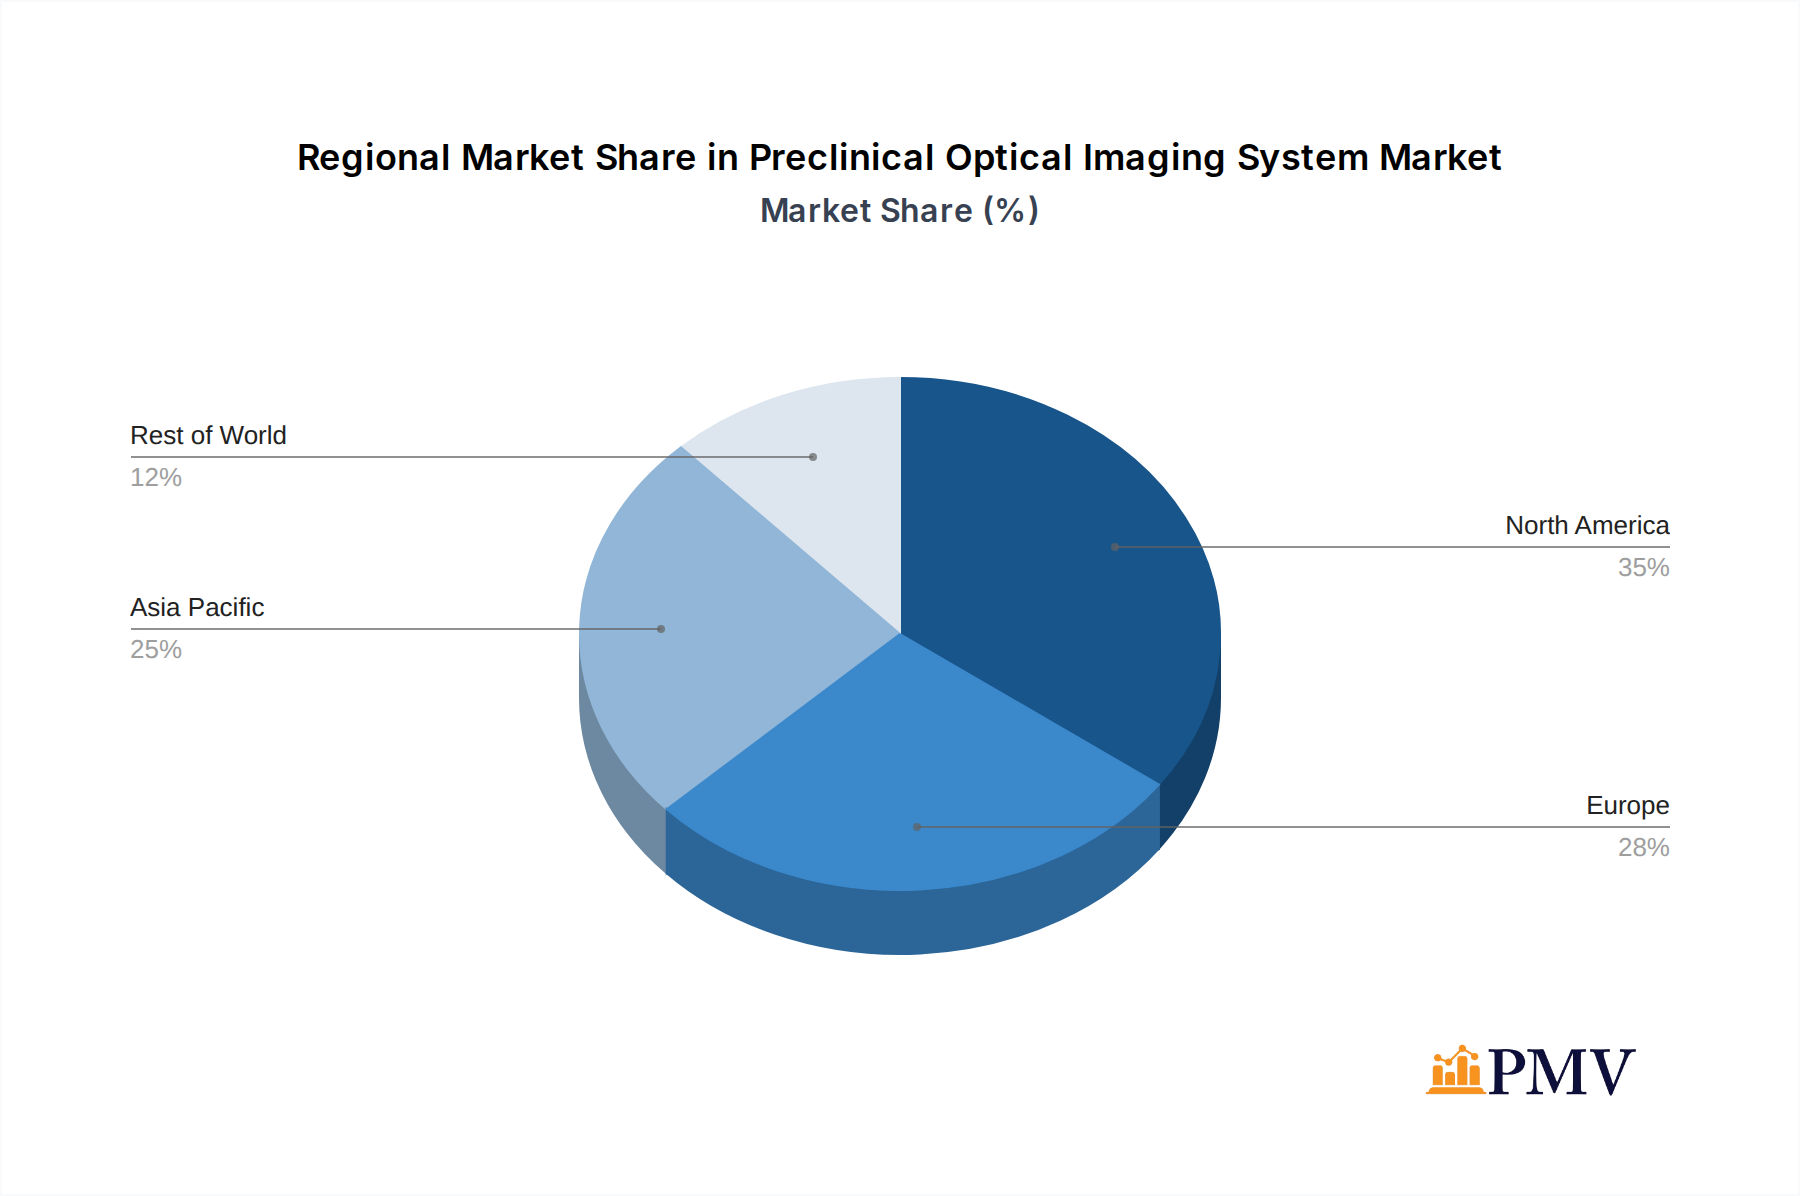
Preclinical Optical Imaging System Regional Market Share
Geographic Coverage of Preclinical Optical Imaging System
Preclinical Optical Imaging System REPORT HIGHLIGHTS
| Aspects | Details |
|---|---|
| Study Period | 2020-2034 |
| Base Year | 2025 |
| Estimated Year | 2026 |
| Forecast Period | 2026-2034 |
| Historical Period | 2020-2025 |
| Growth Rate | CAGR of 5.6% from 2020-2034 |
| Segmentation |
|
Table of Contents
- 1. Introduction
- 1.1. Research Scope
- 1.2. Market Segmentation
- 1.3. Research Objective
- 1.4. Definitions and Assumptions
- 2. Executive Summary
- 2.1. Market Snapshot
- 3. Market Dynamics
- 3.1. Market Drivers
- 3.2. Market Restrains
- 3.3. Market Trends
- 3.4. Market Opportunities
- 4. Market Factor Analysis
- 4.1. Porters Five Forces
- 4.1.1. Bargaining Power of Suppliers
- 4.1.2. Bargaining Power of Buyers
- 4.1.3. Threat of New Entrants
- 4.1.4. Threat of Substitutes
- 4.1.5. Competitive Rivalry
- 4.2. PESTEL analysis
- 4.3. BCG Analysis
- 4.3.1. Stars (High Growth, High Market Share)
- 4.3.2. Cash Cows (Low Growth, High Market Share)
- 4.3.3. Question Mark (High Growth, Low Market Share)
- 4.3.4. Dogs (Low Growth, Low Market Share)
- 4.4. Ansoff Matrix Analysis
- 4.5. Supply Chain Analysis
- 4.6. Regulatory Landscape
- 4.7. Current Market Potential and Opportunity Assessment (TAM–SAM–SOM Framework)
- 4.8. PMV Analyst Note
- 4.1. Porters Five Forces
- 5. Market Analysis, Insights and Forecast 2021-2033
- 5.1. Market Analysis, Insights and Forecast - by Application
- 5.1.1. Pharma and Biotech Companies
- 5.1.2. Research Institutes
- 5.1.3. Others
- 5.2. Market Analysis, Insights and Forecast - by Types
- 5.2.1. Fluorescence
- 5.2.2. Bioluminescence
- 5.2.3. Others
- 5.3. Market Analysis, Insights and Forecast - by Region
- 5.3.1. North America
- 5.3.2. South America
- 5.3.3. Europe
- 5.3.4. Middle East & Africa
- 5.3.5. Asia Pacific
- 5.1. Market Analysis, Insights and Forecast - by Application
- 6. Global Preclinical Optical Imaging System Analysis, Insights and Forecast, 2021-2033
- 6.1. Market Analysis, Insights and Forecast - by Application
- 6.1.1. Pharma and Biotech Companies
- 6.1.2. Research Institutes
- 6.1.3. Others
- 6.2. Market Analysis, Insights and Forecast - by Types
- 6.2.1. Fluorescence
- 6.2.2. Bioluminescence
- 6.2.3. Others
- 6.1. Market Analysis, Insights and Forecast - by Application
- 7. North America Preclinical Optical Imaging System Analysis, Insights and Forecast, 2020-2032
- 7.1. Market Analysis, Insights and Forecast - by Application
- 7.1.1. Pharma and Biotech Companies
- 7.1.2. Research Institutes
- 7.1.3. Others
- 7.2. Market Analysis, Insights and Forecast - by Types
- 7.2.1. Fluorescence
- 7.2.2. Bioluminescence
- 7.2.3. Others
- 7.1. Market Analysis, Insights and Forecast - by Application
- 8. South America Preclinical Optical Imaging System Analysis, Insights and Forecast, 2020-2032
- 8.1. Market Analysis, Insights and Forecast - by Application
- 8.1.1. Pharma and Biotech Companies
- 8.1.2. Research Institutes
- 8.1.3. Others
- 8.2. Market Analysis, Insights and Forecast - by Types
- 8.2.1. Fluorescence
- 8.2.2. Bioluminescence
- 8.2.3. Others
- 8.1. Market Analysis, Insights and Forecast - by Application
- 9. Europe Preclinical Optical Imaging System Analysis, Insights and Forecast, 2020-2032
- 9.1. Market Analysis, Insights and Forecast - by Application
- 9.1.1. Pharma and Biotech Companies
- 9.1.2. Research Institutes
- 9.1.3. Others
- 9.2. Market Analysis, Insights and Forecast - by Types
- 9.2.1. Fluorescence
- 9.2.2. Bioluminescence
- 9.2.3. Others
- 9.1. Market Analysis, Insights and Forecast - by Application
- 10. Middle East & Africa Preclinical Optical Imaging System Analysis, Insights and Forecast, 2020-2032
- 10.1. Market Analysis, Insights and Forecast - by Application
- 10.1.1. Pharma and Biotech Companies
- 10.1.2. Research Institutes
- 10.1.3. Others
- 10.2. Market Analysis, Insights and Forecast - by Types
- 10.2.1. Fluorescence
- 10.2.2. Bioluminescence
- 10.2.3. Others
- 10.1. Market Analysis, Insights and Forecast - by Application
- 11. Asia Pacific Preclinical Optical Imaging System Analysis, Insights and Forecast, 2020-2032
- 11.1. Market Analysis, Insights and Forecast - by Application
- 11.1.1. Pharma and Biotech Companies
- 11.1.2. Research Institutes
- 11.1.3. Others
- 11.2. Market Analysis, Insights and Forecast - by Types
- 11.2.1. Fluorescence
- 11.2.2. Bioluminescence
- 11.2.3. Others
- 11.1. Market Analysis, Insights and Forecast - by Application
- 12. Competitive Analysis
- 12.1. Company Profiles
- 12.1.1 Bruker Corporation
- 12.1.1.1. Company Overview
- 12.1.1.2. Products
- 12.1.1.3. Company Financials
- 12.1.1.4. SWOT Analysis
- 12.1.2 Perkin Elmer
- 12.1.2.1. Company Overview
- 12.1.2.2. Products
- 12.1.2.3. Company Financials
- 12.1.2.4. SWOT Analysis
- 12.1.3 Inc.
- 12.1.3.1. Company Overview
- 12.1.3.2. Products
- 12.1.3.3. Company Financials
- 12.1.3.4. SWOT Analysis
- 12.1.4 MR Solutions
- 12.1.4.1. Company Overview
- 12.1.4.2. Products
- 12.1.4.3. Company Financials
- 12.1.4.4. SWOT Analysis
- 12.1.5 BioTek Instruments
- 12.1.5.1. Company Overview
- 12.1.5.2. Products
- 12.1.5.3. Company Financials
- 12.1.5.4. SWOT Analysis
- 12.1.6 Inc.
- 12.1.6.1. Company Overview
- 12.1.6.2. Products
- 12.1.6.3. Company Financials
- 12.1.6.4. SWOT Analysis
- 12.1.7 Milabs B.V.
- 12.1.7.1. Company Overview
- 12.1.7.2. Products
- 12.1.7.3. Company Financials
- 12.1.7.4. SWOT Analysis
- 12.1.8 Fujifilm Holdings Corporation
- 12.1.8.1. Company Overview
- 12.1.8.2. Products
- 12.1.8.3. Company Financials
- 12.1.8.4. SWOT Analysis
- 12.1.9 Magnetic Insight
- 12.1.9.1. Company Overview
- 12.1.9.2. Products
- 12.1.9.3. Company Financials
- 12.1.9.4. SWOT Analysis
- 12.1.10 Inc.
- 12.1.10.1. Company Overview
- 12.1.10.2. Products
- 12.1.10.3. Company Financials
- 12.1.10.4. SWOT Analysis
- 12.1.11 MBF Bioscience
- 12.1.11.1. Company Overview
- 12.1.11.2. Products
- 12.1.11.3. Company Financials
- 12.1.11.4. SWOT Analysis
- 12.1.12 Mediso Ltd.
- 12.1.12.1. Company Overview
- 12.1.12.2. Products
- 12.1.12.3. Company Financials
- 12.1.12.4. SWOT Analysis
- 12.1.1 Bruker Corporation
- 12.2. Market Entropy
- 12.2.1 Company's Key Areas Served
- 12.2.2 Recent Developments
- 12.3. Company Market Share Analysis 2025
- 12.3.1 Top 5 Companies Market Share Analysis
- 12.3.2 Top 3 Companies Market Share Analysis
- 12.4. List of Potential Customers
- 13. Research Methodology
List of Figures
- Figure 1: Global Preclinical Optical Imaging System Revenue Breakdown (billion, %) by Region 2025 & 2033
- Figure 2: North America Preclinical Optical Imaging System Revenue (billion), by Application 2025 & 2033
- Figure 3: North America Preclinical Optical Imaging System Revenue Share (%), by Application 2025 & 2033
- Figure 4: North America Preclinical Optical Imaging System Revenue (billion), by Types 2025 & 2033
- Figure 5: North America Preclinical Optical Imaging System Revenue Share (%), by Types 2025 & 2033
- Figure 6: North America Preclinical Optical Imaging System Revenue (billion), by Country 2025 & 2033
- Figure 7: North America Preclinical Optical Imaging System Revenue Share (%), by Country 2025 & 2033
- Figure 8: South America Preclinical Optical Imaging System Revenue (billion), by Application 2025 & 2033
- Figure 9: South America Preclinical Optical Imaging System Revenue Share (%), by Application 2025 & 2033
- Figure 10: South America Preclinical Optical Imaging System Revenue (billion), by Types 2025 & 2033
- Figure 11: South America Preclinical Optical Imaging System Revenue Share (%), by Types 2025 & 2033
- Figure 12: South America Preclinical Optical Imaging System Revenue (billion), by Country 2025 & 2033
- Figure 13: South America Preclinical Optical Imaging System Revenue Share (%), by Country 2025 & 2033
- Figure 14: Europe Preclinical Optical Imaging System Revenue (billion), by Application 2025 & 2033
- Figure 15: Europe Preclinical Optical Imaging System Revenue Share (%), by Application 2025 & 2033
- Figure 16: Europe Preclinical Optical Imaging System Revenue (billion), by Types 2025 & 2033
- Figure 17: Europe Preclinical Optical Imaging System Revenue Share (%), by Types 2025 & 2033
- Figure 18: Europe Preclinical Optical Imaging System Revenue (billion), by Country 2025 & 2033
- Figure 19: Europe Preclinical Optical Imaging System Revenue Share (%), by Country 2025 & 2033
- Figure 20: Middle East & Africa Preclinical Optical Imaging System Revenue (billion), by Application 2025 & 2033
- Figure 21: Middle East & Africa Preclinical Optical Imaging System Revenue Share (%), by Application 2025 & 2033
- Figure 22: Middle East & Africa Preclinical Optical Imaging System Revenue (billion), by Types 2025 & 2033
- Figure 23: Middle East & Africa Preclinical Optical Imaging System Revenue Share (%), by Types 2025 & 2033
- Figure 24: Middle East & Africa Preclinical Optical Imaging System Revenue (billion), by Country 2025 & 2033
- Figure 25: Middle East & Africa Preclinical Optical Imaging System Revenue Share (%), by Country 2025 & 2033
- Figure 26: Asia Pacific Preclinical Optical Imaging System Revenue (billion), by Application 2025 & 2033
- Figure 27: Asia Pacific Preclinical Optical Imaging System Revenue Share (%), by Application 2025 & 2033
- Figure 28: Asia Pacific Preclinical Optical Imaging System Revenue (billion), by Types 2025 & 2033
- Figure 29: Asia Pacific Preclinical Optical Imaging System Revenue Share (%), by Types 2025 & 2033
- Figure 30: Asia Pacific Preclinical Optical Imaging System Revenue (billion), by Country 2025 & 2033
- Figure 31: Asia Pacific Preclinical Optical Imaging System Revenue Share (%), by Country 2025 & 2033
List of Tables
- Table 1: Global Preclinical Optical Imaging System Revenue billion Forecast, by Application 2020 & 2033
- Table 2: Global Preclinical Optical Imaging System Revenue billion Forecast, by Types 2020 & 2033
- Table 3: Global Preclinical Optical Imaging System Revenue billion Forecast, by Region 2020 & 2033
- Table 4: Global Preclinical Optical Imaging System Revenue billion Forecast, by Application 2020 & 2033
- Table 5: Global Preclinical Optical Imaging System Revenue billion Forecast, by Types 2020 & 2033
- Table 6: Global Preclinical Optical Imaging System Revenue billion Forecast, by Country 2020 & 2033
- Table 7: United States Preclinical Optical Imaging System Revenue (billion) Forecast, by Application 2020 & 2033
- Table 8: Canada Preclinical Optical Imaging System Revenue (billion) Forecast, by Application 2020 & 2033
- Table 9: Mexico Preclinical Optical Imaging System Revenue (billion) Forecast, by Application 2020 & 2033
- Table 10: Global Preclinical Optical Imaging System Revenue billion Forecast, by Application 2020 & 2033
- Table 11: Global Preclinical Optical Imaging System Revenue billion Forecast, by Types 2020 & 2033
- Table 12: Global Preclinical Optical Imaging System Revenue billion Forecast, by Country 2020 & 2033
- Table 13: Brazil Preclinical Optical Imaging System Revenue (billion) Forecast, by Application 2020 & 2033
- Table 14: Argentina Preclinical Optical Imaging System Revenue (billion) Forecast, by Application 2020 & 2033
- Table 15: Rest of South America Preclinical Optical Imaging System Revenue (billion) Forecast, by Application 2020 & 2033
- Table 16: Global Preclinical Optical Imaging System Revenue billion Forecast, by Application 2020 & 2033
- Table 17: Global Preclinical Optical Imaging System Revenue billion Forecast, by Types 2020 & 2033
- Table 18: Global Preclinical Optical Imaging System Revenue billion Forecast, by Country 2020 & 2033
- Table 19: United Kingdom Preclinical Optical Imaging System Revenue (billion) Forecast, by Application 2020 & 2033
- Table 20: Germany Preclinical Optical Imaging System Revenue (billion) Forecast, by Application 2020 & 2033
- Table 21: France Preclinical Optical Imaging System Revenue (billion) Forecast, by Application 2020 & 2033
- Table 22: Italy Preclinical Optical Imaging System Revenue (billion) Forecast, by Application 2020 & 2033
- Table 23: Spain Preclinical Optical Imaging System Revenue (billion) Forecast, by Application 2020 & 2033
- Table 24: Russia Preclinical Optical Imaging System Revenue (billion) Forecast, by Application 2020 & 2033
- Table 25: Benelux Preclinical Optical Imaging System Revenue (billion) Forecast, by Application 2020 & 2033
- Table 26: Nordics Preclinical Optical Imaging System Revenue (billion) Forecast, by Application 2020 & 2033
- Table 27: Rest of Europe Preclinical Optical Imaging System Revenue (billion) Forecast, by Application 2020 & 2033
- Table 28: Global Preclinical Optical Imaging System Revenue billion Forecast, by Application 2020 & 2033
- Table 29: Global Preclinical Optical Imaging System Revenue billion Forecast, by Types 2020 & 2033
- Table 30: Global Preclinical Optical Imaging System Revenue billion Forecast, by Country 2020 & 2033
- Table 31: Turkey Preclinical Optical Imaging System Revenue (billion) Forecast, by Application 2020 & 2033
- Table 32: Israel Preclinical Optical Imaging System Revenue (billion) Forecast, by Application 2020 & 2033
- Table 33: GCC Preclinical Optical Imaging System Revenue (billion) Forecast, by Application 2020 & 2033
- Table 34: North Africa Preclinical Optical Imaging System Revenue (billion) Forecast, by Application 2020 & 2033
- Table 35: South Africa Preclinical Optical Imaging System Revenue (billion) Forecast, by Application 2020 & 2033
- Table 36: Rest of Middle East & Africa Preclinical Optical Imaging System Revenue (billion) Forecast, by Application 2020 & 2033
- Table 37: Global Preclinical Optical Imaging System Revenue billion Forecast, by Application 2020 & 2033
- Table 38: Global Preclinical Optical Imaging System Revenue billion Forecast, by Types 2020 & 2033
- Table 39: Global Preclinical Optical Imaging System Revenue billion Forecast, by Country 2020 & 2033
- Table 40: China Preclinical Optical Imaging System Revenue (billion) Forecast, by Application 2020 & 2033
- Table 41: India Preclinical Optical Imaging System Revenue (billion) Forecast, by Application 2020 & 2033
- Table 42: Japan Preclinical Optical Imaging System Revenue (billion) Forecast, by Application 2020 & 2033
- Table 43: South Korea Preclinical Optical Imaging System Revenue (billion) Forecast, by Application 2020 & 2033
- Table 44: ASEAN Preclinical Optical Imaging System Revenue (billion) Forecast, by Application 2020 & 2033
- Table 45: Oceania Preclinical Optical Imaging System Revenue (billion) Forecast, by Application 2020 & 2033
- Table 46: Rest of Asia Pacific Preclinical Optical Imaging System Revenue (billion) Forecast, by Application 2020 & 2033
Frequently Asked Questions
1. What is the projected Compound Annual Growth Rate (CAGR) of the Preclinical Optical Imaging System?
The projected CAGR is approximately 5.6%.
2. Which companies are prominent players in the Preclinical Optical Imaging System?
Key companies in the market include Bruker Corporation, Perkin Elmer, Inc., MR Solutions, BioTek Instruments, Inc., Milabs B.V., Fujifilm Holdings Corporation, Magnetic Insight, Inc., MBF Bioscience, Mediso Ltd..
3. What are the main segments of the Preclinical Optical Imaging System?
The market segments include Application, Types.
4. Can you provide details about the market size?
The market size is estimated to be USD 1.05 billion as of 2022.
5. What are some drivers contributing to market growth?
N/A
6. What are the notable trends driving market growth?
N/A
7. Are there any restraints impacting market growth?
N/A
8. Can you provide examples of recent developments in the market?
N/A
9. What pricing options are available for accessing the report?
Pricing options include single-user, multi-user, and enterprise licenses priced at USD 2900.00, USD 4350.00, and USD 5800.00 respectively.
10. Is the market size provided in terms of value or volume?
The market size is provided in terms of value, measured in billion.
11. Are there any specific market keywords associated with the report?
Yes, the market keyword associated with the report is "Preclinical Optical Imaging System," which aids in identifying and referencing the specific market segment covered.
12. How do I determine which pricing option suits my needs best?
The pricing options vary based on user requirements and access needs. Individual users may opt for single-user licenses, while businesses requiring broader access may choose multi-user or enterprise licenses for cost-effective access to the report.
13. Are there any additional resources or data provided in the Preclinical Optical Imaging System report?
While the report offers comprehensive insights, it's advisable to review the specific contents or supplementary materials provided to ascertain if additional resources or data are available.
14. How can I stay updated on further developments or reports in the Preclinical Optical Imaging System?
To stay informed about further developments, trends, and reports in the Preclinical Optical Imaging System, consider subscribing to industry newsletters, following relevant companies and organizations, or regularly checking reputable industry news sources and publications.
Methodology
Step 1 - Identification of Relevant Samples Size from Population Database


Step 2 - Approaches for Defining Global Market Size (Value, Volume* & Price*)

Note*: In applicable scenarios
Step 3 - Data Sources
Primary Research
- Web Analytics
- Survey Reports
- Research Institute
- Latest Research Reports
- Opinion Leaders
Secondary Research
- Annual Reports
- White Paper
- Latest Press Release
- Industry Association
- Paid Database
- Investor Presentations

Step 4 - Data Triangulation
Involves using different sources of information in order to increase the validity of a study
These sources are likely to be stakeholders in a program - participants, other researchers, program staff, other community members, and so on.
Then we put all data in single framework & apply various statistical tools to find out the dynamic on the market.
During the analysis stage, feedback from the stakeholder groups would be compared to determine areas of agreement as well as areas of divergence