

Key Insights
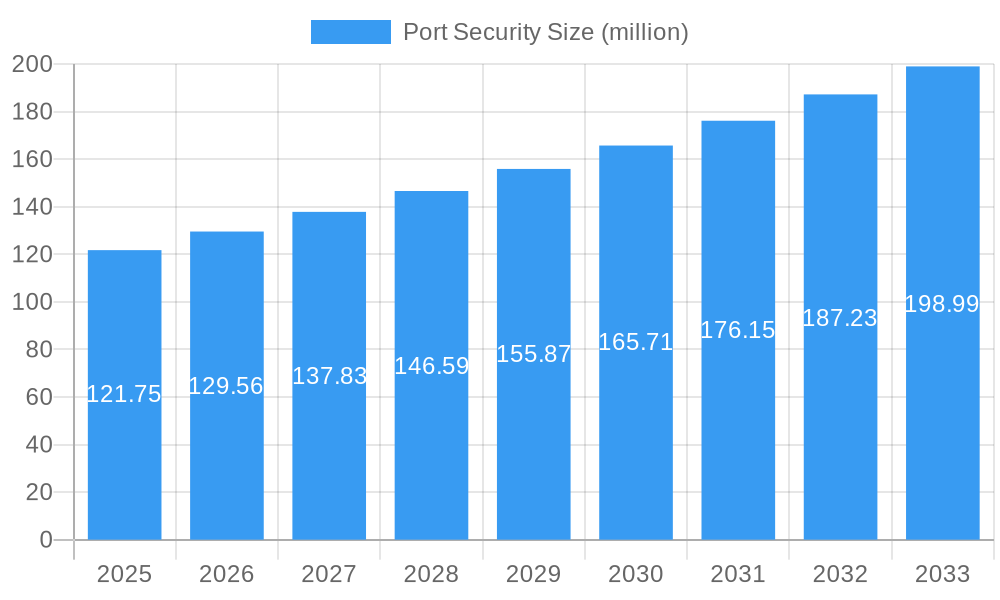
The global port security market, valued at $92.27 billion in 2025, is poised for significant expansion. This growth is propelled by escalating maritime trade volumes, heightened concerns regarding terrorism and piracy, and the widespread adoption of sophisticated security technologies. The market is projected to achieve a Compound Annual Growth Rate (CAGR) of 10.3%, indicating substantial and consistent development. Key growth drivers include the demand for integrated security solutions encompassing advanced surveillance, access control, and threat detection systems. Furthermore, the imperative for robust cybersecurity measures to safeguard critical port infrastructure and sensitive data is a significant catalyst. Emerging trends such as the integration of AI-powered analytics for predictive threat intelligence, the utilization of drone technology for comprehensive aerial surveillance, and the implementation of blockchain for secure supply chain management are actively reshaping the market landscape. While initial investment costs for advanced technologies and the requirement for skilled personnel present certain challenges, the overarching growth trajectory remains exceptionally strong, driven by the fundamental necessity of ensuring global port safety and security. Leading industry participants, including Honeywell, L3Harris Technologies, and Saab, are at the forefront of developing and deploying cutting-edge solutions, fostering a competitive environment and spurring innovation.
Port Security Market Size (In Billion)
The competitive arena features a dynamic interplay between established market leaders and innovative emerging technology providers. Incumbent companies leverage their extensive experience and established market presence to deliver comprehensive security portfolios. Concurrently, new entrants are driving technological advancements through specialized solutions and a focus on niche market segments. Geographically, North America and Europe currently command substantial market shares, attributed to their high levels of maritime activity and stringent security mandates. The Asia-Pacific region is anticipated to experience accelerated growth throughout the forecast period, fueled by increasing economic development and significant investments in port infrastructure. Future market expansion will be contingent upon continuous technological innovation, the evolution of regulatory frameworks, and an intensified focus on cybersecurity within maritime operations. The industry is expected to maintain its growth and innovation momentum as global ports adapt to the ever-changing security challenges of the international maritime domain.
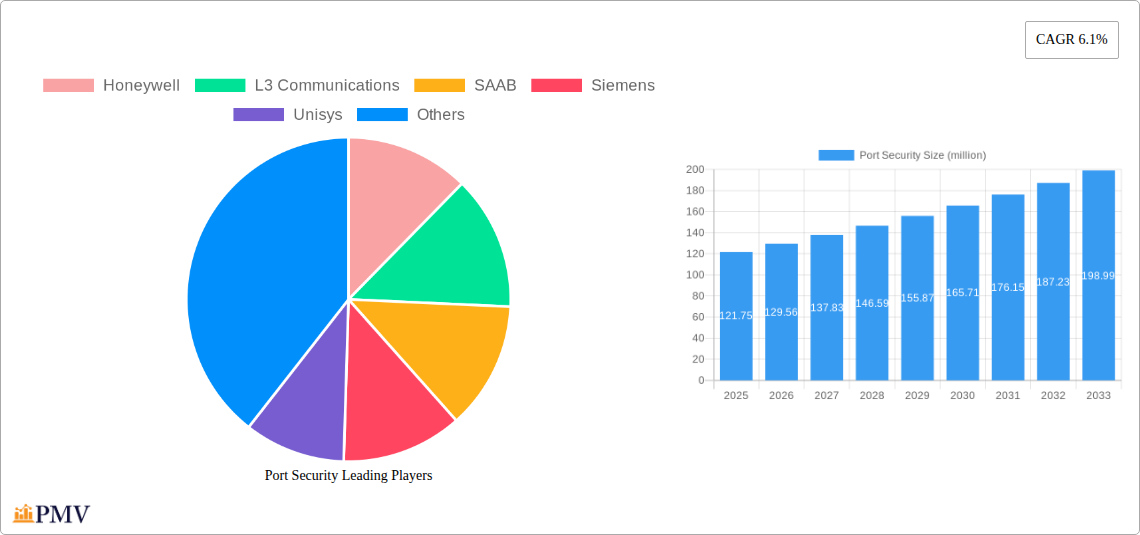
Port Security Company Market Share
Port Security Market Report: 2019-2033 - A Comprehensive Analysis of a Multi-Billion Dollar Industry
This detailed report provides a comprehensive analysis of the global port security market, projecting a market value exceeding $XX billion by 2033. The study covers the historical period (2019-2024), the base year (2025), and the forecast period (2025-2033), offering invaluable insights for stakeholders across the industry. This in-depth analysis examines market structure, competitive dynamics, technological advancements, and future growth prospects. The report is essential for businesses, investors, and policymakers seeking to understand and navigate the complexities of this critical sector.
Port Security Market Structure & Competitive Dynamics
The global port security market exhibits a moderately concentrated structure, with several major players holding significant market share. Key companies like Honeywell, L3Harris Technologies, Saab, Siemens, Unisys, BAE Systems, DVTel, FLIR Systems, James Fisher and Sons, and Motorola Solutions compete fiercely, driving innovation and shaping market dynamics. The market share of these companies fluctuates, with Honeywell and L3Harris Technologies consistently holding leading positions, estimated at approximately XX% and XX% respectively in 2025. The landscape is characterized by strategic partnerships, mergers and acquisitions (M&A), and continuous product development. M&A activity has been significant in recent years, with total deal values exceeding $XX billion between 2019 and 2024. The regulatory framework, varying by region, plays a crucial role in shaping market access and product standards. Continuous advancements in surveillance technologies, cybersecurity solutions, and data analytics contribute to a dynamic competitive environment. End-user demands for enhanced security measures and integrated solutions further drive market evolution. The increasing adoption of AI-powered systems and cloud-based solutions represents a major trend impacting market structure and competition. Product substitution is limited due to the specialized nature of port security equipment and systems, though cost-effective alternatives are constantly emerging.
Port Security Industry Trends & Insights
The global port security market is experiencing robust growth, driven by factors such as increasing global trade, rising concerns about maritime security threats (terrorism, piracy, smuggling), and stringent government regulations. The Compound Annual Growth Rate (CAGR) for the period 2025-2033 is projected at XX%, exceeding previous estimates. This growth is fueled by increased investment in advanced technologies such as AI-powered video analytics, biometric identification systems, and cyber security solutions. The market penetration of these advanced systems remains relatively low, presenting significant growth opportunities. Consumer preferences are shifting towards integrated solutions offering comprehensive security coverage, encompassing access control, perimeter protection, and threat detection. Competitive dynamics are intensified by the entry of new players offering innovative solutions and the consolidation among established companies through mergers and acquisitions. The market is witnessing a gradual shift towards cloud-based solutions, providing better scalability and data management capabilities. This trend is expected to accelerate in the coming years, leading to further market growth and innovation.
Dominant Markets & Segments in Port Security
The Asia-Pacific region dominates the global port security market, driven by rapid economic growth, burgeoning trade activities, and significant investments in port infrastructure development. China, specifically, presents a lucrative market segment owing to its extensive coastline and thriving maritime industry.
- Key Drivers in Asia-Pacific:
- Massive infrastructure development projects in major ports.
- Stringent government regulations and security mandates.
- High volume of maritime trade and increasing cargo traffic.
- Rising adoption of advanced technologies for security enhancements.
- Government initiatives promoting smart port development.
The dominance of the Asia-Pacific region is also influenced by factors such as the increasing adoption of automated systems for port operations and the growing focus on enhancing cybersecurity measures to combat cyber threats. The market's growth in this region is also influenced by government initiatives aimed at promoting safe and secure ports, with significant investments in port infrastructure and security technologies. Furthermore, the increasing awareness of the vulnerabilities in port security infrastructure is driving the demand for advanced security systems.
Port Security Product Innovations
Recent product innovations in port security focus on integrating advanced technologies like AI, machine learning, and big data analytics to enhance threat detection and response capabilities. New systems utilize advanced sensors, video analytics, and automated threat assessment to improve situational awareness and efficiency. Companies are also developing integrated solutions that combine various security technologies into a single platform, offering improved interoperability and streamlined management. These innovations address the growing demand for enhanced security and operational efficiency in port environments, creating a competitive advantage for companies offering cutting-edge solutions. The integration of blockchain technology for secure data management and supply chain traceability is also emerging as a significant innovation.
Report Segmentation & Scope
The report segments the port security market based on various factors, including technology (access control systems, surveillance systems, perimeter security systems, cybersecurity solutions), application (container terminals, cruise terminals, cargo terminals, etc.), and geography (North America, Europe, Asia-Pacific, Middle East & Africa, South America). Each segment is thoroughly analyzed, providing detailed growth projections, market sizes, and competitive dynamics. For instance, the surveillance systems segment is expected to exhibit strong growth due to the increasing demand for advanced video analytics and real-time monitoring capabilities. Similarly, the cybersecurity solutions segment is gaining traction due to the growing concerns over cyber threats targeting port infrastructure. The regional segmentation offers insights into market-specific drivers and challenges, allowing businesses to tailor strategies according to the nuances of each geographic market.
Key Drivers of Port Security Growth
The growth of the port security market is primarily propelled by technological advancements, economic factors, and stringent regulatory measures. The increasing adoption of AI-powered surveillance systems, improved cybersecurity solutions, and integrated access control systems enhance port security significantly. Furthermore, the global rise in maritime trade and the consequent increase in cargo volume necessitate heightened security measures. Government regulations aimed at mitigating security threats and enhancing operational efficiency are also major contributors to market growth. The growing awareness of the potential risks associated with port security breaches is driving investments in advanced security technologies, further supporting market expansion. Incentives and funding initiatives launched by governments worldwide further fuel the sector's advancement.
Challenges in the Port Security Sector
Despite the significant growth potential, the port security sector faces several challenges. Regulatory hurdles, including varying standards across different regions, can hinder market penetration and create compliance complexities. Supply chain disruptions, exacerbated by global events, can lead to delays and increased costs in procuring equipment and components. Moreover, intense competition among established players and the emergence of new entrants can put pressure on profit margins and necessitate continuous innovation to maintain a competitive edge. The need to balance the cost of implementation with effective security is another significant challenge for port authorities, influencing market dynamics and technology adoption. Lastly, ensuring cybersecurity and protecting sensitive data represent a continuous challenge requiring robust solutions.
Leading Players in the Port Security Market
Key Developments in Port Security Sector
- 2022 (October): Honeywell launched its next-generation access control system for ports, incorporating advanced biometric technology.
- 2023 (March): L3Harris Technologies announced a strategic partnership with a cybersecurity firm to enhance port cyber resilience.
- 2024 (June): SAAB secured a major contract for deploying advanced surveillance systems at a key port in Southeast Asia.
- 2025 (January): A major merger between two smaller port security companies reshaped the competitive landscape. (xx - further details pending)
Strategic Port Security Market Outlook
The future of the port security market looks bright, characterized by continued technological innovation, increasing investments, and growing regulatory pressure. The market is expected to experience robust growth over the forecast period, driven by the convergence of various factors, including the adoption of smart port technologies, the growing need for enhanced cybersecurity, and the increasing demand for integrated security solutions. Strategic opportunities lie in developing innovative and cost-effective solutions that cater to the specific needs of different port operations. Focusing on sustainability and environmentally friendly technologies will also be crucial for gaining a competitive edge. Companies with strong technological capabilities and strategic partnerships will be well-positioned to capitalize on these opportunities.
Port Security Segmentation
-
1. Application
- 1.1. Video Monitoring
- 1.2. Weapons Detection
- 1.3. Visitor Management
- 1.4. Intrusion Detection
- 1.5. Fire Detection
- 1.6. Other
-
2. Type
- 2.1. Airport Security Management Market
- 2.2. Port Security Management Market
Port Security Segmentation By Geography
-
1. North America
- 1.1. United States
- 1.2. Canada
- 1.3. Mexico
-
2. South America
- 2.1. Brazil
- 2.2. Argentina
- 2.3. Rest of South America
-
3. Europe
- 3.1. United Kingdom
- 3.2. Germany
- 3.3. France
- 3.4. Italy
- 3.5. Spain
- 3.6. Russia
- 3.7. Benelux
- 3.8. Nordics
- 3.9. Rest of Europe
-
4. Middle East & Africa
- 4.1. Turkey
- 4.2. Israel
- 4.3. GCC
- 4.4. North Africa
- 4.5. South Africa
- 4.6. Rest of Middle East & Africa
-
5. Asia Pacific
- 5.1. China
- 5.2. India
- 5.3. Japan
- 5.4. South Korea
- 5.5. ASEAN
- 5.6. Oceania
- 5.7. Rest of Asia Pacific

Port Security Regional Market Share
Geographic Coverage of Port Security
Port Security REPORT HIGHLIGHTS
| Aspects | Details |
|---|---|
| Study Period | 2020-2034 |
| Base Year | 2025 |
| Estimated Year | 2026 |
| Forecast Period | 2026-2034 |
| Historical Period | 2020-2025 |
| Growth Rate | CAGR of 10.3% from 2020-2034 |
| Segmentation |
|
Table of Contents
- 1. Introduction
- 1.1. Research Scope
- 1.2. Market Segmentation
- 1.3. Research Methodology
- 1.4. Definitions and Assumptions
- 2. Executive Summary
- 2.1. Introduction
- 3. Market Dynamics
- 3.1. Introduction
- 3.2. Market Drivers
- 3.3. Market Restrains
- 3.4. Market Trends
- 4. Market Factor Analysis
- 4.1. Porters Five Forces
- 4.2. Supply/Value Chain
- 4.3. PESTEL analysis
- 4.4. Market Entropy
- 4.5. Patent/Trademark Analysis
- 5. Global Port Security Analysis, Insights and Forecast, 2020-2032
- 5.1. Market Analysis, Insights and Forecast - by Application
- 5.1.1. Video Monitoring
- 5.1.2. Weapons Detection
- 5.1.3. Visitor Management
- 5.1.4. Intrusion Detection
- 5.1.5. Fire Detection
- 5.1.6. Other
- 5.2. Market Analysis, Insights and Forecast - by Type
- 5.2.1. Airport Security Management Market
- 5.2.2. Port Security Management Market
- 5.3. Market Analysis, Insights and Forecast - by Region
- 5.3.1. North America
- 5.3.2. South America
- 5.3.3. Europe
- 5.3.4. Middle East & Africa
- 5.3.5. Asia Pacific
- 5.1. Market Analysis, Insights and Forecast - by Application
- 6. North America Port Security Analysis, Insights and Forecast, 2020-2032
- 6.1. Market Analysis, Insights and Forecast - by Application
- 6.1.1. Video Monitoring
- 6.1.2. Weapons Detection
- 6.1.3. Visitor Management
- 6.1.4. Intrusion Detection
- 6.1.5. Fire Detection
- 6.1.6. Other
- 6.2. Market Analysis, Insights and Forecast - by Type
- 6.2.1. Airport Security Management Market
- 6.2.2. Port Security Management Market
- 6.1. Market Analysis, Insights and Forecast - by Application
- 7. South America Port Security Analysis, Insights and Forecast, 2020-2032
- 7.1. Market Analysis, Insights and Forecast - by Application
- 7.1.1. Video Monitoring
- 7.1.2. Weapons Detection
- 7.1.3. Visitor Management
- 7.1.4. Intrusion Detection
- 7.1.5. Fire Detection
- 7.1.6. Other
- 7.2. Market Analysis, Insights and Forecast - by Type
- 7.2.1. Airport Security Management Market
- 7.2.2. Port Security Management Market
- 7.1. Market Analysis, Insights and Forecast - by Application
- 8. Europe Port Security Analysis, Insights and Forecast, 2020-2032
- 8.1. Market Analysis, Insights and Forecast - by Application
- 8.1.1. Video Monitoring
- 8.1.2. Weapons Detection
- 8.1.3. Visitor Management
- 8.1.4. Intrusion Detection
- 8.1.5. Fire Detection
- 8.1.6. Other
- 8.2. Market Analysis, Insights and Forecast - by Type
- 8.2.1. Airport Security Management Market
- 8.2.2. Port Security Management Market
- 8.1. Market Analysis, Insights and Forecast - by Application
- 9. Middle East & Africa Port Security Analysis, Insights and Forecast, 2020-2032
- 9.1. Market Analysis, Insights and Forecast - by Application
- 9.1.1. Video Monitoring
- 9.1.2. Weapons Detection
- 9.1.3. Visitor Management
- 9.1.4. Intrusion Detection
- 9.1.5. Fire Detection
- 9.1.6. Other
- 9.2. Market Analysis, Insights and Forecast - by Type
- 9.2.1. Airport Security Management Market
- 9.2.2. Port Security Management Market
- 9.1. Market Analysis, Insights and Forecast - by Application
- 10. Asia Pacific Port Security Analysis, Insights and Forecast, 2020-2032
- 10.1. Market Analysis, Insights and Forecast - by Application
- 10.1.1. Video Monitoring
- 10.1.2. Weapons Detection
- 10.1.3. Visitor Management
- 10.1.4. Intrusion Detection
- 10.1.5. Fire Detection
- 10.1.6. Other
- 10.2. Market Analysis, Insights and Forecast - by Type
- 10.2.1. Airport Security Management Market
- 10.2.2. Port Security Management Market
- 10.1. Market Analysis, Insights and Forecast - by Application
- 11. Competitive Analysis
- 11.1. Global Market Share Analysis 2025
- 11.2. Company Profiles
- 11.2.1 Honeywell
- 11.2.1.1. Overview
- 11.2.1.2. Products
- 11.2.1.3. SWOT Analysis
- 11.2.1.4. Recent Developments
- 11.2.1.5. Financials (Based on Availability)
- 11.2.2 L3 Communications
- 11.2.2.1. Overview
- 11.2.2.2. Products
- 11.2.2.3. SWOT Analysis
- 11.2.2.4. Recent Developments
- 11.2.2.5. Financials (Based on Availability)
- 11.2.3 SAAB
- 11.2.3.1. Overview
- 11.2.3.2. Products
- 11.2.3.3. SWOT Analysis
- 11.2.3.4. Recent Developments
- 11.2.3.5. Financials (Based on Availability)
- 11.2.4 Siemens
- 11.2.4.1. Overview
- 11.2.4.2. Products
- 11.2.4.3. SWOT Analysis
- 11.2.4.4. Recent Developments
- 11.2.4.5. Financials (Based on Availability)
- 11.2.5 Unisys
- 11.2.5.1. Overview
- 11.2.5.2. Products
- 11.2.5.3. SWOT Analysis
- 11.2.5.4. Recent Developments
- 11.2.5.5. Financials (Based on Availability)
- 11.2.6 Bae Systems
- 11.2.6.1. Overview
- 11.2.6.2. Products
- 11.2.6.3. SWOT Analysis
- 11.2.6.4. Recent Developments
- 11.2.6.5. Financials (Based on Availability)
- 11.2.7 DvTel
- 11.2.7.1. Overview
- 11.2.7.2. Products
- 11.2.7.3. SWOT Analysis
- 11.2.7.4. Recent Developments
- 11.2.7.5. Financials (Based on Availability)
- 11.2.8 Flir Systems
- 11.2.8.1. Overview
- 11.2.8.2. Products
- 11.2.8.3. SWOT Analysis
- 11.2.8.4. Recent Developments
- 11.2.8.5. Financials (Based on Availability)
- 11.2.9 James Fisher and Sons
- 11.2.9.1. Overview
- 11.2.9.2. Products
- 11.2.9.3. SWOT Analysis
- 11.2.9.4. Recent Developments
- 11.2.9.5. Financials (Based on Availability)
- 11.2.10 Motorola Solutions
- 11.2.10.1. Overview
- 11.2.10.2. Products
- 11.2.10.3. SWOT Analysis
- 11.2.10.4. Recent Developments
- 11.2.10.5. Financials (Based on Availability)
- 11.2.1 Honeywell
List of Figures
- Figure 1: Global Port Security Revenue Breakdown (billion, %) by Region 2025 & 2033
- Figure 2: North America Port Security Revenue (billion), by Application 2025 & 2033
- Figure 3: North America Port Security Revenue Share (%), by Application 2025 & 2033
- Figure 4: North America Port Security Revenue (billion), by Type 2025 & 2033
- Figure 5: North America Port Security Revenue Share (%), by Type 2025 & 2033
- Figure 6: North America Port Security Revenue (billion), by Country 2025 & 2033
- Figure 7: North America Port Security Revenue Share (%), by Country 2025 & 2033
- Figure 8: South America Port Security Revenue (billion), by Application 2025 & 2033
- Figure 9: South America Port Security Revenue Share (%), by Application 2025 & 2033
- Figure 10: South America Port Security Revenue (billion), by Type 2025 & 2033
- Figure 11: South America Port Security Revenue Share (%), by Type 2025 & 2033
- Figure 12: South America Port Security Revenue (billion), by Country 2025 & 2033
- Figure 13: South America Port Security Revenue Share (%), by Country 2025 & 2033
- Figure 14: Europe Port Security Revenue (billion), by Application 2025 & 2033
- Figure 15: Europe Port Security Revenue Share (%), by Application 2025 & 2033
- Figure 16: Europe Port Security Revenue (billion), by Type 2025 & 2033
- Figure 17: Europe Port Security Revenue Share (%), by Type 2025 & 2033
- Figure 18: Europe Port Security Revenue (billion), by Country 2025 & 2033
- Figure 19: Europe Port Security Revenue Share (%), by Country 2025 & 2033
- Figure 20: Middle East & Africa Port Security Revenue (billion), by Application 2025 & 2033
- Figure 21: Middle East & Africa Port Security Revenue Share (%), by Application 2025 & 2033
- Figure 22: Middle East & Africa Port Security Revenue (billion), by Type 2025 & 2033
- Figure 23: Middle East & Africa Port Security Revenue Share (%), by Type 2025 & 2033
- Figure 24: Middle East & Africa Port Security Revenue (billion), by Country 2025 & 2033
- Figure 25: Middle East & Africa Port Security Revenue Share (%), by Country 2025 & 2033
- Figure 26: Asia Pacific Port Security Revenue (billion), by Application 2025 & 2033
- Figure 27: Asia Pacific Port Security Revenue Share (%), by Application 2025 & 2033
- Figure 28: Asia Pacific Port Security Revenue (billion), by Type 2025 & 2033
- Figure 29: Asia Pacific Port Security Revenue Share (%), by Type 2025 & 2033
- Figure 30: Asia Pacific Port Security Revenue (billion), by Country 2025 & 2033
- Figure 31: Asia Pacific Port Security Revenue Share (%), by Country 2025 & 2033
List of Tables
- Table 1: Global Port Security Revenue billion Forecast, by Application 2020 & 2033
- Table 2: Global Port Security Revenue billion Forecast, by Type 2020 & 2033
- Table 3: Global Port Security Revenue billion Forecast, by Region 2020 & 2033
- Table 4: Global Port Security Revenue billion Forecast, by Application 2020 & 2033
- Table 5: Global Port Security Revenue billion Forecast, by Type 2020 & 2033
- Table 6: Global Port Security Revenue billion Forecast, by Country 2020 & 2033
- Table 7: United States Port Security Revenue (billion) Forecast, by Application 2020 & 2033
- Table 8: Canada Port Security Revenue (billion) Forecast, by Application 2020 & 2033
- Table 9: Mexico Port Security Revenue (billion) Forecast, by Application 2020 & 2033
- Table 10: Global Port Security Revenue billion Forecast, by Application 2020 & 2033
- Table 11: Global Port Security Revenue billion Forecast, by Type 2020 & 2033
- Table 12: Global Port Security Revenue billion Forecast, by Country 2020 & 2033
- Table 13: Brazil Port Security Revenue (billion) Forecast, by Application 2020 & 2033
- Table 14: Argentina Port Security Revenue (billion) Forecast, by Application 2020 & 2033
- Table 15: Rest of South America Port Security Revenue (billion) Forecast, by Application 2020 & 2033
- Table 16: Global Port Security Revenue billion Forecast, by Application 2020 & 2033
- Table 17: Global Port Security Revenue billion Forecast, by Type 2020 & 2033
- Table 18: Global Port Security Revenue billion Forecast, by Country 2020 & 2033
- Table 19: United Kingdom Port Security Revenue (billion) Forecast, by Application 2020 & 2033
- Table 20: Germany Port Security Revenue (billion) Forecast, by Application 2020 & 2033
- Table 21: France Port Security Revenue (billion) Forecast, by Application 2020 & 2033
- Table 22: Italy Port Security Revenue (billion) Forecast, by Application 2020 & 2033
- Table 23: Spain Port Security Revenue (billion) Forecast, by Application 2020 & 2033
- Table 24: Russia Port Security Revenue (billion) Forecast, by Application 2020 & 2033
- Table 25: Benelux Port Security Revenue (billion) Forecast, by Application 2020 & 2033
- Table 26: Nordics Port Security Revenue (billion) Forecast, by Application 2020 & 2033
- Table 27: Rest of Europe Port Security Revenue (billion) Forecast, by Application 2020 & 2033
- Table 28: Global Port Security Revenue billion Forecast, by Application 2020 & 2033
- Table 29: Global Port Security Revenue billion Forecast, by Type 2020 & 2033
- Table 30: Global Port Security Revenue billion Forecast, by Country 2020 & 2033
- Table 31: Turkey Port Security Revenue (billion) Forecast, by Application 2020 & 2033
- Table 32: Israel Port Security Revenue (billion) Forecast, by Application 2020 & 2033
- Table 33: GCC Port Security Revenue (billion) Forecast, by Application 2020 & 2033
- Table 34: North Africa Port Security Revenue (billion) Forecast, by Application 2020 & 2033
- Table 35: South Africa Port Security Revenue (billion) Forecast, by Application 2020 & 2033
- Table 36: Rest of Middle East & Africa Port Security Revenue (billion) Forecast, by Application 2020 & 2033
- Table 37: Global Port Security Revenue billion Forecast, by Application 2020 & 2033
- Table 38: Global Port Security Revenue billion Forecast, by Type 2020 & 2033
- Table 39: Global Port Security Revenue billion Forecast, by Country 2020 & 2033
- Table 40: China Port Security Revenue (billion) Forecast, by Application 2020 & 2033
- Table 41: India Port Security Revenue (billion) Forecast, by Application 2020 & 2033
- Table 42: Japan Port Security Revenue (billion) Forecast, by Application 2020 & 2033
- Table 43: South Korea Port Security Revenue (billion) Forecast, by Application 2020 & 2033
- Table 44: ASEAN Port Security Revenue (billion) Forecast, by Application 2020 & 2033
- Table 45: Oceania Port Security Revenue (billion) Forecast, by Application 2020 & 2033
- Table 46: Rest of Asia Pacific Port Security Revenue (billion) Forecast, by Application 2020 & 2033
Frequently Asked Questions
1. What is the projected Compound Annual Growth Rate (CAGR) of the Port Security?
The projected CAGR is approximately 10.3%.
2. Which companies are prominent players in the Port Security?
Key companies in the market include Honeywell, L3 Communications, SAAB, Siemens, Unisys, Bae Systems, DvTel, Flir Systems, James Fisher and Sons, Motorola Solutions.
3. What are the main segments of the Port Security?
The market segments include Application, Type.
4. Can you provide details about the market size?
The market size is estimated to be USD 92.27 billion as of 2022.
5. What are some drivers contributing to market growth?
N/A
6. What are the notable trends driving market growth?
N/A
7. Are there any restraints impacting market growth?
N/A
8. Can you provide examples of recent developments in the market?
N/A
9. What pricing options are available for accessing the report?
Pricing options include single-user, multi-user, and enterprise licenses priced at USD 2900.00, USD 4350.00, and USD 5800.00 respectively.
10. Is the market size provided in terms of value or volume?
The market size is provided in terms of value, measured in billion.
11. Are there any specific market keywords associated with the report?
Yes, the market keyword associated with the report is "Port Security," which aids in identifying and referencing the specific market segment covered.
12. How do I determine which pricing option suits my needs best?
The pricing options vary based on user requirements and access needs. Individual users may opt for single-user licenses, while businesses requiring broader access may choose multi-user or enterprise licenses for cost-effective access to the report.
13. Are there any additional resources or data provided in the Port Security report?
While the report offers comprehensive insights, it's advisable to review the specific contents or supplementary materials provided to ascertain if additional resources or data are available.
14. How can I stay updated on further developments or reports in the Port Security?
To stay informed about further developments, trends, and reports in the Port Security, consider subscribing to industry newsletters, following relevant companies and organizations, or regularly checking reputable industry news sources and publications.
Methodology
Step 1 - Identification of Relevant Samples Size from Population Database


Step 2 - Approaches for Defining Global Market Size (Value, Volume* & Price*)

Note*: In applicable scenarios
Step 3 - Data Sources
Primary Research
- Web Analytics
- Survey Reports
- Research Institute
- Latest Research Reports
- Opinion Leaders
Secondary Research
- Annual Reports
- White Paper
- Latest Press Release
- Industry Association
- Paid Database
- Investor Presentations

Step 4 - Data Triangulation
Involves using different sources of information in order to increase the validity of a study
These sources are likely to be stakeholders in a program - participants, other researchers, program staff, other community members, and so on.
Then we put all data in single framework & apply various statistical tools to find out the dynamic on the market.
During the analysis stage, feedback from the stakeholder groups would be compared to determine areas of agreement as well as areas of divergence