
Key Insights
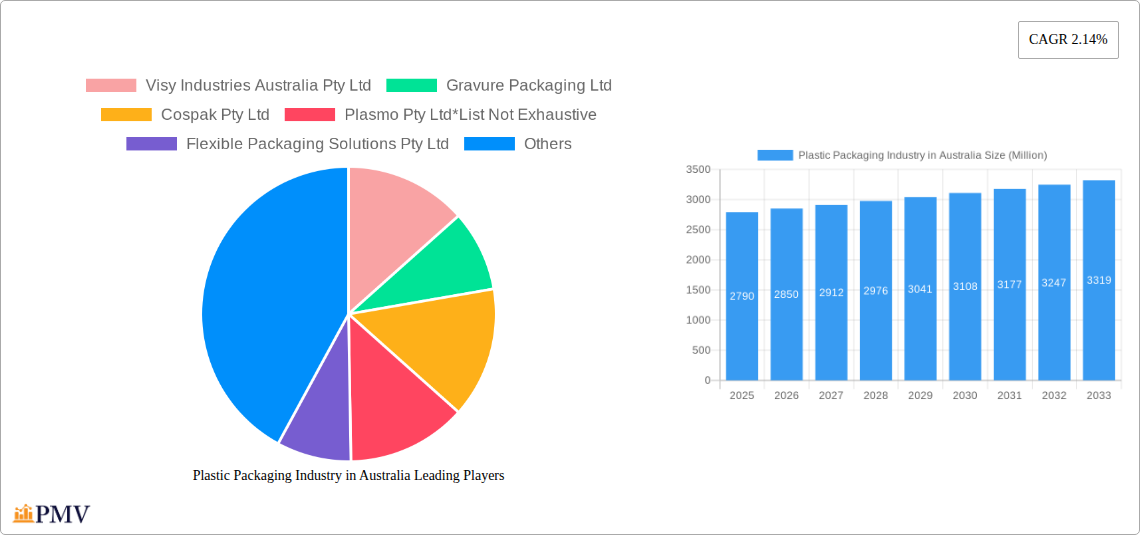
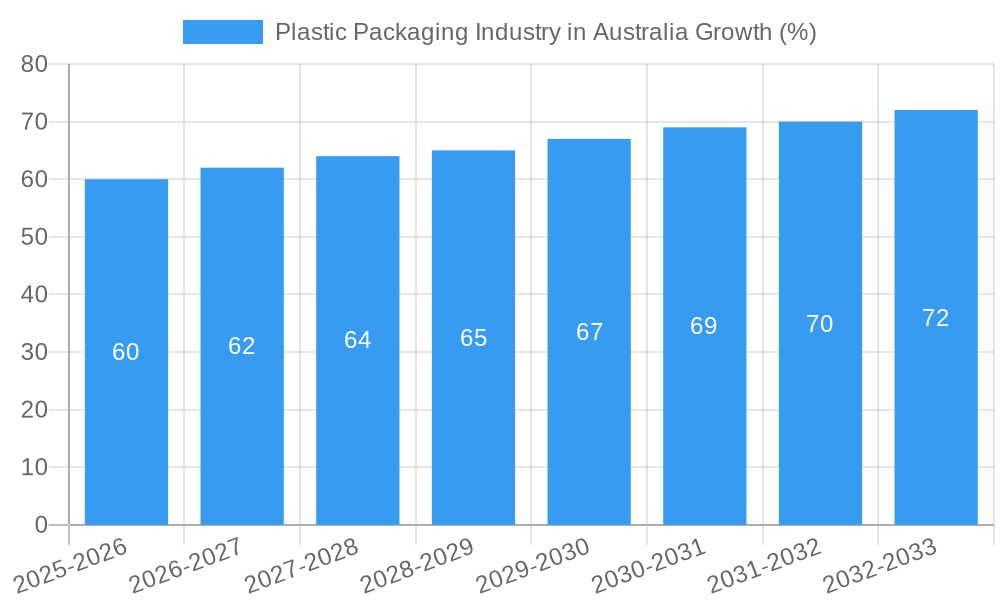
The Australian plastic packaging market, valued at $2.79 billion in 2025, is projected to experience steady growth, driven primarily by the burgeoning food and beverage sector, increasing demand for convenient packaging, and the expanding e-commerce industry. The 2.14% CAGR indicates a consistent, albeit moderate, expansion over the forecast period (2025-2033). While rigid packaging, encompassing polyethylene (PE) products, holds a significant market share, the flexible packaging segment is expected to witness faster growth fueled by its lightweight nature, cost-effectiveness, and versatility in accommodating diverse product types. Within flexible packaging, materials like polypropylene and specialized films used in applications like stretch and agricultural film are showing promising growth trajectories. The healthcare and personal care sectors are also contributing significantly to market demand due to the need for hygienic and protective packaging. However, growing environmental concerns related to plastic waste and increasing governmental regulations aimed at reducing plastic pollution pose significant restraints to market growth. Companies are responding by investing in sustainable alternatives like biodegradable and compostable plastics, and exploring innovative recycling solutions. The market's future growth will depend on successfully balancing consumer demand for convenient packaging with the imperative to reduce environmental impact.
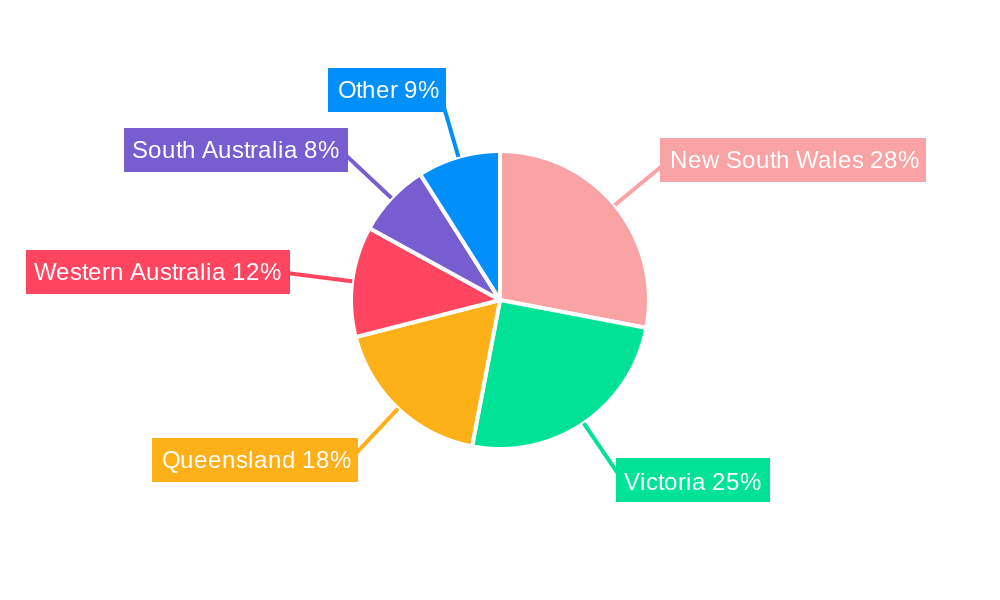
The competitive landscape is characterized by a mix of large multinational corporations and smaller, specialized players. Key players like Visy Industries, Orora Packaging, and Pact Group are driving innovation and consolidation within the market. Smaller companies are focusing on niche applications and specialized packaging solutions, particularly within the flexible packaging segment. This dynamic landscape is likely to see continued mergers and acquisitions as companies seek to expand their product portfolios and market reach. Regional variations in consumption patterns and regulatory frameworks may influence market growth within specific areas of Australia. Further research into specific material types and end-user industries will provide a deeper understanding of the underlying market dynamics and future growth prospects.
Plastic Packaging Industry in Australia: A Comprehensive Market Report (2019-2033)
This comprehensive report provides an in-depth analysis of the Australian plastic packaging industry, covering market size, segmentation, competitive landscape, key players, and future growth prospects. The study period spans from 2019 to 2033, with 2025 serving as the base and estimated year. This report is crucial for businesses operating in or considering entry into this dynamic market. It offers actionable insights derived from rigorous analysis, empowering informed strategic decision-making. The report utilizes data from the historical period (2019-2024) and projects market trends up to 2033.
Plastic Packaging Industry in Australia Market Structure & Competitive Dynamics
The Australian plastic packaging market exhibits a moderately concentrated structure, with several major players holding significant market share. Visy Industries Australia Pty Ltd, Orora Packaging Australia Pty Ltd, and Pact Group Holdings Australia Pty Ltd are among the leading companies, collectively controlling an estimated xx% of the market. The market is characterized by intense competition, driven by factors such as product innovation, pricing strategies, and service offerings. Innovation ecosystems are vibrant, with companies investing significantly in R&D to develop sustainable and innovative packaging solutions. The regulatory framework, including increasingly stringent environmental regulations, significantly impacts industry players, pushing them towards more sustainable practices. Product substitutes, such as biodegradable and compostable packaging, pose a growing challenge to traditional plastic packaging. End-user trends, particularly the rising demand for e-commerce packaging and sustainable solutions, are reshaping the market landscape. M&A activities have been moderate, with deal values ranging from xx Million to xx Million in recent years. These transactions reflect consolidation efforts and expansion strategies within the industry.
- Market Concentration: Moderately concentrated, with top three players holding xx% market share.
- Innovation Ecosystems: Active, with ongoing investments in sustainable packaging solutions.
- Regulatory Frameworks: Increasingly stringent environmental regulations driving sustainability initiatives.
- Product Substitutes: Biodegradable and compostable packaging present a growing competitive threat.
- End-User Trends: Growing demand for e-commerce packaging and sustainable alternatives.
- M&A Activities: Moderate activity with deal values ranging from xx Million to xx Million.
Plastic Packaging Industry in Australia Industry Trends & Insights
The Australian plastic packaging market is experiencing robust growth, driven by several key factors. The expanding food and beverage industry, coupled with increasing consumer demand, fuels market expansion. Technological advancements, such as the development of lightweight and high-barrier packaging materials, are further enhancing efficiency and sustainability. Consumer preferences are shifting towards convenient, tamper-evident, and eco-friendly packaging. This trend forces manufacturers to adopt more sustainable materials and production processes. The competitive landscape is marked by intense rivalry among established players and emerging businesses seeking to differentiate through innovative product offerings and eco-conscious strategies. The market is expected to exhibit a Compound Annual Growth Rate (CAGR) of xx% during the forecast period (2025-2033), with market penetration of sustainable packaging materials gradually increasing. Government initiatives promoting recycling and waste reduction are also significantly impacting market dynamics.
Dominant Markets & Segments in Plastic Packaging Industry in Australia
The Australian plastic packaging market is broadly segmented by packaging type (rigid and flexible), material (polyethylene, polypropylene, etc.), and end-use industry (food & beverage, healthcare, personal care, etc.). Within these segments, several stand out as dominant.
- Rigid Packaging: Polyethylene (PE) remains a dominant material, driven by its versatility and cost-effectiveness in applications across various end-user industries.
- Flexible Packaging: The demand for flexible packaging is soaring, driven by its lightweight nature, cost-effectiveness, and convenience in e-commerce and food applications. Materials such as polypropylene (PP) and other flexible packaging materials are seeing widespread adoption.
- Industrial Plastic Film Market: Stretch film dominates the industrial plastic film market, particularly within logistics and warehousing, reflecting the increasing demand for efficient packaging solutions. Agricultural film remains significant within the agricultural sector.
- End-user Industry: The food and beverage sector constitutes the largest end-use industry, owing to the high volume of packaged food and beverages consumed within Australia. Healthcare and personal care industries also represent substantial market segments.
Key Drivers:
- Economic growth: Increasing disposable incomes and rising consumption drive demand for packaged goods.
- Infrastructure development: Improved logistics and distribution networks facilitate the movement of packaged goods.
- Government policies: Policies promoting sustainable packaging drive innovation in this space.
Plastic Packaging Industry in Australia Product Innovations
Significant innovations are reshaping the Australian plastic packaging landscape. Lightweighting techniques are reducing material usage, improving sustainability. The development of high-barrier films is enhancing product shelf life, reducing food waste. Furthermore, advancements in recycled content incorporation and the increasing utilization of bio-based materials are enhancing the sustainability profile of plastic packaging in Australia. These developments address growing consumer demands for environmentally responsible packaging solutions. The successful market adoption of these innovations will be determined by their ability to deliver cost-effectiveness and performance benefits comparable to traditional plastic packaging options.
Report Segmentation & Scope
This report segments the Australian plastic packaging market based on the following parameters:
Rigid Packaging: This segment analyzes the market size, growth trends, and competitive dynamics of rigid plastic packaging, focusing on different materials such as Polyethylene (PE), Polypropylene (PP), and others. Growth projections indicate a CAGR of xx% during the forecast period.
Flexible Packaging: This section details the market for flexible plastic packaging, focusing on materials like Polyethylene (PE), Polypropylene (PP), and other flexible packaging materials. Market size and competitive dynamics are analyzed, with growth projected at xx% CAGR.
Industrial Plastic Film Market: This segment focuses on the market for stretch film and agricultural film, outlining market size, growth potential, and competitive landscape. Growth is projected to be xx% CAGR.
End-user Industries: The report analyzes the market across key end-use industries including food, beverage, healthcare, personal care and household products, and others, providing market sizes and growth projections for each sector. The food and beverage sector is expected to maintain its dominant position, with a CAGR of xx%.
Key Drivers of Plastic Packaging Industry in Australia Growth
Several factors propel growth within the Australian plastic packaging industry. Firstly, a robust economy and expanding consumer base lead to increased demand for packaged goods. Secondly, advancements in packaging technologies improve efficiency and sustainability. Thirdly, government regulations promoting recycling and sustainable packaging encourage industry innovation. Lastly, the rising e-commerce sector increases demand for packaging solutions. These factors create a positive feedback loop promoting market expansion.
Challenges in the Plastic Packaging Industry in Australia Sector
The Australian plastic packaging industry faces several challenges. Stringent environmental regulations, leading to increased costs associated with compliance and material sourcing, represent a key hurdle. Supply chain disruptions, particularly disruptions of raw material supply, can significantly affect production and delivery timelines. Furthermore, intense competition and the rising popularity of alternative packaging materials pose challenges to market players. These factors necessitate proactive strategies to overcome operational and market pressures.
Leading Players in the Plastic Packaging Industry in Australia Market
- Visy Industries Australia Pty Ltd
- Gravure Packaging Ltd
- Cospak Pty Ltd
- Plasmo Pty Ltd
- Flexible Packaging Solutions Pty Ltd
- Orora Packaging Australia Pty Ltd
- A&M Packaging Pty Ltd
- Pact Group Holdings Australia Pty Ltd
- Caspak Products Pty Ltd
- Synergy Packaging (RPC Group)
- Pro-Pac Packaging Pty Ltd
- Filton Packaging Pty Ltd
- Econopak Flexible Packaging
- Vacupack Pty Ltd
Key Developments in Plastic Packaging Industry in Australia Sector
October 2022: Mondelez Australia promotes recycled soft plastic packaging to meet 2025 goals. This highlights a shift towards sustainability.
July 2022: Nestlé Australia launches KitKat wrappers with 30% recycled plastic, reducing virgin plastic use by approximately 250,000 m2. This signifies a major commitment to sustainable packaging.
February 2022: Cadbury Australia commits to using recycled plastic packaging for 50 Million family chocolate blocks. This showcases a substantial industry move towards recycled materials.
Strategic Plastic Packaging Industry in Australia Market Outlook
The Australian plastic packaging industry holds significant future potential. Continued economic growth, increasing consumer demand, and a focus on sustainable solutions will drive market expansion. Strategic opportunities exist in developing innovative and eco-friendly packaging solutions, capitalizing on the growing e-commerce sector, and optimizing supply chain efficiency. Companies that proactively adapt to evolving consumer preferences and regulatory changes will be well-positioned for success in this dynamic market.
Plastic Packaging Industry in Australia Segmentation
-
1. Rigid Packaging
-
1.1. Material
- 1.1.1. Polyethylene Terephthalate (PET)
- 1.1.2. Polypropylene (PP)
- 1.1.3. Polystyrene (PS) and Expanded Polystyrene (EPS)
- 1.1.4. Polyvinyl Chloride (PVC)
- 1.1.5. Polyethene (PE)
-
1.2. Product
- 1.2.1. Bottles and Jars
- 1.2.2. Trays and Containers
- 1.2.3. Other Product Types
-
1.1. Material
-
2. Flexible Packaging
-
2.1. Material
- 2.1.1. Polyethene (PE)
- 2.1.2. Bi-orientated Polypropylene (BOPP)
- 2.1.3. Cast Polypropylene (CPP)
- 2.1.4. Polyvinyl Chloride (PVC)
- 2.1.5. Other Flexible Packaging Materials
-
2.2. Product
- 2.2.1. Pouches
- 2.2.2. Bags
- 2.2.3. Films and Wraps
- 2.2.4. Other Product Types
-
2.1. Material
-
3. Industrial Plastic Film Market
- 3.1. Stretch Film
- 3.2. Agricultural Film
-
4. End-user Industry
- 4.1. Food
- 4.2. Beverage
- 4.3. Healthcare
- 4.4. Personal Care and Household
- 4.5. Other End-user Industries
Plastic Packaging Industry in Australia Segmentation By Geography
-
1. North America
- 1.1. United States
- 1.2. Canada
- 1.3. Mexico
-
2. South America
- 2.1. Brazil
- 2.2. Argentina
- 2.3. Rest of South America
-
3. Europe
- 3.1. United Kingdom
- 3.2. Germany
- 3.3. France
- 3.4. Italy
- 3.5. Spain
- 3.6. Russia
- 3.7. Benelux
- 3.8. Nordics
- 3.9. Rest of Europe
-
4. Middle East & Africa
- 4.1. Turkey
- 4.2. Israel
- 4.3. GCC
- 4.4. North Africa
- 4.5. South Africa
- 4.6. Rest of Middle East & Africa
-
5. Asia Pacific
- 5.1. China
- 5.2. India
- 5.3. Japan
- 5.4. South Korea
- 5.5. ASEAN
- 5.6. Oceania
- 5.7. Rest of Asia Pacific
Plastic Packaging Industry in Australia REPORT HIGHLIGHTS
| Aspects | Details |
|---|---|
| Study Period | 2019-2033 |
| Base Year | 2024 |
| Estimated Year | 2025 |
| Forecast Period | 2025-2033 |
| Historical Period | 2019-2024 |
| Growth Rate | CAGR of 2.14% from 2019-2033 |
| Segmentation |
|
Table of Contents
- 1. Introduction
- 1.1. Research Scope
- 1.2. Market Segmentation
- 1.3. Research Methodology
- 1.4. Definitions and Assumptions
- 2. Executive Summary
- 2.1. Introduction
- 3. Market Dynamics
- 3.1. Introduction
- 3.2. Market Drivers
- 3.2.1. Increasing Demand from the Food Industry; Increased Eco-friendly Packaging and Recycled Plastics
- 3.3. Market Restrains
- 3.3.1. 4.; Fluctuating Cost of Raw Materials
- 3.4. Market Trends
- 3.4.1. Increasing Demand from the Food Industry
- 4. Market Factor Analysis
- 4.1. Porters Five Forces
- 4.2. Supply/Value Chain
- 4.3. PESTEL analysis
- 4.4. Market Entropy
- 4.5. Patent/Trademark Analysis
- 5. Global Plastic Packaging Industry in Australia Analysis, Insights and Forecast, 2019-2031
- 5.1. Market Analysis, Insights and Forecast - by Rigid Packaging
- 5.1.1. Material
- 5.1.1.1. Polyethylene Terephthalate (PET)
- 5.1.1.2. Polypropylene (PP)
- 5.1.1.3. Polystyrene (PS) and Expanded Polystyrene (EPS)
- 5.1.1.4. Polyvinyl Chloride (PVC)
- 5.1.1.5. Polyethene (PE)
- 5.1.2. Product
- 5.1.2.1. Bottles and Jars
- 5.1.2.2. Trays and Containers
- 5.1.2.3. Other Product Types
- 5.1.1. Material
- 5.2. Market Analysis, Insights and Forecast - by Flexible Packaging
- 5.2.1. Material
- 5.2.1.1. Polyethene (PE)
- 5.2.1.2. Bi-orientated Polypropylene (BOPP)
- 5.2.1.3. Cast Polypropylene (CPP)
- 5.2.1.4. Polyvinyl Chloride (PVC)
- 5.2.1.5. Other Flexible Packaging Materials
- 5.2.2. Product
- 5.2.2.1. Pouches
- 5.2.2.2. Bags
- 5.2.2.3. Films and Wraps
- 5.2.2.4. Other Product Types
- 5.2.1. Material
- 5.3. Market Analysis, Insights and Forecast - by Industrial Plastic Film Market
- 5.3.1. Stretch Film
- 5.3.2. Agricultural Film
- 5.4. Market Analysis, Insights and Forecast - by End-user Industry
- 5.4.1. Food
- 5.4.2. Beverage
- 5.4.3. Healthcare
- 5.4.4. Personal Care and Household
- 5.4.5. Other End-user Industries
- 5.5. Market Analysis, Insights and Forecast - by Region
- 5.5.1. North America
- 5.5.2. South America
- 5.5.3. Europe
- 5.5.4. Middle East & Africa
- 5.5.5. Asia Pacific
- 5.1. Market Analysis, Insights and Forecast - by Rigid Packaging
- 6. North America Plastic Packaging Industry in Australia Analysis, Insights and Forecast, 2019-2031
- 6.1. Market Analysis, Insights and Forecast - by Rigid Packaging
- 6.1.1. Material
- 6.1.1.1. Polyethylene Terephthalate (PET)
- 6.1.1.2. Polypropylene (PP)
- 6.1.1.3. Polystyrene (PS) and Expanded Polystyrene (EPS)
- 6.1.1.4. Polyvinyl Chloride (PVC)
- 6.1.1.5. Polyethene (PE)
- 6.1.2. Product
- 6.1.2.1. Bottles and Jars
- 6.1.2.2. Trays and Containers
- 6.1.2.3. Other Product Types
- 6.1.1. Material
- 6.2. Market Analysis, Insights and Forecast - by Flexible Packaging
- 6.2.1. Material
- 6.2.1.1. Polyethene (PE)
- 6.2.1.2. Bi-orientated Polypropylene (BOPP)
- 6.2.1.3. Cast Polypropylene (CPP)
- 6.2.1.4. Polyvinyl Chloride (PVC)
- 6.2.1.5. Other Flexible Packaging Materials
- 6.2.2. Product
- 6.2.2.1. Pouches
- 6.2.2.2. Bags
- 6.2.2.3. Films and Wraps
- 6.2.2.4. Other Product Types
- 6.2.1. Material
- 6.3. Market Analysis, Insights and Forecast - by Industrial Plastic Film Market
- 6.3.1. Stretch Film
- 6.3.2. Agricultural Film
- 6.4. Market Analysis, Insights and Forecast - by End-user Industry
- 6.4.1. Food
- 6.4.2. Beverage
- 6.4.3. Healthcare
- 6.4.4. Personal Care and Household
- 6.4.5. Other End-user Industries
- 6.1. Market Analysis, Insights and Forecast - by Rigid Packaging
- 7. South America Plastic Packaging Industry in Australia Analysis, Insights and Forecast, 2019-2031
- 7.1. Market Analysis, Insights and Forecast - by Rigid Packaging
- 7.1.1. Material
- 7.1.1.1. Polyethylene Terephthalate (PET)
- 7.1.1.2. Polypropylene (PP)
- 7.1.1.3. Polystyrene (PS) and Expanded Polystyrene (EPS)
- 7.1.1.4. Polyvinyl Chloride (PVC)
- 7.1.1.5. Polyethene (PE)
- 7.1.2. Product
- 7.1.2.1. Bottles and Jars
- 7.1.2.2. Trays and Containers
- 7.1.2.3. Other Product Types
- 7.1.1. Material
- 7.2. Market Analysis, Insights and Forecast - by Flexible Packaging
- 7.2.1. Material
- 7.2.1.1. Polyethene (PE)
- 7.2.1.2. Bi-orientated Polypropylene (BOPP)
- 7.2.1.3. Cast Polypropylene (CPP)
- 7.2.1.4. Polyvinyl Chloride (PVC)
- 7.2.1.5. Other Flexible Packaging Materials
- 7.2.2. Product
- 7.2.2.1. Pouches
- 7.2.2.2. Bags
- 7.2.2.3. Films and Wraps
- 7.2.2.4. Other Product Types
- 7.2.1. Material
- 7.3. Market Analysis, Insights and Forecast - by Industrial Plastic Film Market
- 7.3.1. Stretch Film
- 7.3.2. Agricultural Film
- 7.4. Market Analysis, Insights and Forecast - by End-user Industry
- 7.4.1. Food
- 7.4.2. Beverage
- 7.4.3. Healthcare
- 7.4.4. Personal Care and Household
- 7.4.5. Other End-user Industries
- 7.1. Market Analysis, Insights and Forecast - by Rigid Packaging
- 8. Europe Plastic Packaging Industry in Australia Analysis, Insights and Forecast, 2019-2031
- 8.1. Market Analysis, Insights and Forecast - by Rigid Packaging
- 8.1.1. Material
- 8.1.1.1. Polyethylene Terephthalate (PET)
- 8.1.1.2. Polypropylene (PP)
- 8.1.1.3. Polystyrene (PS) and Expanded Polystyrene (EPS)
- 8.1.1.4. Polyvinyl Chloride (PVC)
- 8.1.1.5. Polyethene (PE)
- 8.1.2. Product
- 8.1.2.1. Bottles and Jars
- 8.1.2.2. Trays and Containers
- 8.1.2.3. Other Product Types
- 8.1.1. Material
- 8.2. Market Analysis, Insights and Forecast - by Flexible Packaging
- 8.2.1. Material
- 8.2.1.1. Polyethene (PE)
- 8.2.1.2. Bi-orientated Polypropylene (BOPP)
- 8.2.1.3. Cast Polypropylene (CPP)
- 8.2.1.4. Polyvinyl Chloride (PVC)
- 8.2.1.5. Other Flexible Packaging Materials
- 8.2.2. Product
- 8.2.2.1. Pouches
- 8.2.2.2. Bags
- 8.2.2.3. Films and Wraps
- 8.2.2.4. Other Product Types
- 8.2.1. Material
- 8.3. Market Analysis, Insights and Forecast - by Industrial Plastic Film Market
- 8.3.1. Stretch Film
- 8.3.2. Agricultural Film
- 8.4. Market Analysis, Insights and Forecast - by End-user Industry
- 8.4.1. Food
- 8.4.2. Beverage
- 8.4.3. Healthcare
- 8.4.4. Personal Care and Household
- 8.4.5. Other End-user Industries
- 8.1. Market Analysis, Insights and Forecast - by Rigid Packaging
- 9. Middle East & Africa Plastic Packaging Industry in Australia Analysis, Insights and Forecast, 2019-2031
- 9.1. Market Analysis, Insights and Forecast - by Rigid Packaging
- 9.1.1. Material
- 9.1.1.1. Polyethylene Terephthalate (PET)
- 9.1.1.2. Polypropylene (PP)
- 9.1.1.3. Polystyrene (PS) and Expanded Polystyrene (EPS)
- 9.1.1.4. Polyvinyl Chloride (PVC)
- 9.1.1.5. Polyethene (PE)
- 9.1.2. Product
- 9.1.2.1. Bottles and Jars
- 9.1.2.2. Trays and Containers
- 9.1.2.3. Other Product Types
- 9.1.1. Material
- 9.2. Market Analysis, Insights and Forecast - by Flexible Packaging
- 9.2.1. Material
- 9.2.1.1. Polyethene (PE)
- 9.2.1.2. Bi-orientated Polypropylene (BOPP)
- 9.2.1.3. Cast Polypropylene (CPP)
- 9.2.1.4. Polyvinyl Chloride (PVC)
- 9.2.1.5. Other Flexible Packaging Materials
- 9.2.2. Product
- 9.2.2.1. Pouches
- 9.2.2.2. Bags
- 9.2.2.3. Films and Wraps
- 9.2.2.4. Other Product Types
- 9.2.1. Material
- 9.3. Market Analysis, Insights and Forecast - by Industrial Plastic Film Market
- 9.3.1. Stretch Film
- 9.3.2. Agricultural Film
- 9.4. Market Analysis, Insights and Forecast - by End-user Industry
- 9.4.1. Food
- 9.4.2. Beverage
- 9.4.3. Healthcare
- 9.4.4. Personal Care and Household
- 9.4.5. Other End-user Industries
- 9.1. Market Analysis, Insights and Forecast - by Rigid Packaging
- 10. Asia Pacific Plastic Packaging Industry in Australia Analysis, Insights and Forecast, 2019-2031
- 10.1. Market Analysis, Insights and Forecast - by Rigid Packaging
- 10.1.1. Material
- 10.1.1.1. Polyethylene Terephthalate (PET)
- 10.1.1.2. Polypropylene (PP)
- 10.1.1.3. Polystyrene (PS) and Expanded Polystyrene (EPS)
- 10.1.1.4. Polyvinyl Chloride (PVC)
- 10.1.1.5. Polyethene (PE)
- 10.1.2. Product
- 10.1.2.1. Bottles and Jars
- 10.1.2.2. Trays and Containers
- 10.1.2.3. Other Product Types
- 10.1.1. Material
- 10.2. Market Analysis, Insights and Forecast - by Flexible Packaging
- 10.2.1. Material
- 10.2.1.1. Polyethene (PE)
- 10.2.1.2. Bi-orientated Polypropylene (BOPP)
- 10.2.1.3. Cast Polypropylene (CPP)
- 10.2.1.4. Polyvinyl Chloride (PVC)
- 10.2.1.5. Other Flexible Packaging Materials
- 10.2.2. Product
- 10.2.2.1. Pouches
- 10.2.2.2. Bags
- 10.2.2.3. Films and Wraps
- 10.2.2.4. Other Product Types
- 10.2.1. Material
- 10.3. Market Analysis, Insights and Forecast - by Industrial Plastic Film Market
- 10.3.1. Stretch Film
- 10.3.2. Agricultural Film
- 10.4. Market Analysis, Insights and Forecast - by End-user Industry
- 10.4.1. Food
- 10.4.2. Beverage
- 10.4.3. Healthcare
- 10.4.4. Personal Care and Household
- 10.4.5. Other End-user Industries
- 10.1. Market Analysis, Insights and Forecast - by Rigid Packaging
- 11. Competitive Analysis
- 11.1. Global Market Share Analysis 2024
- 11.2. Company Profiles
- 11.2.1 Visy Industries Australia Pty Ltd
- 11.2.1.1. Overview
- 11.2.1.2. Products
- 11.2.1.3. SWOT Analysis
- 11.2.1.4. Recent Developments
- 11.2.1.5. Financials (Based on Availability)
- 11.2.2 Gravure Packaging Ltd
- 11.2.2.1. Overview
- 11.2.2.2. Products
- 11.2.2.3. SWOT Analysis
- 11.2.2.4. Recent Developments
- 11.2.2.5. Financials (Based on Availability)
- 11.2.3 Cospak Pty Ltd
- 11.2.3.1. Overview
- 11.2.3.2. Products
- 11.2.3.3. SWOT Analysis
- 11.2.3.4. Recent Developments
- 11.2.3.5. Financials (Based on Availability)
- 11.2.4 Plasmo Pty Ltd*List Not Exhaustive
- 11.2.4.1. Overview
- 11.2.4.2. Products
- 11.2.4.3. SWOT Analysis
- 11.2.4.4. Recent Developments
- 11.2.4.5. Financials (Based on Availability)
- 11.2.5 Flexible Packaging Solutions Pty Ltd
- 11.2.5.1. Overview
- 11.2.5.2. Products
- 11.2.5.3. SWOT Analysis
- 11.2.5.4. Recent Developments
- 11.2.5.5. Financials (Based on Availability)
- 11.2.6 Orora Packaging Australia Pty Ltd
- 11.2.6.1. Overview
- 11.2.6.2. Products
- 11.2.6.3. SWOT Analysis
- 11.2.6.4. Recent Developments
- 11.2.6.5. Financials (Based on Availability)
- 11.2.7 A&M Packaging Pty Ltd
- 11.2.7.1. Overview
- 11.2.7.2. Products
- 11.2.7.3. SWOT Analysis
- 11.2.7.4. Recent Developments
- 11.2.7.5. Financials (Based on Availability)
- 11.2.8 Pact Group Holdings Australia Pty Ltd
- 11.2.8.1. Overview
- 11.2.8.2. Products
- 11.2.8.3. SWOT Analysis
- 11.2.8.4. Recent Developments
- 11.2.8.5. Financials (Based on Availability)
- 11.2.9 Caspak Products Pty Ltd
- 11.2.9.1. Overview
- 11.2.9.2. Products
- 11.2.9.3. SWOT Analysis
- 11.2.9.4. Recent Developments
- 11.2.9.5. Financials (Based on Availability)
- 11.2.10 Synergy Packaging (RPC Group)
- 11.2.10.1. Overview
- 11.2.10.2. Products
- 11.2.10.3. SWOT Analysis
- 11.2.10.4. Recent Developments
- 11.2.10.5. Financials (Based on Availability)
- 11.2.11 Pro-Pac Packaging Pty Ltd
- 11.2.11.1. Overview
- 11.2.11.2. Products
- 11.2.11.3. SWOT Analysis
- 11.2.11.4. Recent Developments
- 11.2.11.5. Financials (Based on Availability)
- 11.2.12 Filton Packaging Pty Ltd
- 11.2.12.1. Overview
- 11.2.12.2. Products
- 11.2.12.3. SWOT Analysis
- 11.2.12.4. Recent Developments
- 11.2.12.5. Financials (Based on Availability)
- 11.2.13 Econopak Flexible Packaging
- 11.2.13.1. Overview
- 11.2.13.2. Products
- 11.2.13.3. SWOT Analysis
- 11.2.13.4. Recent Developments
- 11.2.13.5. Financials (Based on Availability)
- 11.2.14 Vacupack Pty Ltd
- 11.2.14.1. Overview
- 11.2.14.2. Products
- 11.2.14.3. SWOT Analysis
- 11.2.14.4. Recent Developments
- 11.2.14.5. Financials (Based on Availability)
- 11.2.1 Visy Industries Australia Pty Ltd
List of Figures
- Figure 1: Global Plastic Packaging Industry in Australia Revenue Breakdown (Million, %) by Region 2024 & 2032
- Figure 2: Global Plastic Packaging Industry in Australia Volume Breakdown (K Tons, %) by Region 2024 & 2032
- Figure 3: Australia Plastic Packaging Industry in Australia Revenue (Million), by Country 2024 & 2032
- Figure 4: Australia Plastic Packaging Industry in Australia Volume (K Tons), by Country 2024 & 2032
- Figure 5: Australia Plastic Packaging Industry in Australia Revenue Share (%), by Country 2024 & 2032
- Figure 6: Australia Plastic Packaging Industry in Australia Volume Share (%), by Country 2024 & 2032
- Figure 7: North America Plastic Packaging Industry in Australia Revenue (Million), by Rigid Packaging 2024 & 2032
- Figure 8: North America Plastic Packaging Industry in Australia Volume (K Tons), by Rigid Packaging 2024 & 2032
- Figure 9: North America Plastic Packaging Industry in Australia Revenue Share (%), by Rigid Packaging 2024 & 2032
- Figure 10: North America Plastic Packaging Industry in Australia Volume Share (%), by Rigid Packaging 2024 & 2032
- Figure 11: North America Plastic Packaging Industry in Australia Revenue (Million), by Flexible Packaging 2024 & 2032
- Figure 12: North America Plastic Packaging Industry in Australia Volume (K Tons), by Flexible Packaging 2024 & 2032
- Figure 13: North America Plastic Packaging Industry in Australia Revenue Share (%), by Flexible Packaging 2024 & 2032
- Figure 14: North America Plastic Packaging Industry in Australia Volume Share (%), by Flexible Packaging 2024 & 2032
- Figure 15: North America Plastic Packaging Industry in Australia Revenue (Million), by Industrial Plastic Film Market 2024 & 2032
- Figure 16: North America Plastic Packaging Industry in Australia Volume (K Tons), by Industrial Plastic Film Market 2024 & 2032
- Figure 17: North America Plastic Packaging Industry in Australia Revenue Share (%), by Industrial Plastic Film Market 2024 & 2032
- Figure 18: North America Plastic Packaging Industry in Australia Volume Share (%), by Industrial Plastic Film Market 2024 & 2032
- Figure 19: North America Plastic Packaging Industry in Australia Revenue (Million), by End-user Industry 2024 & 2032
- Figure 20: North America Plastic Packaging Industry in Australia Volume (K Tons), by End-user Industry 2024 & 2032
- Figure 21: North America Plastic Packaging Industry in Australia Revenue Share (%), by End-user Industry 2024 & 2032
- Figure 22: North America Plastic Packaging Industry in Australia Volume Share (%), by End-user Industry 2024 & 2032
- Figure 23: North America Plastic Packaging Industry in Australia Revenue (Million), by Country 2024 & 2032
- Figure 24: North America Plastic Packaging Industry in Australia Volume (K Tons), by Country 2024 & 2032
- Figure 25: North America Plastic Packaging Industry in Australia Revenue Share (%), by Country 2024 & 2032
- Figure 26: North America Plastic Packaging Industry in Australia Volume Share (%), by Country 2024 & 2032
- Figure 27: South America Plastic Packaging Industry in Australia Revenue (Million), by Rigid Packaging 2024 & 2032
- Figure 28: South America Plastic Packaging Industry in Australia Volume (K Tons), by Rigid Packaging 2024 & 2032
- Figure 29: South America Plastic Packaging Industry in Australia Revenue Share (%), by Rigid Packaging 2024 & 2032
- Figure 30: South America Plastic Packaging Industry in Australia Volume Share (%), by Rigid Packaging 2024 & 2032
- Figure 31: South America Plastic Packaging Industry in Australia Revenue (Million), by Flexible Packaging 2024 & 2032
- Figure 32: South America Plastic Packaging Industry in Australia Volume (K Tons), by Flexible Packaging 2024 & 2032
- Figure 33: South America Plastic Packaging Industry in Australia Revenue Share (%), by Flexible Packaging 2024 & 2032
- Figure 34: South America Plastic Packaging Industry in Australia Volume Share (%), by Flexible Packaging 2024 & 2032
- Figure 35: South America Plastic Packaging Industry in Australia Revenue (Million), by Industrial Plastic Film Market 2024 & 2032
- Figure 36: South America Plastic Packaging Industry in Australia Volume (K Tons), by Industrial Plastic Film Market 2024 & 2032
- Figure 37: South America Plastic Packaging Industry in Australia Revenue Share (%), by Industrial Plastic Film Market 2024 & 2032
- Figure 38: South America Plastic Packaging Industry in Australia Volume Share (%), by Industrial Plastic Film Market 2024 & 2032
- Figure 39: South America Plastic Packaging Industry in Australia Revenue (Million), by End-user Industry 2024 & 2032
- Figure 40: South America Plastic Packaging Industry in Australia Volume (K Tons), by End-user Industry 2024 & 2032
- Figure 41: South America Plastic Packaging Industry in Australia Revenue Share (%), by End-user Industry 2024 & 2032
- Figure 42: South America Plastic Packaging Industry in Australia Volume Share (%), by End-user Industry 2024 & 2032
- Figure 43: South America Plastic Packaging Industry in Australia Revenue (Million), by Country 2024 & 2032
- Figure 44: South America Plastic Packaging Industry in Australia Volume (K Tons), by Country 2024 & 2032
- Figure 45: South America Plastic Packaging Industry in Australia Revenue Share (%), by Country 2024 & 2032
- Figure 46: South America Plastic Packaging Industry in Australia Volume Share (%), by Country 2024 & 2032
- Figure 47: Europe Plastic Packaging Industry in Australia Revenue (Million), by Rigid Packaging 2024 & 2032
- Figure 48: Europe Plastic Packaging Industry in Australia Volume (K Tons), by Rigid Packaging 2024 & 2032
- Figure 49: Europe Plastic Packaging Industry in Australia Revenue Share (%), by Rigid Packaging 2024 & 2032
- Figure 50: Europe Plastic Packaging Industry in Australia Volume Share (%), by Rigid Packaging 2024 & 2032
- Figure 51: Europe Plastic Packaging Industry in Australia Revenue (Million), by Flexible Packaging 2024 & 2032
- Figure 52: Europe Plastic Packaging Industry in Australia Volume (K Tons), by Flexible Packaging 2024 & 2032
- Figure 53: Europe Plastic Packaging Industry in Australia Revenue Share (%), by Flexible Packaging 2024 & 2032
- Figure 54: Europe Plastic Packaging Industry in Australia Volume Share (%), by Flexible Packaging 2024 & 2032
- Figure 55: Europe Plastic Packaging Industry in Australia Revenue (Million), by Industrial Plastic Film Market 2024 & 2032
- Figure 56: Europe Plastic Packaging Industry in Australia Volume (K Tons), by Industrial Plastic Film Market 2024 & 2032
- Figure 57: Europe Plastic Packaging Industry in Australia Revenue Share (%), by Industrial Plastic Film Market 2024 & 2032
- Figure 58: Europe Plastic Packaging Industry in Australia Volume Share (%), by Industrial Plastic Film Market 2024 & 2032
- Figure 59: Europe Plastic Packaging Industry in Australia Revenue (Million), by End-user Industry 2024 & 2032
- Figure 60: Europe Plastic Packaging Industry in Australia Volume (K Tons), by End-user Industry 2024 & 2032
- Figure 61: Europe Plastic Packaging Industry in Australia Revenue Share (%), by End-user Industry 2024 & 2032
- Figure 62: Europe Plastic Packaging Industry in Australia Volume Share (%), by End-user Industry 2024 & 2032
- Figure 63: Europe Plastic Packaging Industry in Australia Revenue (Million), by Country 2024 & 2032
- Figure 64: Europe Plastic Packaging Industry in Australia Volume (K Tons), by Country 2024 & 2032
- Figure 65: Europe Plastic Packaging Industry in Australia Revenue Share (%), by Country 2024 & 2032
- Figure 66: Europe Plastic Packaging Industry in Australia Volume Share (%), by Country 2024 & 2032
- Figure 67: Middle East & Africa Plastic Packaging Industry in Australia Revenue (Million), by Rigid Packaging 2024 & 2032
- Figure 68: Middle East & Africa Plastic Packaging Industry in Australia Volume (K Tons), by Rigid Packaging 2024 & 2032
- Figure 69: Middle East & Africa Plastic Packaging Industry in Australia Revenue Share (%), by Rigid Packaging 2024 & 2032
- Figure 70: Middle East & Africa Plastic Packaging Industry in Australia Volume Share (%), by Rigid Packaging 2024 & 2032
- Figure 71: Middle East & Africa Plastic Packaging Industry in Australia Revenue (Million), by Flexible Packaging 2024 & 2032
- Figure 72: Middle East & Africa Plastic Packaging Industry in Australia Volume (K Tons), by Flexible Packaging 2024 & 2032
- Figure 73: Middle East & Africa Plastic Packaging Industry in Australia Revenue Share (%), by Flexible Packaging 2024 & 2032
- Figure 74: Middle East & Africa Plastic Packaging Industry in Australia Volume Share (%), by Flexible Packaging 2024 & 2032
- Figure 75: Middle East & Africa Plastic Packaging Industry in Australia Revenue (Million), by Industrial Plastic Film Market 2024 & 2032
- Figure 76: Middle East & Africa Plastic Packaging Industry in Australia Volume (K Tons), by Industrial Plastic Film Market 2024 & 2032
- Figure 77: Middle East & Africa Plastic Packaging Industry in Australia Revenue Share (%), by Industrial Plastic Film Market 2024 & 2032
- Figure 78: Middle East & Africa Plastic Packaging Industry in Australia Volume Share (%), by Industrial Plastic Film Market 2024 & 2032
- Figure 79: Middle East & Africa Plastic Packaging Industry in Australia Revenue (Million), by End-user Industry 2024 & 2032
- Figure 80: Middle East & Africa Plastic Packaging Industry in Australia Volume (K Tons), by End-user Industry 2024 & 2032
- Figure 81: Middle East & Africa Plastic Packaging Industry in Australia Revenue Share (%), by End-user Industry 2024 & 2032
- Figure 82: Middle East & Africa Plastic Packaging Industry in Australia Volume Share (%), by End-user Industry 2024 & 2032
- Figure 83: Middle East & Africa Plastic Packaging Industry in Australia Revenue (Million), by Country 2024 & 2032
- Figure 84: Middle East & Africa Plastic Packaging Industry in Australia Volume (K Tons), by Country 2024 & 2032
- Figure 85: Middle East & Africa Plastic Packaging Industry in Australia Revenue Share (%), by Country 2024 & 2032
- Figure 86: Middle East & Africa Plastic Packaging Industry in Australia Volume Share (%), by Country 2024 & 2032
- Figure 87: Asia Pacific Plastic Packaging Industry in Australia Revenue (Million), by Rigid Packaging 2024 & 2032
- Figure 88: Asia Pacific Plastic Packaging Industry in Australia Volume (K Tons), by Rigid Packaging 2024 & 2032
- Figure 89: Asia Pacific Plastic Packaging Industry in Australia Revenue Share (%), by Rigid Packaging 2024 & 2032
- Figure 90: Asia Pacific Plastic Packaging Industry in Australia Volume Share (%), by Rigid Packaging 2024 & 2032
- Figure 91: Asia Pacific Plastic Packaging Industry in Australia Revenue (Million), by Flexible Packaging 2024 & 2032
- Figure 92: Asia Pacific Plastic Packaging Industry in Australia Volume (K Tons), by Flexible Packaging 2024 & 2032
- Figure 93: Asia Pacific Plastic Packaging Industry in Australia Revenue Share (%), by Flexible Packaging 2024 & 2032
- Figure 94: Asia Pacific Plastic Packaging Industry in Australia Volume Share (%), by Flexible Packaging 2024 & 2032
- Figure 95: Asia Pacific Plastic Packaging Industry in Australia Revenue (Million), by Industrial Plastic Film Market 2024 & 2032
- Figure 96: Asia Pacific Plastic Packaging Industry in Australia Volume (K Tons), by Industrial Plastic Film Market 2024 & 2032
- Figure 97: Asia Pacific Plastic Packaging Industry in Australia Revenue Share (%), by Industrial Plastic Film Market 2024 & 2032
- Figure 98: Asia Pacific Plastic Packaging Industry in Australia Volume Share (%), by Industrial Plastic Film Market 2024 & 2032
- Figure 99: Asia Pacific Plastic Packaging Industry in Australia Revenue (Million), by End-user Industry 2024 & 2032
- Figure 100: Asia Pacific Plastic Packaging Industry in Australia Volume (K Tons), by End-user Industry 2024 & 2032
- Figure 101: Asia Pacific Plastic Packaging Industry in Australia Revenue Share (%), by End-user Industry 2024 & 2032
- Figure 102: Asia Pacific Plastic Packaging Industry in Australia Volume Share (%), by End-user Industry 2024 & 2032
- Figure 103: Asia Pacific Plastic Packaging Industry in Australia Revenue (Million), by Country 2024 & 2032
- Figure 104: Asia Pacific Plastic Packaging Industry in Australia Volume (K Tons), by Country 2024 & 2032
- Figure 105: Asia Pacific Plastic Packaging Industry in Australia Revenue Share (%), by Country 2024 & 2032
- Figure 106: Asia Pacific Plastic Packaging Industry in Australia Volume Share (%), by Country 2024 & 2032
List of Tables
- Table 1: Global Plastic Packaging Industry in Australia Revenue Million Forecast, by Region 2019 & 2032
- Table 2: Global Plastic Packaging Industry in Australia Volume K Tons Forecast, by Region 2019 & 2032
- Table 3: Global Plastic Packaging Industry in Australia Revenue Million Forecast, by Rigid Packaging 2019 & 2032
- Table 4: Global Plastic Packaging Industry in Australia Volume K Tons Forecast, by Rigid Packaging 2019 & 2032
- Table 5: Global Plastic Packaging Industry in Australia Revenue Million Forecast, by Flexible Packaging 2019 & 2032
- Table 6: Global Plastic Packaging Industry in Australia Volume K Tons Forecast, by Flexible Packaging 2019 & 2032
- Table 7: Global Plastic Packaging Industry in Australia Revenue Million Forecast, by Industrial Plastic Film Market 2019 & 2032
- Table 8: Global Plastic Packaging Industry in Australia Volume K Tons Forecast, by Industrial Plastic Film Market 2019 & 2032
- Table 9: Global Plastic Packaging Industry in Australia Revenue Million Forecast, by End-user Industry 2019 & 2032
- Table 10: Global Plastic Packaging Industry in Australia Volume K Tons Forecast, by End-user Industry 2019 & 2032
- Table 11: Global Plastic Packaging Industry in Australia Revenue Million Forecast, by Region 2019 & 2032
- Table 12: Global Plastic Packaging Industry in Australia Volume K Tons Forecast, by Region 2019 & 2032
- Table 13: Global Plastic Packaging Industry in Australia Revenue Million Forecast, by Country 2019 & 2032
- Table 14: Global Plastic Packaging Industry in Australia Volume K Tons Forecast, by Country 2019 & 2032
- Table 15: Global Plastic Packaging Industry in Australia Revenue Million Forecast, by Rigid Packaging 2019 & 2032
- Table 16: Global Plastic Packaging Industry in Australia Volume K Tons Forecast, by Rigid Packaging 2019 & 2032
- Table 17: Global Plastic Packaging Industry in Australia Revenue Million Forecast, by Flexible Packaging 2019 & 2032
- Table 18: Global Plastic Packaging Industry in Australia Volume K Tons Forecast, by Flexible Packaging 2019 & 2032
- Table 19: Global Plastic Packaging Industry in Australia Revenue Million Forecast, by Industrial Plastic Film Market 2019 & 2032
- Table 20: Global Plastic Packaging Industry in Australia Volume K Tons Forecast, by Industrial Plastic Film Market 2019 & 2032
- Table 21: Global Plastic Packaging Industry in Australia Revenue Million Forecast, by End-user Industry 2019 & 2032
- Table 22: Global Plastic Packaging Industry in Australia Volume K Tons Forecast, by End-user Industry 2019 & 2032
- Table 23: Global Plastic Packaging Industry in Australia Revenue Million Forecast, by Country 2019 & 2032
- Table 24: Global Plastic Packaging Industry in Australia Volume K Tons Forecast, by Country 2019 & 2032
- Table 25: United States Plastic Packaging Industry in Australia Revenue (Million) Forecast, by Application 2019 & 2032
- Table 26: United States Plastic Packaging Industry in Australia Volume (K Tons) Forecast, by Application 2019 & 2032
- Table 27: Canada Plastic Packaging Industry in Australia Revenue (Million) Forecast, by Application 2019 & 2032
- Table 28: Canada Plastic Packaging Industry in Australia Volume (K Tons) Forecast, by Application 2019 & 2032
- Table 29: Mexico Plastic Packaging Industry in Australia Revenue (Million) Forecast, by Application 2019 & 2032
- Table 30: Mexico Plastic Packaging Industry in Australia Volume (K Tons) Forecast, by Application 2019 & 2032
- Table 31: Global Plastic Packaging Industry in Australia Revenue Million Forecast, by Rigid Packaging 2019 & 2032
- Table 32: Global Plastic Packaging Industry in Australia Volume K Tons Forecast, by Rigid Packaging 2019 & 2032
- Table 33: Global Plastic Packaging Industry in Australia Revenue Million Forecast, by Flexible Packaging 2019 & 2032
- Table 34: Global Plastic Packaging Industry in Australia Volume K Tons Forecast, by Flexible Packaging 2019 & 2032
- Table 35: Global Plastic Packaging Industry in Australia Revenue Million Forecast, by Industrial Plastic Film Market 2019 & 2032
- Table 36: Global Plastic Packaging Industry in Australia Volume K Tons Forecast, by Industrial Plastic Film Market 2019 & 2032
- Table 37: Global Plastic Packaging Industry in Australia Revenue Million Forecast, by End-user Industry 2019 & 2032
- Table 38: Global Plastic Packaging Industry in Australia Volume K Tons Forecast, by End-user Industry 2019 & 2032
- Table 39: Global Plastic Packaging Industry in Australia Revenue Million Forecast, by Country 2019 & 2032
- Table 40: Global Plastic Packaging Industry in Australia Volume K Tons Forecast, by Country 2019 & 2032
- Table 41: Brazil Plastic Packaging Industry in Australia Revenue (Million) Forecast, by Application 2019 & 2032
- Table 42: Brazil Plastic Packaging Industry in Australia Volume (K Tons) Forecast, by Application 2019 & 2032
- Table 43: Argentina Plastic Packaging Industry in Australia Revenue (Million) Forecast, by Application 2019 & 2032
- Table 44: Argentina Plastic Packaging Industry in Australia Volume (K Tons) Forecast, by Application 2019 & 2032
- Table 45: Rest of South America Plastic Packaging Industry in Australia Revenue (Million) Forecast, by Application 2019 & 2032
- Table 46: Rest of South America Plastic Packaging Industry in Australia Volume (K Tons) Forecast, by Application 2019 & 2032
- Table 47: Global Plastic Packaging Industry in Australia Revenue Million Forecast, by Rigid Packaging 2019 & 2032
- Table 48: Global Plastic Packaging Industry in Australia Volume K Tons Forecast, by Rigid Packaging 2019 & 2032
- Table 49: Global Plastic Packaging Industry in Australia Revenue Million Forecast, by Flexible Packaging 2019 & 2032
- Table 50: Global Plastic Packaging Industry in Australia Volume K Tons Forecast, by Flexible Packaging 2019 & 2032
- Table 51: Global Plastic Packaging Industry in Australia Revenue Million Forecast, by Industrial Plastic Film Market 2019 & 2032
- Table 52: Global Plastic Packaging Industry in Australia Volume K Tons Forecast, by Industrial Plastic Film Market 2019 & 2032
- Table 53: Global Plastic Packaging Industry in Australia Revenue Million Forecast, by End-user Industry 2019 & 2032
- Table 54: Global Plastic Packaging Industry in Australia Volume K Tons Forecast, by End-user Industry 2019 & 2032
- Table 55: Global Plastic Packaging Industry in Australia Revenue Million Forecast, by Country 2019 & 2032
- Table 56: Global Plastic Packaging Industry in Australia Volume K Tons Forecast, by Country 2019 & 2032
- Table 57: United Kingdom Plastic Packaging Industry in Australia Revenue (Million) Forecast, by Application 2019 & 2032
- Table 58: United Kingdom Plastic Packaging Industry in Australia Volume (K Tons) Forecast, by Application 2019 & 2032
- Table 59: Germany Plastic Packaging Industry in Australia Revenue (Million) Forecast, by Application 2019 & 2032
- Table 60: Germany Plastic Packaging Industry in Australia Volume (K Tons) Forecast, by Application 2019 & 2032
- Table 61: France Plastic Packaging Industry in Australia Revenue (Million) Forecast, by Application 2019 & 2032
- Table 62: France Plastic Packaging Industry in Australia Volume (K Tons) Forecast, by Application 2019 & 2032
- Table 63: Italy Plastic Packaging Industry in Australia Revenue (Million) Forecast, by Application 2019 & 2032
- Table 64: Italy Plastic Packaging Industry in Australia Volume (K Tons) Forecast, by Application 2019 & 2032
- Table 65: Spain Plastic Packaging Industry in Australia Revenue (Million) Forecast, by Application 2019 & 2032
- Table 66: Spain Plastic Packaging Industry in Australia Volume (K Tons) Forecast, by Application 2019 & 2032
- Table 67: Russia Plastic Packaging Industry in Australia Revenue (Million) Forecast, by Application 2019 & 2032
- Table 68: Russia Plastic Packaging Industry in Australia Volume (K Tons) Forecast, by Application 2019 & 2032
- Table 69: Benelux Plastic Packaging Industry in Australia Revenue (Million) Forecast, by Application 2019 & 2032
- Table 70: Benelux Plastic Packaging Industry in Australia Volume (K Tons) Forecast, by Application 2019 & 2032
- Table 71: Nordics Plastic Packaging Industry in Australia Revenue (Million) Forecast, by Application 2019 & 2032
- Table 72: Nordics Plastic Packaging Industry in Australia Volume (K Tons) Forecast, by Application 2019 & 2032
- Table 73: Rest of Europe Plastic Packaging Industry in Australia Revenue (Million) Forecast, by Application 2019 & 2032
- Table 74: Rest of Europe Plastic Packaging Industry in Australia Volume (K Tons) Forecast, by Application 2019 & 2032
- Table 75: Global Plastic Packaging Industry in Australia Revenue Million Forecast, by Rigid Packaging 2019 & 2032
- Table 76: Global Plastic Packaging Industry in Australia Volume K Tons Forecast, by Rigid Packaging 2019 & 2032
- Table 77: Global Plastic Packaging Industry in Australia Revenue Million Forecast, by Flexible Packaging 2019 & 2032
- Table 78: Global Plastic Packaging Industry in Australia Volume K Tons Forecast, by Flexible Packaging 2019 & 2032
- Table 79: Global Plastic Packaging Industry in Australia Revenue Million Forecast, by Industrial Plastic Film Market 2019 & 2032
- Table 80: Global Plastic Packaging Industry in Australia Volume K Tons Forecast, by Industrial Plastic Film Market 2019 & 2032
- Table 81: Global Plastic Packaging Industry in Australia Revenue Million Forecast, by End-user Industry 2019 & 2032
- Table 82: Global Plastic Packaging Industry in Australia Volume K Tons Forecast, by End-user Industry 2019 & 2032
- Table 83: Global Plastic Packaging Industry in Australia Revenue Million Forecast, by Country 2019 & 2032
- Table 84: Global Plastic Packaging Industry in Australia Volume K Tons Forecast, by Country 2019 & 2032
- Table 85: Turkey Plastic Packaging Industry in Australia Revenue (Million) Forecast, by Application 2019 & 2032
- Table 86: Turkey Plastic Packaging Industry in Australia Volume (K Tons) Forecast, by Application 2019 & 2032
- Table 87: Israel Plastic Packaging Industry in Australia Revenue (Million) Forecast, by Application 2019 & 2032
- Table 88: Israel Plastic Packaging Industry in Australia Volume (K Tons) Forecast, by Application 2019 & 2032
- Table 89: GCC Plastic Packaging Industry in Australia Revenue (Million) Forecast, by Application 2019 & 2032
- Table 90: GCC Plastic Packaging Industry in Australia Volume (K Tons) Forecast, by Application 2019 & 2032
- Table 91: North Africa Plastic Packaging Industry in Australia Revenue (Million) Forecast, by Application 2019 & 2032
- Table 92: North Africa Plastic Packaging Industry in Australia Volume (K Tons) Forecast, by Application 2019 & 2032
- Table 93: South Africa Plastic Packaging Industry in Australia Revenue (Million) Forecast, by Application 2019 & 2032
- Table 94: South Africa Plastic Packaging Industry in Australia Volume (K Tons) Forecast, by Application 2019 & 2032
- Table 95: Rest of Middle East & Africa Plastic Packaging Industry in Australia Revenue (Million) Forecast, by Application 2019 & 2032
- Table 96: Rest of Middle East & Africa Plastic Packaging Industry in Australia Volume (K Tons) Forecast, by Application 2019 & 2032
- Table 97: Global Plastic Packaging Industry in Australia Revenue Million Forecast, by Rigid Packaging 2019 & 2032
- Table 98: Global Plastic Packaging Industry in Australia Volume K Tons Forecast, by Rigid Packaging 2019 & 2032
- Table 99: Global Plastic Packaging Industry in Australia Revenue Million Forecast, by Flexible Packaging 2019 & 2032
- Table 100: Global Plastic Packaging Industry in Australia Volume K Tons Forecast, by Flexible Packaging 2019 & 2032
- Table 101: Global Plastic Packaging Industry in Australia Revenue Million Forecast, by Industrial Plastic Film Market 2019 & 2032
- Table 102: Global Plastic Packaging Industry in Australia Volume K Tons Forecast, by Industrial Plastic Film Market 2019 & 2032
- Table 103: Global Plastic Packaging Industry in Australia Revenue Million Forecast, by End-user Industry 2019 & 2032
- Table 104: Global Plastic Packaging Industry in Australia Volume K Tons Forecast, by End-user Industry 2019 & 2032
- Table 105: Global Plastic Packaging Industry in Australia Revenue Million Forecast, by Country 2019 & 2032
- Table 106: Global Plastic Packaging Industry in Australia Volume K Tons Forecast, by Country 2019 & 2032
- Table 107: China Plastic Packaging Industry in Australia Revenue (Million) Forecast, by Application 2019 & 2032
- Table 108: China Plastic Packaging Industry in Australia Volume (K Tons) Forecast, by Application 2019 & 2032
- Table 109: India Plastic Packaging Industry in Australia Revenue (Million) Forecast, by Application 2019 & 2032
- Table 110: India Plastic Packaging Industry in Australia Volume (K Tons) Forecast, by Application 2019 & 2032
- Table 111: Japan Plastic Packaging Industry in Australia Revenue (Million) Forecast, by Application 2019 & 2032
- Table 112: Japan Plastic Packaging Industry in Australia Volume (K Tons) Forecast, by Application 2019 & 2032
- Table 113: South Korea Plastic Packaging Industry in Australia Revenue (Million) Forecast, by Application 2019 & 2032
- Table 114: South Korea Plastic Packaging Industry in Australia Volume (K Tons) Forecast, by Application 2019 & 2032
- Table 115: ASEAN Plastic Packaging Industry in Australia Revenue (Million) Forecast, by Application 2019 & 2032
- Table 116: ASEAN Plastic Packaging Industry in Australia Volume (K Tons) Forecast, by Application 2019 & 2032
- Table 117: Oceania Plastic Packaging Industry in Australia Revenue (Million) Forecast, by Application 2019 & 2032
- Table 118: Oceania Plastic Packaging Industry in Australia Volume (K Tons) Forecast, by Application 2019 & 2032
- Table 119: Rest of Asia Pacific Plastic Packaging Industry in Australia Revenue (Million) Forecast, by Application 2019 & 2032
- Table 120: Rest of Asia Pacific Plastic Packaging Industry in Australia Volume (K Tons) Forecast, by Application 2019 & 2032
Frequently Asked Questions
1. What is the projected Compound Annual Growth Rate (CAGR) of the Plastic Packaging Industry in Australia?
The projected CAGR is approximately 2.14%.
2. Which companies are prominent players in the Plastic Packaging Industry in Australia?
Key companies in the market include Visy Industries Australia Pty Ltd, Gravure Packaging Ltd, Cospak Pty Ltd, Plasmo Pty Ltd*List Not Exhaustive, Flexible Packaging Solutions Pty Ltd, Orora Packaging Australia Pty Ltd, A&M Packaging Pty Ltd, Pact Group Holdings Australia Pty Ltd, Caspak Products Pty Ltd, Synergy Packaging (RPC Group), Pro-Pac Packaging Pty Ltd, Filton Packaging Pty Ltd, Econopak Flexible Packaging, Vacupack Pty Ltd.
3. What are the main segments of the Plastic Packaging Industry in Australia?
The market segments include Rigid Packaging, Flexible Packaging, Industrial Plastic Film Market, End-user Industry.
4. Can you provide details about the market size?
The market size is estimated to be USD 2.79 Million as of 2022.
5. What are some drivers contributing to market growth?
Increasing Demand from the Food Industry; Increased Eco-friendly Packaging and Recycled Plastics.
6. What are the notable trends driving market growth?
Increasing Demand from the Food Industry.
7. Are there any restraints impacting market growth?
4.; Fluctuating Cost of Raw Materials.
8. Can you provide examples of recent developments in the market?
October 2022 - To meet its goals for 2025, Mondelez Australia promotes recycled soft plastic packaging. To meet the country's 2025 targets, according to Mondelez Australia, more work needs to be done to increase the recyclability of soft plastic packaging rather than viewing it as the enemy.
9. What pricing options are available for accessing the report?
Pricing options include single-user, multi-user, and enterprise licenses priced at USD 3800, USD 4500, and USD 5800 respectively.
10. Is the market size provided in terms of value or volume?
The market size is provided in terms of value, measured in Million and volume, measured in K Tons.
11. Are there any specific market keywords associated with the report?
Yes, the market keyword associated with the report is "Plastic Packaging Industry in Australia," which aids in identifying and referencing the specific market segment covered.
12. How do I determine which pricing option suits my needs best?
The pricing options vary based on user requirements and access needs. Individual users may opt for single-user licenses, while businesses requiring broader access may choose multi-user or enterprise licenses for cost-effective access to the report.
13. Are there any additional resources or data provided in the Plastic Packaging Industry in Australia report?
While the report offers comprehensive insights, it's advisable to review the specific contents or supplementary materials provided to ascertain if additional resources or data are available.
14. How can I stay updated on further developments or reports in the Plastic Packaging Industry in Australia?
To stay informed about further developments, trends, and reports in the Plastic Packaging Industry in Australia, consider subscribing to industry newsletters, following relevant companies and organizations, or regularly checking reputable industry news sources and publications.
Methodology
Step 1 - Identification of Relevant Samples Size from Population Database


Step 2 - Approaches for Defining Global Market Size (Value, Volume* & Price*)

Note*: In applicable scenarios
Step 3 - Data Sources
Primary Research
- Web Analytics
- Survey Reports
- Research Institute
- Latest Research Reports
- Opinion Leaders
Secondary Research
- Annual Reports
- White Paper
- Latest Press Release
- Industry Association
- Paid Database
- Investor Presentations

Step 4 - Data Triangulation
Involves using different sources of information in order to increase the validity of a study
These sources are likely to be stakeholders in a program - participants, other researchers, program staff, other community members, and so on.
Then we put all data in single framework & apply various statistical tools to find out the dynamic on the market.
During the analysis stage, feedback from the stakeholder groups would be compared to determine areas of agreement as well as areas of divergence


