
Key Insights
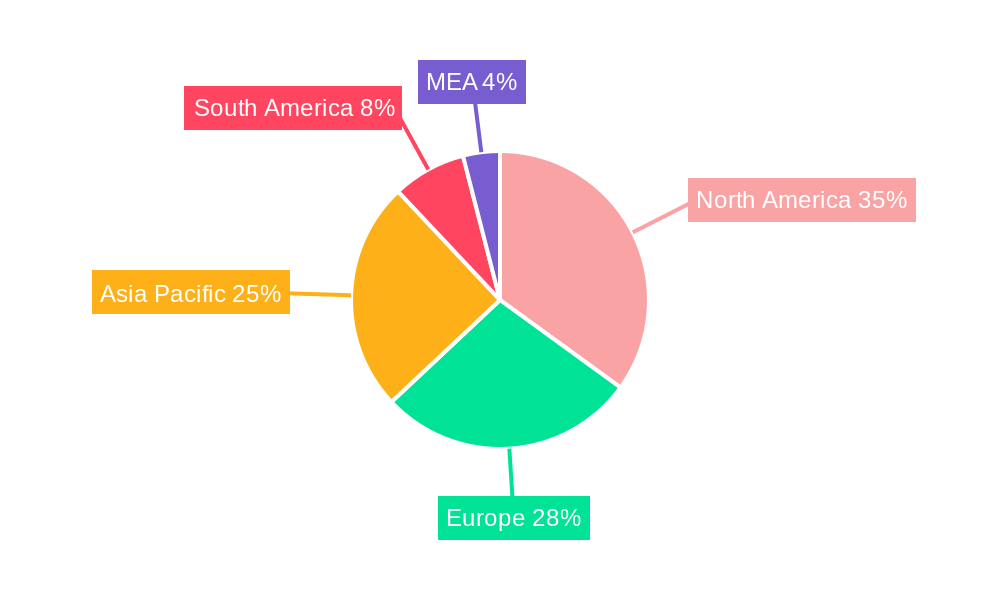
The global pipeline services market is experiencing robust growth, driven by increasing investments in oil and gas infrastructure, the expansion of renewable energy projects requiring pipeline networks, and a rising demand for efficient pipeline maintenance and inspection services. The market's Compound Annual Growth Rate (CAGR) exceeding 3.90% indicates a steady upward trajectory, projected to continue through 2033. Key segments within this market include pre-commissioning and commissioning services, maintenance services, and cleaning and inspection services, with onshore and offshore deployments showing significant potential. Major players such as Intertek Group PLC, Baker Hughes Co, and Larsen & Toubro Limited are actively shaping the market landscape through technological advancements and strategic acquisitions, further fueling market expansion. Geographic growth is observed across North America (particularly the US and Canada), Europe (driven by robust energy infrastructure), and the Asia-Pacific region (fueled by infrastructure development and industrialization in countries like China and India). The market faces some constraints, including the cyclical nature of the oil and gas industry, fluctuating commodity prices, and the increasing focus on environmental regulations and pipeline safety standards. However, innovative solutions focused on enhanced pipeline integrity management and digitalization are mitigating these challenges.
Growth within the pipeline services market is expected to be influenced by several factors in the coming years. Government regulations mandating regular pipeline inspections and maintenance will contribute significantly to the market's expansion. The increasing adoption of advanced inspection technologies, such as smart pigging and drone surveillance, will improve efficiency and reduce operational costs, driving further growth. Furthermore, the rise of renewable energy sources, necessitating the construction of new pipeline networks for hydrogen and carbon capture projects, is expected to create considerable opportunities. While challenges exist in terms of economic downturns and stringent environmental standards, the overall outlook for the pipeline services market remains positive, with continued expansion projected through 2033, largely supported by increasing investment in infrastructure and technological improvements that enhance pipeline safety and efficiency.
This comprehensive report provides an in-depth analysis of the global Pipeline Services Market, offering valuable insights for stakeholders, investors, and industry professionals. The study covers the period from 2019 to 2033, with 2025 serving as the base and estimated year. The report meticulously examines market structure, competitive dynamics, industry trends, dominant segments, product innovations, and future growth prospects. With a focus on actionable data and insightful analysis, this report is an essential resource for navigating the complexities of this dynamic market. The estimated market size in 2025 is xx Million.

Pipeline Services Market Market Structure & Competitive Dynamics
The global pipeline services market exhibits a moderately concentrated structure, with several major players holding significant market share. The market is characterized by intense competition, driven by technological advancements and evolving industry regulations. Key players are increasingly focusing on mergers and acquisitions (M&A) to expand their service portfolios and geographic reach. In recent years, M&A deal values have totaled approximately xx Million, reflecting the strategic importance of consolidation within the sector. Innovation ecosystems are vital, with companies investing heavily in R&D to develop advanced technologies for pipeline inspection, maintenance, and construction. Regulatory frameworks, particularly concerning safety and environmental compliance, significantly influence market dynamics. The presence of substitute technologies, while limited, also adds complexity to the competitive landscape. End-user trends, primarily driven by the energy sector's need for efficient and reliable pipeline infrastructure, shape market demand.
- Market Concentration: Moderately concentrated, with top 5 players holding approximately xx% market share (2025).
- Innovation Ecosystems: Strong R&D investments in advanced inspection technologies (e.g., robotics, AI).
- Regulatory Frameworks: Stringent safety and environmental regulations impacting operational costs.
- Product Substitutes: Limited but emerging technologies pose potential future challenges.
- M&A Activities: Significant M&A activity observed in recent years, totaling approximately xx Million (2019-2024).
- End-User Trends: Growing demand driven by the increasing need for efficient and safe pipeline transportation of oil and gas.
Pipeline Services Market Industry Trends & Insights
The pipeline services market is experiencing robust growth, projected to achieve a CAGR of xx% during the forecast period (2025-2033). This growth is fueled by several key factors: the ongoing expansion of global energy infrastructure, increasing demand for efficient pipeline maintenance and repair, stringent safety regulations driving the adoption of advanced technologies, and the rise of digitalization across the industry. Technological disruptions, particularly in areas like robotics and AI-powered inspection systems, are reshaping the market landscape. Consumer preferences are shifting towards more sustainable and environmentally friendly solutions, driving innovation in pipeline construction and maintenance practices. Competitive dynamics are intense, with companies focusing on differentiation through service quality, technological innovation, and geographic expansion. Market penetration of advanced inspection technologies is estimated at approximately xx% in 2025, with significant growth potential in the coming years.

Dominant Markets & Segments in Pipeline Services Market
The North American region currently dominates the global pipeline services market, driven by a robust oil and gas infrastructure and significant investments in pipeline projects. The Onshore segment holds the largest market share within the By Location of Deployment category, due to the extensive network of onshore pipelines. Among service types, Maintenance Services constitutes the largest segment, reflecting the continuous need for pipeline upkeep and repair. Within Other Inspection Services, Decommissioning Services are experiencing rapid growth due to the increasing decommissioning of aging pipelines.
- Key Drivers for North American Dominance: Abundant oil and gas resources, significant infrastructure investment, and favorable regulatory environment.
- Onshore Segment Dominance: Larger pipeline network compared to offshore, leading to higher maintenance and repair needs.
- Maintenance Services Leading Segment: Continuous need for pipeline inspection, repair, and replacement.
- Decommissioning Services Growth: Increasing decommissioning of aging pipelines, generating demand for specialized services.
Pipeline Services Market Product Innovations
Recent years have witnessed significant advancements in pipeline services technologies, including the development of advanced robotic inspection systems, AI-powered data analytics for predictive maintenance, and more efficient cleaning techniques. These innovations offer improved accuracy, reduced downtime, and enhanced safety. The market is witnessing a growing adoption of remote monitoring and control systems, enabling more efficient pipeline management and reduced operational costs. These advancements are crucial in improving the safety, reliability, and efficiency of pipeline operations, directly addressing the market's need for advanced solutions.
Report Segmentation & Scope
This report provides detailed segmentation of the pipeline services market across several key parameters:
- By Service Type: Pre-commissioning and Commissioning Services, Maintenance Services, Cleaning Services, and Inspection Services. Each segment presents distinct growth trajectories and competitive dynamics. The Maintenance Services segment is projected to maintain its dominance throughout the forecast period.
- By Location of Deployment: Onshore and Offshore. The Onshore segment holds a larger market share due to its extensive pipeline infrastructure.
- Other Inspection Services: This includes specialized services like Decommissioning Services, which are experiencing rapid growth due to the increasing decommissioning of aging pipeline infrastructure.
Key Drivers of Pipeline Services Market Growth
Several factors are driving the expansion of the pipeline services market: Firstly, the increasing demand for energy resources fuels growth in pipeline construction and expansion. Secondly, stringent regulatory frameworks emphasizing safety and environmental compliance necessitate advanced inspection and maintenance services. Thirdly, technological advancements like AI-powered predictive maintenance are improving efficiency and cost-effectiveness. Lastly, the growing adoption of digital technologies for pipeline monitoring and management is contributing to market growth.
Challenges in the Pipeline Services Market Sector
The pipeline services sector faces several challenges. These include stringent regulatory compliance costs, which can increase operational expenses. Supply chain disruptions can impact the timely delivery of services. Furthermore, intense competition among service providers necessitates continuous innovation and cost optimization to maintain market share. Fluctuating energy prices and economic downturns can also impact project spending and overall market demand, resulting in revenue uncertainty for service providers.
Leading Players in the Pipeline Services Market Market
- Sunland Construction Inc
- Intertek Group PLC (Intertek)
- Tenaris SA (Tenaris)
- EnerMech Ltd (EnerMech)
- Larsen & Toubro Limited (Larsen & Toubro)
- IKM Gruppen AS (IKM)
- Ledcor Group (Ledcor)
- Baker Hughes Co (Baker Hughes)
- STATS Group (STATS Group)
- T D Williamson*List Not Exhaustive
- Barnard Construction Company Inc
- Snelson Companies Inc
- Oil States Industries Inc
- Pumpco Inc
Key Developments in Pipeline Services Market Sector
- 2023 Q3: Baker Hughes launched a new AI-powered pipeline inspection system.
- 2022 Q4: Intertek acquired a specialized pipeline maintenance company.
- 2021 Q2: New regulations on pipeline safety were implemented in the EU, impacting market players.
- 2020 Q1: The COVID-19 pandemic led to temporary disruptions in supply chains. (Further details on specific events are available within the full report.)
Strategic Pipeline Services Market Market Outlook
The pipeline services market presents significant growth opportunities in the coming years. The increasing focus on pipeline safety and efficiency will drive demand for advanced inspection and maintenance technologies. The expansion of global energy infrastructure, particularly in emerging economies, will create new market prospects. Companies that strategically invest in R&D, adopt digital technologies, and focus on providing value-added services will be well-positioned to capitalize on these growth opportunities. The long-term outlook for the pipeline services market remains positive, driven by sustained growth in energy demand and ongoing advancements in pipeline technologies.
Pipeline Services Market Segmentation
-
1. Service Type
- 1.1. Pre-commissioning and Commissioning Services
-
1.2. Maintenance Services
- 1.2.1. Repair Services
- 1.2.2. Cleaning Services
-
1.3. Inspection Services
- 1.3.1. Intellig
- 1.3.2. Caliper Pigging
- 1.3.3. Other Inspection Services
- 1.4. Decommissioning Services
-
2. Location of Deployment
- 2.1. Onshore
- 2.2. Offshore
Pipeline Services Market Segmentation By Geography
- 1. North America
- 2. Asia Pacific
- 3. Europe
- 4. South America
- 5. Middle East
Pipeline Services Market REPORT HIGHLIGHTS
| Aspects | Details |
|---|---|
| Study Period | 2019-2033 |
| Base Year | 2024 |
| Estimated Year | 2025 |
| Forecast Period | 2025-2033 |
| Historical Period | 2019-2024 |
| Growth Rate | CAGR of > 3.90% from 2019-2033 |
| Segmentation |
|
Table of Contents
- 1. Introduction
- 1.1. Research Scope
- 1.2. Market Segmentation
- 1.3. Research Methodology
- 1.4. Definitions and Assumptions
- 2. Executive Summary
- 2.1. Introduction
- 3. Market Dynamics
- 3.1. Introduction
- 3.2. Market Drivers
- 3.2.1. 4.; Rapid Recovery in the Oil and Gas and Mining Industries4.; Surge in the Construction Industry
- 3.3. Market Restrains
- 3.3.1. 4.; High Maintenance and Operation Costs of Submersible Pump Restrain the Market
- 3.4. Market Trends
- 3.4.1. Intelligent Pigging to be a Significant Market
- 4. Market Factor Analysis
- 4.1. Porters Five Forces
- 4.2. Supply/Value Chain
- 4.3. PESTEL analysis
- 4.4. Market Entropy
- 4.5. Patent/Trademark Analysis
- 5. Global Pipeline Services Market Analysis, Insights and Forecast, 2019-2031
- 5.1. Market Analysis, Insights and Forecast - by Service Type
- 5.1.1. Pre-commissioning and Commissioning Services
- 5.1.2. Maintenance Services
- 5.1.2.1. Repair Services
- 5.1.2.2. Cleaning Services
- 5.1.3. Inspection Services
- 5.1.3.1. Intellig
- 5.1.3.2. Caliper Pigging
- 5.1.3.3. Other Inspection Services
- 5.1.4. Decommissioning Services
- 5.2. Market Analysis, Insights and Forecast - by Location of Deployment
- 5.2.1. Onshore
- 5.2.2. Offshore
- 5.3. Market Analysis, Insights and Forecast - by Region
- 5.3.1. North America
- 5.3.2. Asia Pacific
- 5.3.3. Europe
- 5.3.4. South America
- 5.3.5. Middle East
- 5.1. Market Analysis, Insights and Forecast - by Service Type
- 6. North America Pipeline Services Market Analysis, Insights and Forecast, 2019-2031
- 6.1. Market Analysis, Insights and Forecast - by Service Type
- 6.1.1. Pre-commissioning and Commissioning Services
- 6.1.2. Maintenance Services
- 6.1.2.1. Repair Services
- 6.1.2.2. Cleaning Services
- 6.1.3. Inspection Services
- 6.1.3.1. Intellig
- 6.1.3.2. Caliper Pigging
- 6.1.3.3. Other Inspection Services
- 6.1.4. Decommissioning Services
- 6.2. Market Analysis, Insights and Forecast - by Location of Deployment
- 6.2.1. Onshore
- 6.2.2. Offshore
- 6.1. Market Analysis, Insights and Forecast - by Service Type
- 7. Asia Pacific Pipeline Services Market Analysis, Insights and Forecast, 2019-2031
- 7.1. Market Analysis, Insights and Forecast - by Service Type
- 7.1.1. Pre-commissioning and Commissioning Services
- 7.1.2. Maintenance Services
- 7.1.2.1. Repair Services
- 7.1.2.2. Cleaning Services
- 7.1.3. Inspection Services
- 7.1.3.1. Intellig
- 7.1.3.2. Caliper Pigging
- 7.1.3.3. Other Inspection Services
- 7.1.4. Decommissioning Services
- 7.2. Market Analysis, Insights and Forecast - by Location of Deployment
- 7.2.1. Onshore
- 7.2.2. Offshore
- 7.1. Market Analysis, Insights and Forecast - by Service Type
- 8. Europe Pipeline Services Market Analysis, Insights and Forecast, 2019-2031
- 8.1. Market Analysis, Insights and Forecast - by Service Type
- 8.1.1. Pre-commissioning and Commissioning Services
- 8.1.2. Maintenance Services
- 8.1.2.1. Repair Services
- 8.1.2.2. Cleaning Services
- 8.1.3. Inspection Services
- 8.1.3.1. Intellig
- 8.1.3.2. Caliper Pigging
- 8.1.3.3. Other Inspection Services
- 8.1.4. Decommissioning Services
- 8.2. Market Analysis, Insights and Forecast - by Location of Deployment
- 8.2.1. Onshore
- 8.2.2. Offshore
- 8.1. Market Analysis, Insights and Forecast - by Service Type
- 9. South America Pipeline Services Market Analysis, Insights and Forecast, 2019-2031
- 9.1. Market Analysis, Insights and Forecast - by Service Type
- 9.1.1. Pre-commissioning and Commissioning Services
- 9.1.2. Maintenance Services
- 9.1.2.1. Repair Services
- 9.1.2.2. Cleaning Services
- 9.1.3. Inspection Services
- 9.1.3.1. Intellig
- 9.1.3.2. Caliper Pigging
- 9.1.3.3. Other Inspection Services
- 9.1.4. Decommissioning Services
- 9.2. Market Analysis, Insights and Forecast - by Location of Deployment
- 9.2.1. Onshore
- 9.2.2. Offshore
- 9.1. Market Analysis, Insights and Forecast - by Service Type
- 10. Middle East Pipeline Services Market Analysis, Insights and Forecast, 2019-2031
- 10.1. Market Analysis, Insights and Forecast - by Service Type
- 10.1.1. Pre-commissioning and Commissioning Services
- 10.1.2. Maintenance Services
- 10.1.2.1. Repair Services
- 10.1.2.2. Cleaning Services
- 10.1.3. Inspection Services
- 10.1.3.1. Intellig
- 10.1.3.2. Caliper Pigging
- 10.1.3.3. Other Inspection Services
- 10.1.4. Decommissioning Services
- 10.2. Market Analysis, Insights and Forecast - by Location of Deployment
- 10.2.1. Onshore
- 10.2.2. Offshore
- 10.1. Market Analysis, Insights and Forecast - by Service Type
- 11. North America Pipeline Services Market Analysis, Insights and Forecast, 2019-2031
- 11.1. Market Analysis, Insights and Forecast - By Country/Sub-region
- 11.1.1 United States
- 11.1.2 Canada
- 11.1.3 Mexico
- 12. Europe Pipeline Services Market Analysis, Insights and Forecast, 2019-2031
- 12.1. Market Analysis, Insights and Forecast - By Country/Sub-region
- 12.1.1 Germany
- 12.1.2 United Kingdom
- 12.1.3 France
- 12.1.4 Spain
- 12.1.5 Italy
- 12.1.6 Spain
- 12.1.7 Belgium
- 12.1.8 Netherland
- 12.1.9 Nordics
- 12.1.10 Rest of Europe
- 13. Asia Pacific Pipeline Services Market Analysis, Insights and Forecast, 2019-2031
- 13.1. Market Analysis, Insights and Forecast - By Country/Sub-region
- 13.1.1 China
- 13.1.2 Japan
- 13.1.3 India
- 13.1.4 South Korea
- 13.1.5 Southeast Asia
- 13.1.6 Australia
- 13.1.7 Indonesia
- 13.1.8 Phillipes
- 13.1.9 Singapore
- 13.1.10 Thailandc
- 13.1.11 Rest of Asia Pacific
- 14. South America Pipeline Services Market Analysis, Insights and Forecast, 2019-2031
- 14.1. Market Analysis, Insights and Forecast - By Country/Sub-region
- 14.1.1 Brazil
- 14.1.2 Argentina
- 14.1.3 Peru
- 14.1.4 Chile
- 14.1.5 Colombia
- 14.1.6 Ecuador
- 14.1.7 Venezuela
- 14.1.8 Rest of South America
- 15. North America Pipeline Services Market Analysis, Insights and Forecast, 2019-2031
- 15.1. Market Analysis, Insights and Forecast - By Country/Sub-region
- 15.1.1 United States
- 15.1.2 Canada
- 15.1.3 Mexico
- 16. MEA Pipeline Services Market Analysis, Insights and Forecast, 2019-2031
- 16.1. Market Analysis, Insights and Forecast - By Country/Sub-region
- 16.1.1 United Arab Emirates
- 16.1.2 Saudi Arabia
- 16.1.3 South Africa
- 16.1.4 Rest of Middle East and Africa
- 17. Competitive Analysis
- 17.1. Global Market Share Analysis 2024
- 17.2. Company Profiles
- 17.2.1 Sunland Construction Inc
- 17.2.1.1. Overview
- 17.2.1.2. Products
- 17.2.1.3. SWOT Analysis
- 17.2.1.4. Recent Developments
- 17.2.1.5. Financials (Based on Availability)
- 17.2.2 Intertek Group PLC
- 17.2.2.1. Overview
- 17.2.2.2. Products
- 17.2.2.3. SWOT Analysis
- 17.2.2.4. Recent Developments
- 17.2.2.5. Financials (Based on Availability)
- 17.2.3 Tenaris SA
- 17.2.3.1. Overview
- 17.2.3.2. Products
- 17.2.3.3. SWOT Analysis
- 17.2.3.4. Recent Developments
- 17.2.3.5. Financials (Based on Availability)
- 17.2.4 EnerMech Ltd
- 17.2.4.1. Overview
- 17.2.4.2. Products
- 17.2.4.3. SWOT Analysis
- 17.2.4.4. Recent Developments
- 17.2.4.5. Financials (Based on Availability)
- 17.2.5 Larsen & Toubro Limited
- 17.2.5.1. Overview
- 17.2.5.2. Products
- 17.2.5.3. SWOT Analysis
- 17.2.5.4. Recent Developments
- 17.2.5.5. Financials (Based on Availability)
- 17.2.6 IKM Gruppen AS
- 17.2.6.1. Overview
- 17.2.6.2. Products
- 17.2.6.3. SWOT Analysis
- 17.2.6.4. Recent Developments
- 17.2.6.5. Financials (Based on Availability)
- 17.2.7 Ledcor Group
- 17.2.7.1. Overview
- 17.2.7.2. Products
- 17.2.7.3. SWOT Analysis
- 17.2.7.4. Recent Developments
- 17.2.7.5. Financials (Based on Availability)
- 17.2.8 Baker Hughes Co
- 17.2.8.1. Overview
- 17.2.8.2. Products
- 17.2.8.3. SWOT Analysis
- 17.2.8.4. Recent Developments
- 17.2.8.5. Financials (Based on Availability)
- 17.2.9 STATS Group
- 17.2.9.1. Overview
- 17.2.9.2. Products
- 17.2.9.3. SWOT Analysis
- 17.2.9.4. Recent Developments
- 17.2.9.5. Financials (Based on Availability)
- 17.2.10 T D Williamson*List Not Exhaustive
- 17.2.10.1. Overview
- 17.2.10.2. Products
- 17.2.10.3. SWOT Analysis
- 17.2.10.4. Recent Developments
- 17.2.10.5. Financials (Based on Availability)
- 17.2.11 Barnard Construction Company Inc
- 17.2.11.1. Overview
- 17.2.11.2. Products
- 17.2.11.3. SWOT Analysis
- 17.2.11.4. Recent Developments
- 17.2.11.5. Financials (Based on Availability)
- 17.2.12 Snelson Companies Inc
- 17.2.12.1. Overview
- 17.2.12.2. Products
- 17.2.12.3. SWOT Analysis
- 17.2.12.4. Recent Developments
- 17.2.12.5. Financials (Based on Availability)
- 17.2.13 Oil States Industries Inc
- 17.2.13.1. Overview
- 17.2.13.2. Products
- 17.2.13.3. SWOT Analysis
- 17.2.13.4. Recent Developments
- 17.2.13.5. Financials (Based on Availability)
- 17.2.14 Pumpco Inc
- 17.2.14.1. Overview
- 17.2.14.2. Products
- 17.2.14.3. SWOT Analysis
- 17.2.14.4. Recent Developments
- 17.2.14.5. Financials (Based on Availability)
- 17.2.1 Sunland Construction Inc
List of Figures
- Figure 1: Global Pipeline Services Market Revenue Breakdown (Million, %) by Region 2024 & 2032
- Figure 2: North America Pipeline Services Market Revenue (Million), by Country 2024 & 2032
- Figure 3: North America Pipeline Services Market Revenue Share (%), by Country 2024 & 2032
- Figure 4: Europe Pipeline Services Market Revenue (Million), by Country 2024 & 2032
- Figure 5: Europe Pipeline Services Market Revenue Share (%), by Country 2024 & 2032
- Figure 6: Asia Pacific Pipeline Services Market Revenue (Million), by Country 2024 & 2032
- Figure 7: Asia Pacific Pipeline Services Market Revenue Share (%), by Country 2024 & 2032
- Figure 8: South America Pipeline Services Market Revenue (Million), by Country 2024 & 2032
- Figure 9: South America Pipeline Services Market Revenue Share (%), by Country 2024 & 2032
- Figure 10: North America Pipeline Services Market Revenue (Million), by Country 2024 & 2032
- Figure 11: North America Pipeline Services Market Revenue Share (%), by Country 2024 & 2032
- Figure 12: MEA Pipeline Services Market Revenue (Million), by Country 2024 & 2032
- Figure 13: MEA Pipeline Services Market Revenue Share (%), by Country 2024 & 2032
- Figure 14: North America Pipeline Services Market Revenue (Million), by Service Type 2024 & 2032
- Figure 15: North America Pipeline Services Market Revenue Share (%), by Service Type 2024 & 2032
- Figure 16: North America Pipeline Services Market Revenue (Million), by Location of Deployment 2024 & 2032
- Figure 17: North America Pipeline Services Market Revenue Share (%), by Location of Deployment 2024 & 2032
- Figure 18: North America Pipeline Services Market Revenue (Million), by Country 2024 & 2032
- Figure 19: North America Pipeline Services Market Revenue Share (%), by Country 2024 & 2032
- Figure 20: Asia Pacific Pipeline Services Market Revenue (Million), by Service Type 2024 & 2032
- Figure 21: Asia Pacific Pipeline Services Market Revenue Share (%), by Service Type 2024 & 2032
- Figure 22: Asia Pacific Pipeline Services Market Revenue (Million), by Location of Deployment 2024 & 2032
- Figure 23: Asia Pacific Pipeline Services Market Revenue Share (%), by Location of Deployment 2024 & 2032
- Figure 24: Asia Pacific Pipeline Services Market Revenue (Million), by Country 2024 & 2032
- Figure 25: Asia Pacific Pipeline Services Market Revenue Share (%), by Country 2024 & 2032
- Figure 26: Europe Pipeline Services Market Revenue (Million), by Service Type 2024 & 2032
- Figure 27: Europe Pipeline Services Market Revenue Share (%), by Service Type 2024 & 2032
- Figure 28: Europe Pipeline Services Market Revenue (Million), by Location of Deployment 2024 & 2032
- Figure 29: Europe Pipeline Services Market Revenue Share (%), by Location of Deployment 2024 & 2032
- Figure 30: Europe Pipeline Services Market Revenue (Million), by Country 2024 & 2032
- Figure 31: Europe Pipeline Services Market Revenue Share (%), by Country 2024 & 2032
- Figure 32: South America Pipeline Services Market Revenue (Million), by Service Type 2024 & 2032
- Figure 33: South America Pipeline Services Market Revenue Share (%), by Service Type 2024 & 2032
- Figure 34: South America Pipeline Services Market Revenue (Million), by Location of Deployment 2024 & 2032
- Figure 35: South America Pipeline Services Market Revenue Share (%), by Location of Deployment 2024 & 2032
- Figure 36: South America Pipeline Services Market Revenue (Million), by Country 2024 & 2032
- Figure 37: South America Pipeline Services Market Revenue Share (%), by Country 2024 & 2032
- Figure 38: Middle East Pipeline Services Market Revenue (Million), by Service Type 2024 & 2032
- Figure 39: Middle East Pipeline Services Market Revenue Share (%), by Service Type 2024 & 2032
- Figure 40: Middle East Pipeline Services Market Revenue (Million), by Location of Deployment 2024 & 2032
- Figure 41: Middle East Pipeline Services Market Revenue Share (%), by Location of Deployment 2024 & 2032
- Figure 42: Middle East Pipeline Services Market Revenue (Million), by Country 2024 & 2032
- Figure 43: Middle East Pipeline Services Market Revenue Share (%), by Country 2024 & 2032
List of Tables
- Table 1: Global Pipeline Services Market Revenue Million Forecast, by Region 2019 & 2032
- Table 2: Global Pipeline Services Market Revenue Million Forecast, by Service Type 2019 & 2032
- Table 3: Global Pipeline Services Market Revenue Million Forecast, by Location of Deployment 2019 & 2032
- Table 4: Global Pipeline Services Market Revenue Million Forecast, by Region 2019 & 2032
- Table 5: Global Pipeline Services Market Revenue Million Forecast, by Country 2019 & 2032
- Table 6: United States Pipeline Services Market Revenue (Million) Forecast, by Application 2019 & 2032
- Table 7: Canada Pipeline Services Market Revenue (Million) Forecast, by Application 2019 & 2032
- Table 8: Mexico Pipeline Services Market Revenue (Million) Forecast, by Application 2019 & 2032
- Table 9: Global Pipeline Services Market Revenue Million Forecast, by Country 2019 & 2032
- Table 10: Germany Pipeline Services Market Revenue (Million) Forecast, by Application 2019 & 2032
- Table 11: United Kingdom Pipeline Services Market Revenue (Million) Forecast, by Application 2019 & 2032
- Table 12: France Pipeline Services Market Revenue (Million) Forecast, by Application 2019 & 2032
- Table 13: Spain Pipeline Services Market Revenue (Million) Forecast, by Application 2019 & 2032
- Table 14: Italy Pipeline Services Market Revenue (Million) Forecast, by Application 2019 & 2032
- Table 15: Spain Pipeline Services Market Revenue (Million) Forecast, by Application 2019 & 2032
- Table 16: Belgium Pipeline Services Market Revenue (Million) Forecast, by Application 2019 & 2032
- Table 17: Netherland Pipeline Services Market Revenue (Million) Forecast, by Application 2019 & 2032
- Table 18: Nordics Pipeline Services Market Revenue (Million) Forecast, by Application 2019 & 2032
- Table 19: Rest of Europe Pipeline Services Market Revenue (Million) Forecast, by Application 2019 & 2032
- Table 20: Global Pipeline Services Market Revenue Million Forecast, by Country 2019 & 2032
- Table 21: China Pipeline Services Market Revenue (Million) Forecast, by Application 2019 & 2032
- Table 22: Japan Pipeline Services Market Revenue (Million) Forecast, by Application 2019 & 2032
- Table 23: India Pipeline Services Market Revenue (Million) Forecast, by Application 2019 & 2032
- Table 24: South Korea Pipeline Services Market Revenue (Million) Forecast, by Application 2019 & 2032
- Table 25: Southeast Asia Pipeline Services Market Revenue (Million) Forecast, by Application 2019 & 2032
- Table 26: Australia Pipeline Services Market Revenue (Million) Forecast, by Application 2019 & 2032
- Table 27: Indonesia Pipeline Services Market Revenue (Million) Forecast, by Application 2019 & 2032
- Table 28: Phillipes Pipeline Services Market Revenue (Million) Forecast, by Application 2019 & 2032
- Table 29: Singapore Pipeline Services Market Revenue (Million) Forecast, by Application 2019 & 2032
- Table 30: Thailandc Pipeline Services Market Revenue (Million) Forecast, by Application 2019 & 2032
- Table 31: Rest of Asia Pacific Pipeline Services Market Revenue (Million) Forecast, by Application 2019 & 2032
- Table 32: Global Pipeline Services Market Revenue Million Forecast, by Country 2019 & 2032
- Table 33: Brazil Pipeline Services Market Revenue (Million) Forecast, by Application 2019 & 2032
- Table 34: Argentina Pipeline Services Market Revenue (Million) Forecast, by Application 2019 & 2032
- Table 35: Peru Pipeline Services Market Revenue (Million) Forecast, by Application 2019 & 2032
- Table 36: Chile Pipeline Services Market Revenue (Million) Forecast, by Application 2019 & 2032
- Table 37: Colombia Pipeline Services Market Revenue (Million) Forecast, by Application 2019 & 2032
- Table 38: Ecuador Pipeline Services Market Revenue (Million) Forecast, by Application 2019 & 2032
- Table 39: Venezuela Pipeline Services Market Revenue (Million) Forecast, by Application 2019 & 2032
- Table 40: Rest of South America Pipeline Services Market Revenue (Million) Forecast, by Application 2019 & 2032
- Table 41: Global Pipeline Services Market Revenue Million Forecast, by Country 2019 & 2032
- Table 42: United States Pipeline Services Market Revenue (Million) Forecast, by Application 2019 & 2032
- Table 43: Canada Pipeline Services Market Revenue (Million) Forecast, by Application 2019 & 2032
- Table 44: Mexico Pipeline Services Market Revenue (Million) Forecast, by Application 2019 & 2032
- Table 45: Global Pipeline Services Market Revenue Million Forecast, by Country 2019 & 2032
- Table 46: United Arab Emirates Pipeline Services Market Revenue (Million) Forecast, by Application 2019 & 2032
- Table 47: Saudi Arabia Pipeline Services Market Revenue (Million) Forecast, by Application 2019 & 2032
- Table 48: South Africa Pipeline Services Market Revenue (Million) Forecast, by Application 2019 & 2032
- Table 49: Rest of Middle East and Africa Pipeline Services Market Revenue (Million) Forecast, by Application 2019 & 2032
- Table 50: Global Pipeline Services Market Revenue Million Forecast, by Service Type 2019 & 2032
- Table 51: Global Pipeline Services Market Revenue Million Forecast, by Location of Deployment 2019 & 2032
- Table 52: Global Pipeline Services Market Revenue Million Forecast, by Country 2019 & 2032
- Table 53: Global Pipeline Services Market Revenue Million Forecast, by Service Type 2019 & 2032
- Table 54: Global Pipeline Services Market Revenue Million Forecast, by Location of Deployment 2019 & 2032
- Table 55: Global Pipeline Services Market Revenue Million Forecast, by Country 2019 & 2032
- Table 56: Global Pipeline Services Market Revenue Million Forecast, by Service Type 2019 & 2032
- Table 57: Global Pipeline Services Market Revenue Million Forecast, by Location of Deployment 2019 & 2032
- Table 58: Global Pipeline Services Market Revenue Million Forecast, by Country 2019 & 2032
- Table 59: Global Pipeline Services Market Revenue Million Forecast, by Service Type 2019 & 2032
- Table 60: Global Pipeline Services Market Revenue Million Forecast, by Location of Deployment 2019 & 2032
- Table 61: Global Pipeline Services Market Revenue Million Forecast, by Country 2019 & 2032
- Table 62: Global Pipeline Services Market Revenue Million Forecast, by Service Type 2019 & 2032
- Table 63: Global Pipeline Services Market Revenue Million Forecast, by Location of Deployment 2019 & 2032
- Table 64: Global Pipeline Services Market Revenue Million Forecast, by Country 2019 & 2032
Frequently Asked Questions
1. What is the projected Compound Annual Growth Rate (CAGR) of the Pipeline Services Market?
The projected CAGR is approximately > 3.90%.
2. Which companies are prominent players in the Pipeline Services Market?
Key companies in the market include Sunland Construction Inc, Intertek Group PLC, Tenaris SA, EnerMech Ltd, Larsen & Toubro Limited, IKM Gruppen AS, Ledcor Group, Baker Hughes Co, STATS Group, T D Williamson*List Not Exhaustive, Barnard Construction Company Inc, Snelson Companies Inc, Oil States Industries Inc, Pumpco Inc.
3. What are the main segments of the Pipeline Services Market?
The market segments include Service Type, Location of Deployment.
4. Can you provide details about the market size?
The market size is estimated to be USD XX Million as of 2022.
5. What are some drivers contributing to market growth?
4.; Rapid Recovery in the Oil and Gas and Mining Industries4.; Surge in the Construction Industry.
6. What are the notable trends driving market growth?
Intelligent Pigging to be a Significant Market.
7. Are there any restraints impacting market growth?
4.; High Maintenance and Operation Costs of Submersible Pump Restrain the Market.
8. Can you provide examples of recent developments in the market?
N/A
9. What pricing options are available for accessing the report?
Pricing options include single-user, multi-user, and enterprise licenses priced at USD 4750, USD 5250, and USD 8750 respectively.
10. Is the market size provided in terms of value or volume?
The market size is provided in terms of value, measured in Million.
11. Are there any specific market keywords associated with the report?
Yes, the market keyword associated with the report is "Pipeline Services Market," which aids in identifying and referencing the specific market segment covered.
12. How do I determine which pricing option suits my needs best?
The pricing options vary based on user requirements and access needs. Individual users may opt for single-user licenses, while businesses requiring broader access may choose multi-user or enterprise licenses for cost-effective access to the report.
13. Are there any additional resources or data provided in the Pipeline Services Market report?
While the report offers comprehensive insights, it's advisable to review the specific contents or supplementary materials provided to ascertain if additional resources or data are available.
14. How can I stay updated on further developments or reports in the Pipeline Services Market?
To stay informed about further developments, trends, and reports in the Pipeline Services Market, consider subscribing to industry newsletters, following relevant companies and organizations, or regularly checking reputable industry news sources and publications.
Methodology
Step 1 - Identification of Relevant Samples Size from Population Database


Step 2 - Approaches for Defining Global Market Size (Value, Volume* & Price*)

Note*: In applicable scenarios
Step 3 - Data Sources
Primary Research
- Web Analytics
- Survey Reports
- Research Institute
- Latest Research Reports
- Opinion Leaders
Secondary Research
- Annual Reports
- White Paper
- Latest Press Release
- Industry Association
- Paid Database
- Investor Presentations

Step 4 - Data Triangulation
Involves using different sources of information in order to increase the validity of a study
These sources are likely to be stakeholders in a program - participants, other researchers, program staff, other community members, and so on.
Then we put all data in single framework & apply various statistical tools to find out the dynamic on the market.
During the analysis stage, feedback from the stakeholder groups would be compared to determine areas of agreement as well as areas of divergence


