

Key Insights
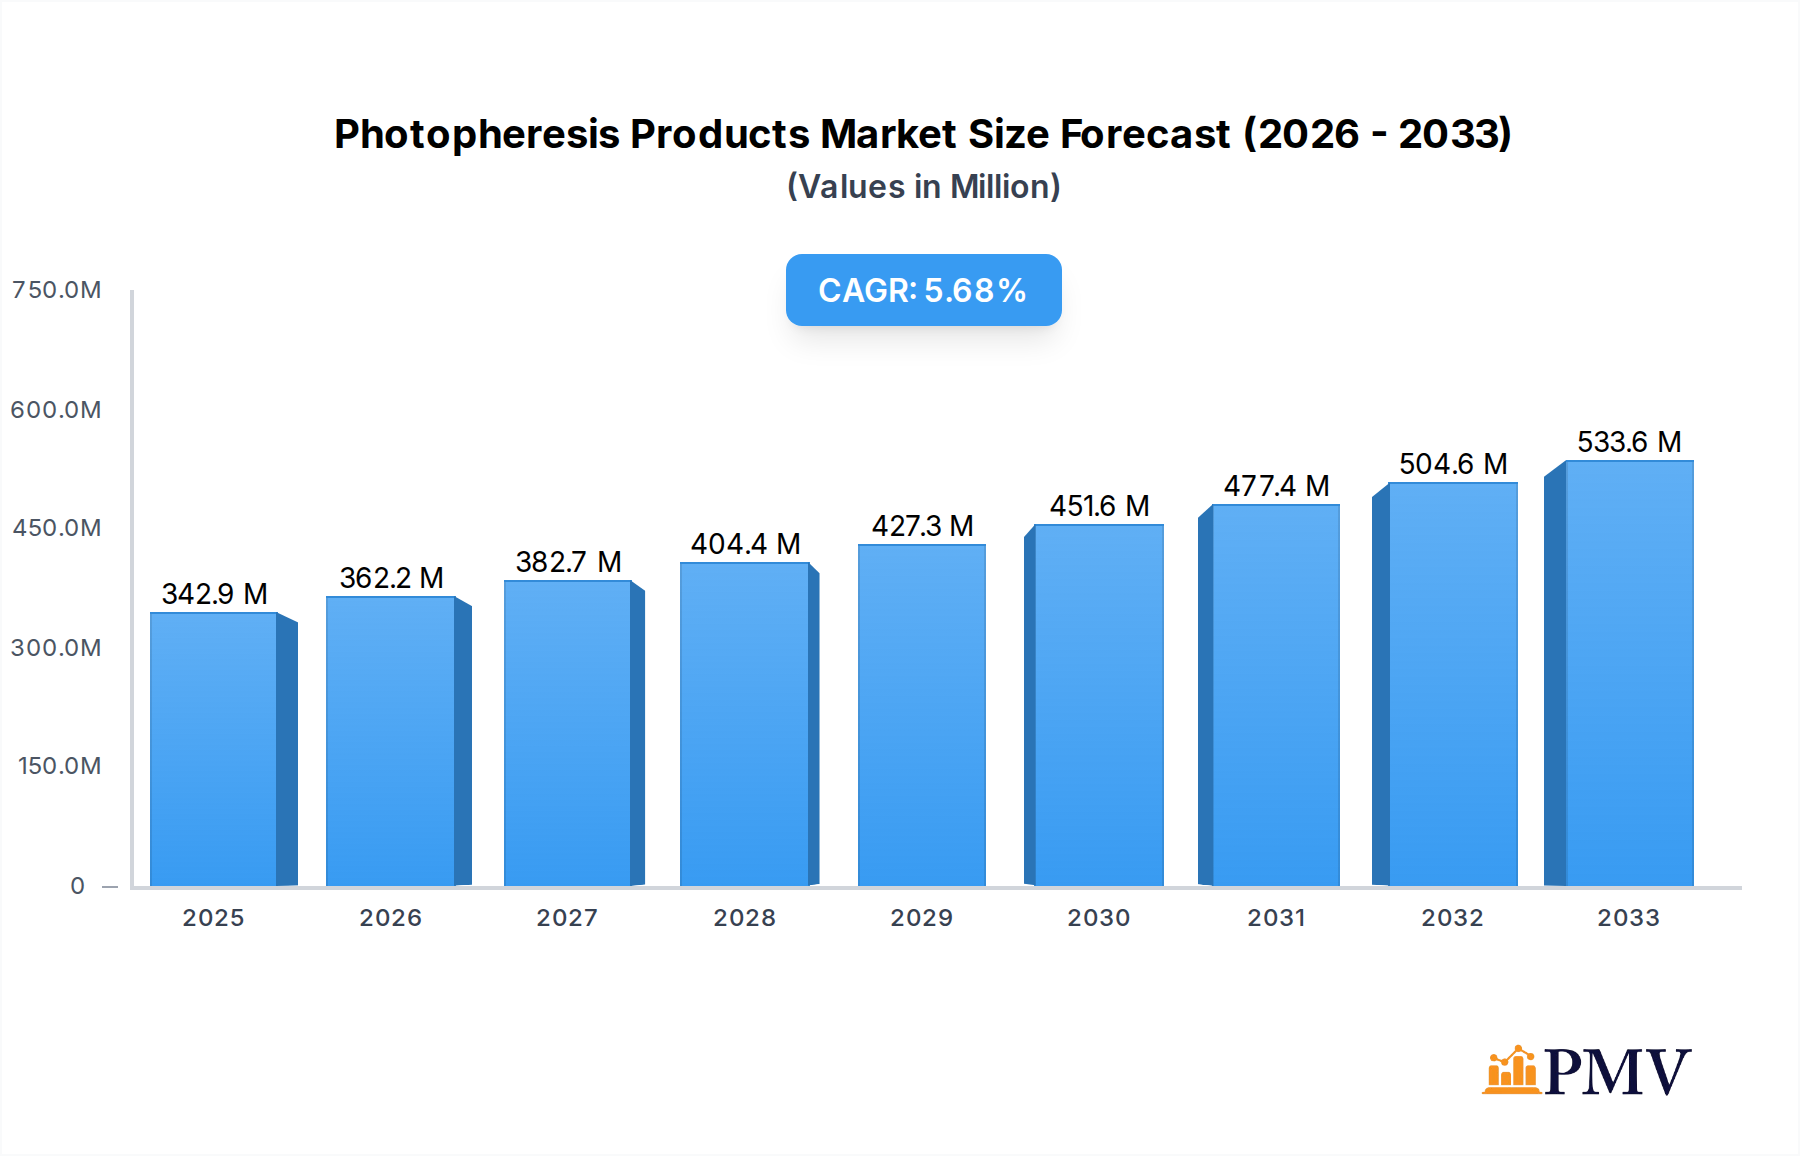
The global Photopheresis Products Market is poised for significant growth, projected to reach $342.86 million in 2025. This expansion is fueled by a robust CAGR of 5.6%, indicating a healthy and sustainable upward trajectory for the market through 2033. The increasing prevalence of conditions such as Graft versus Host Disease (GvHD), Cutaneous T-Cell Lymphoma (CTCL), and various autoimmune diseases, coupled with advancements in transplant procedures, are major drivers for photopheresis adoption. The market's segmentation reveals a dynamic landscape. Open systems are expected to maintain a strong presence, while closed systems are gaining traction due to their enhanced safety and efficacy. Hospitals and ambulatory centers are leading end-users, reflecting the growing integration of photopheresis into mainstream treatment protocols. Key companies like Macopharma, Terumo Corporation, and Fresenius Kabi AG are at the forefront, investing in research and development to innovate and expand their product portfolios. The North American and European regions are anticipated to dominate the market, owing to well-established healthcare infrastructure, higher patient awareness, and favorable reimbursement policies.

Photopheresis Products Market Market Size (In Million)
The projected market size underscores the increasing recognition of photopheresis as a vital therapeutic modality for challenging medical conditions. Factors such as rising healthcare expenditures globally and a growing focus on specialized treatments for chronic and life-threatening diseases are further bolstering market expansion. While the market exhibits strong growth potential, certain restraints, such as the high cost of equipment and treatment, and the need for specialized training, may temper the pace of adoption in some emerging economies. However, ongoing technological advancements, aimed at improving affordability and accessibility, are expected to mitigate these challenges. The Asia Pacific region, in particular, presents a significant opportunity for market players, driven by a large patient population, increasing healthcare investments, and a growing awareness of advanced medical treatments. The sustained growth of the photopheresis market is a testament to its evolving role in improving patient outcomes and managing complex diseases.
Photopheresis Products Market Company Market Share
Comprehensive Photopheresis Products Market Report: Navigating Growth, Innovation, and Competitive Landscape (2019–2033)
This in-depth Photopheresis Products Market analysis delves into the intricate dynamics, segmentation, and future trajectory of the global photopheresis market. Covering the historical period of 2019–2024, base year 2025, estimated year 2025, and a forecast period extending to 2033, this report offers unparalleled insights for stakeholders seeking to understand market expansion, technological advancements, and competitive strategies. With a focus on critical applications such as Graft versus Host Disease (GvHD), Cutaneous T-Cell Lymphoma (CTCL), Transplant Rejections, and Autoimmune Diseases, and segmentations by product type (Open System, Closed System) and end-user (Hospitals, Ambulatory Centers, Other End Users), this report is an indispensable resource for market participants.
Photopheresis Products Market Market Structure & Competitive Dynamics
The photopheresis products market is characterized by a moderate to high level of concentration, with key players investing heavily in research and development to maintain their competitive edge. The innovation ecosystem thrives on advancements in extracorporeal photopheresis (ECP) technology, leading to more efficient and patient-friendly treatment options. Regulatory frameworks, primarily governed by health authorities like the FDA and EMA, play a crucial role in product approvals and market access, ensuring patient safety and efficacy. While direct product substitutes are limited for established photopheresis treatments, continuous improvements in alternative therapeutic modalities for conditions like CTCL and GvHD pose indirect competitive pressures. End-user trends are shifting towards minimally invasive procedures and integrated ECP systems, driving demand for closed-system devices. Mergers and acquisitions (M&A) activities, though not as frequent as in larger medical device markets, contribute to market consolidation, with estimated deal values ranging from several million to hundreds of millions of dollars, reshaping the competitive landscape. Key companies such as Macopharma and Terumo Corporation are pivotal in shaping this dynamic.
Photopheresis Products Market Industry Trends & Insights
The global photopheresis products market is experiencing robust growth, driven by an increasing prevalence of hematological malignancies and autoimmune disorders, coupled with a growing awareness and adoption of ECP as a therapeutic intervention. Technological disruptions, particularly in the development of advanced apheresis devices and photochemicals, are enhancing treatment efficacy and patient comfort, thereby fueling market expansion. The CAGR for the photopheresis products market is projected to be between 6.5% and 8.5% during the forecast period. Consumer preferences are increasingly leaning towards sophisticated closed-system ECP devices that offer enhanced safety, reduced infection risk, and a streamlined treatment process. This shift is supported by significant investments in R&D by leading companies aiming to deliver integrated solutions. Market penetration is steadily increasing as healthcare providers recognize the therapeutic benefits of photopheresis for a wider range of conditions beyond traditional indications. The growing geriatric population, more susceptible to chronic diseases requiring photopheresis, further accentuates market growth. Furthermore, advancements in drug delivery systems and a deeper understanding of the immunological mechanisms targeted by photopheresis are paving the way for novel applications and expanded market reach. The global market size for photopheresis products is estimated to reach approximately $XX million by 2033.
Dominant Markets & Segments in Photopheresis Products Market
North America currently holds a dominant position in the photopheresis products market, driven by a well-established healthcare infrastructure, high disposable incomes, and strong research and development capabilities. The United States, in particular, leads due to a high prevalence of CTCL and GvHD and early adoption of advanced medical technologies. Within product type segmentation, the Closed System segment is witnessing significant growth, projected to capture a substantial market share, estimated at over 60% by 2033. This dominance is attributed to their inherent advantages in terms of infection control, operational efficiency, and patient safety compared to open systems.
Key Drivers for Dominance:
- Economic Policies: Favorable reimbursement policies for ECP in North America and Europe incentivize healthcare providers to adopt these advanced therapies.
- Infrastructure: Advanced hospital infrastructure and the presence of specialized treatment centers equipped for ECP procedures.
- Technological Adoption: A proactive approach to adopting new medical technologies and a strong demand for innovative ECP devices.
In terms of applications, Graft versus Host Disease (GvHD) remains a primary driver for photopheresis use, accounting for a significant portion of the market, estimated at around 35% of the total application segment by 2033. However, Cutaneous T-Cell Lymphoma (CTCL) is experiencing rapid growth, with its market share projected to increase significantly due to its proven efficacy in managing this chronic skin condition. The Ambulatory Centers end-user segment is also gaining traction, as ECP procedures can often be performed in outpatient settings, reducing healthcare costs and improving patient convenience. This segment is expected to grow at a CAGR of approximately 7.2% during the forecast period.
Photopheresis Products Market Product Innovations
Product innovation in the photopheresis market centers on enhancing the efficacy, safety, and patient experience of ECP. Key developments include the miniaturization of ECP devices, the integration of advanced data analytics for personalized treatment regimens, and the development of novel photosensitizing agents. Closed-system technologies are becoming the standard, offering improved sterility and reduced procedure times. Companies are focusing on intuitive user interfaces and automated workflows to simplify operation for healthcare professionals, providing a competitive advantage in an increasingly sophisticated market.
Report Segmentation & Scope
This report provides a granular analysis of the Photopheresis Products Market across various segmentation. The Product Type is divided into Open System and Closed System. The Application segment encompasses Graft versus Host Disease (GvHD), Cutaneous T-Cell Lymphoma (CTCL), Transplant Rejections, and Autoimmune Diseases. The End User segment includes Hospitals, Ambulatory Centers, and Other End Users. The Closed System segment is projected to hold the largest market share, estimated at approximately $XX million by 2033, driven by its superior safety profile. GvHD and CTCL are expected to exhibit strong growth within the application segment, contributing significantly to the overall market expansion. Hospitals are expected to remain the dominant end-user segment, with ambulatory centers showing robust growth at a CAGR of around 7.0%.
Key Drivers of Photopheresis Products Market Growth
The photopheresis products market is propelled by several key drivers. The increasing incidence of hematological malignancies and autoimmune disorders, coupled with the expanding indications for photopheresis, forms a primary growth catalyst. Advancements in ECP technology, leading to more efficient and patient-friendly devices, are significantly boosting market adoption. Furthermore, favorable reimbursement policies in developed economies and growing awareness among healthcare professionals and patients about the therapeutic benefits of photopheresis are crucial growth accelerators.
Challenges in the Photopheresis Products Market Sector
Despite its growth, the photopheresis products market faces certain challenges. High initial capital investment for ECP devices and associated infrastructure can be a barrier for smaller healthcare facilities. Stringent regulatory approval processes for new photopheresis devices and consumables can lead to lengthy market entry timelines. Moreover, the availability of alternative treatment modalities for certain conditions, although not directly substitutable, necessitates continuous innovation and cost-effectiveness to maintain market share. The limited number of trained professionals for operating ECP devices can also pose a constraint in certain regions.
Leading Players in the Photopheresis Products Market Market
- Macopharma
- Terumo Corporation
- Fresenius Kabi AG
- PIT Medical Systems
- Haemonetics Corporation
- Mallinckrodt Pharmaceuticals
Key Developments in Photopheresis Products Market Sector
- September 2022: UAE opened a new apheresis unit in the Sheikh Shakhbout Medical City (SSMC) as a collaboration between Abu Dhabi Health Services Company (SEHA) and Mayo Clinic. Sheikh Shakhbout Medical City widens the treatment scope for diseases, including rare lymphoma of the skin. This expansion indicates a growing global interest and investment in apheresis technologies.
- August 2022: Ikaria Australia Pty Ltd, a Mallinckrodt Pharmaceuticals company, launched THERAKOS CELLEX Photopheresis System to the Australian market. The CELLEX instrument performs the extraction, treatment, and reinfusion of white blood cells for an integrated, closed photopheresis procedure. This launch signifies market expansion and the introduction of advanced closed-system solutions to new geographical regions.
Strategic Photopheresis Products Market Market Outlook
The strategic outlook for the photopheresis products market is exceptionally positive, driven by ongoing innovations and expanding therapeutic applications. The shift towards closed-system ECP devices, coupled with increasing investments in R&D for novel photosensitizers and improved apheresis technologies, will be key growth accelerators. The growing prevalence of chronic diseases and the expanding healthcare access in emerging economies present significant untapped market potential. Strategic partnerships, market penetration initiatives in underdeveloped regions, and a focus on developing integrated photopheresis platforms are expected to shape the future market landscape, promising sustained growth and increased therapeutic impact.
Photopheresis Products Market Segmentation
-
1. Product Type
- 1.1. Open System
- 1.2. Closed System
-
2. Application
- 2.1. Graft versus Host Disease
- 2.2. Cutaneous T-Cell Lymphoma
- 2.3. Transplant Rejections
- 2.4. Autoimmune Diseases
-
3. End User
- 3.1. Hospitals
- 3.2. Ambulatory Centers
- 3.3. Other End Users
Photopheresis Products Market Segmentation By Geography
-
1. North America
- 1.1. United States
- 1.2. Canada
- 1.3. Mexico
-
2. Europe
- 2.1. Germany
- 2.2. United Kingdom
- 2.3. France
- 2.4. Italy
- 2.5. Spain
- 2.6. Rest of Europe
-
3. Asia Pacific
- 3.1. China
- 3.2. Japan
- 3.3. India
- 3.4. Australia
- 3.5. South Korea
- 3.6. Rest of Asia Pacific
-
4. Middle East and Africa
- 4.1. GCC
- 4.2. South Africa
- 4.3. Rest of Middle East and Africa
-
5. South America
- 5.1. Brazil
- 5.2. Argentina
- 5.3. Rest of South America
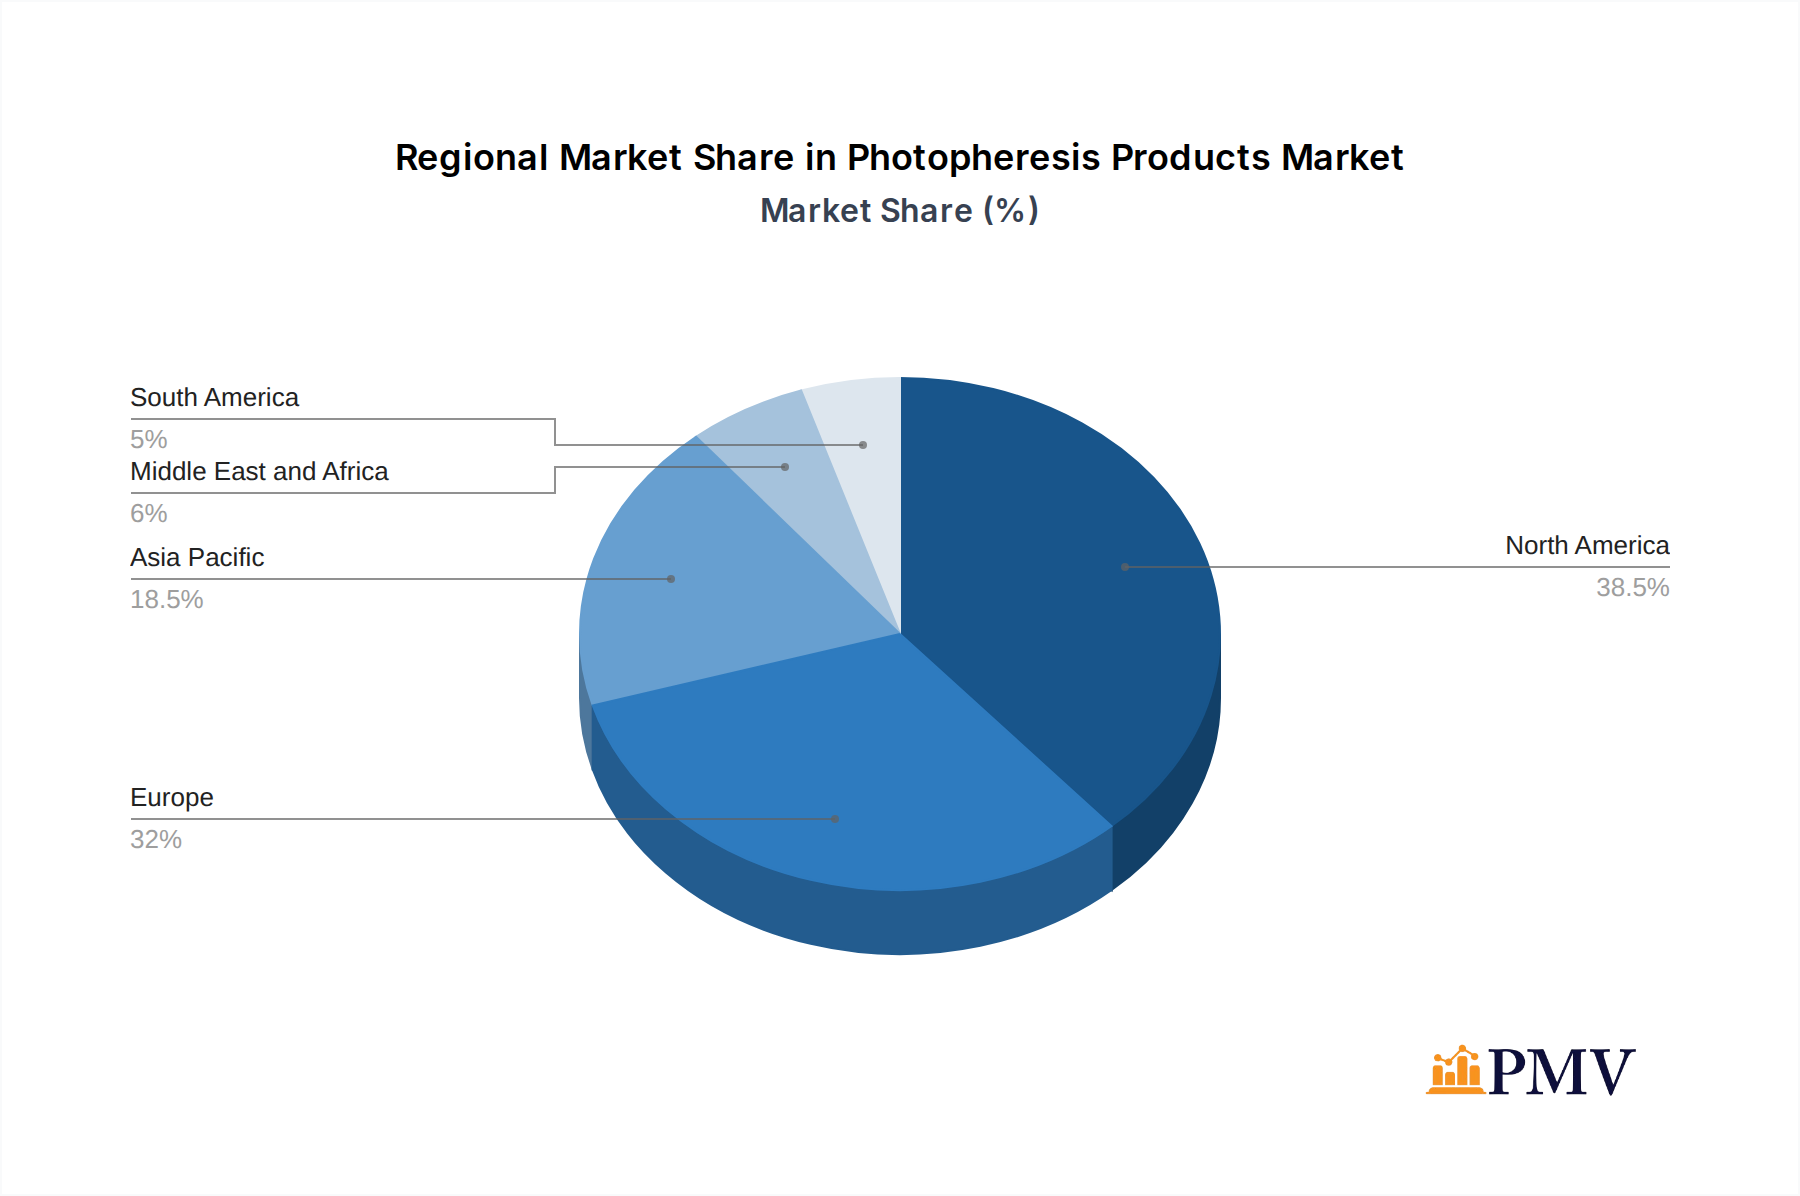
Photopheresis Products Market Regional Market Share
Geographic Coverage of Photopheresis Products Market
Photopheresis Products Market REPORT HIGHLIGHTS
| Aspects | Details |
|---|---|
| Study Period | 2020-2034 |
| Base Year | 2025 |
| Estimated Year | 2026 |
| Forecast Period | 2026-2034 |
| Historical Period | 2020-2025 |
| Growth Rate | CAGR of 5.6% from 2020-2034 |
| Segmentation |
|
Table of Contents
- 1. Introduction
- 1.1. Research Scope
- 1.2. Market Segmentation
- 1.3. Research Objective
- 1.4. Definitions and Assumptions
- 2. Executive Summary
- 2.1. Market Snapshot
- 3. Market Dynamics
- 3.1. Market Drivers
- 3.2. Market Restrains
- 3.3. Market Trends
- 3.4. Market Opportunities
- 4. Market Factor Analysis
- 4.1. Porters Five Forces
- 4.1.1. Bargaining Power of Suppliers
- 4.1.2. Bargaining Power of Buyers
- 4.1.3. Threat of New Entrants
- 4.1.4. Threat of Substitutes
- 4.1.5. Competitive Rivalry
- 4.2. PESTEL analysis
- 4.3. BCG Analysis
- 4.3.1. Stars (High Growth, High Market Share)
- 4.3.2. Cash Cows (Low Growth, High Market Share)
- 4.3.3. Question Mark (High Growth, Low Market Share)
- 4.3.4. Dogs (Low Growth, Low Market Share)
- 4.4. Ansoff Matrix Analysis
- 4.5. Supply Chain Analysis
- 4.6. Regulatory Landscape
- 4.7. Current Market Potential and Opportunity Assessment (TAM–SAM–SOM Framework)
- 4.8. PMV Analyst Note
- 4.1. Porters Five Forces
- 5. Market Analysis, Insights and Forecast 2021-2033
- 5.1. Market Analysis, Insights and Forecast - by Product Type
- 5.1.1. Open System
- 5.1.2. Closed System
- 5.2. Market Analysis, Insights and Forecast - by Application
- 5.2.1. Graft versus Host Disease
- 5.2.2. Cutaneous T-Cell Lymphoma
- 5.2.3. Transplant Rejections
- 5.2.4. Autoimmune Diseases
- 5.3. Market Analysis, Insights and Forecast - by End User
- 5.3.1. Hospitals
- 5.3.2. Ambulatory Centers
- 5.3.3. Other End Users
- 5.4. Market Analysis, Insights and Forecast - by Region
- 5.4.1. North America
- 5.4.2. Europe
- 5.4.3. Asia Pacific
- 5.4.4. Middle East and Africa
- 5.4.5. South America
- 5.1. Market Analysis, Insights and Forecast - by Product Type
- 6. Global Photopheresis Products Market Analysis, Insights and Forecast, 2021-2033
- 6.1. Market Analysis, Insights and Forecast - by Product Type
- 6.1.1. Open System
- 6.1.2. Closed System
- 6.2. Market Analysis, Insights and Forecast - by Application
- 6.2.1. Graft versus Host Disease
- 6.2.2. Cutaneous T-Cell Lymphoma
- 6.2.3. Transplant Rejections
- 6.2.4. Autoimmune Diseases
- 6.3. Market Analysis, Insights and Forecast - by End User
- 6.3.1. Hospitals
- 6.3.2. Ambulatory Centers
- 6.3.3. Other End Users
- 6.1. Market Analysis, Insights and Forecast - by Product Type
- 7. North America Photopheresis Products Market Analysis, Insights and Forecast, 2020-2032
- 7.1. Market Analysis, Insights and Forecast - by Product Type
- 7.1.1. Open System
- 7.1.2. Closed System
- 7.2. Market Analysis, Insights and Forecast - by Application
- 7.2.1. Graft versus Host Disease
- 7.2.2. Cutaneous T-Cell Lymphoma
- 7.2.3. Transplant Rejections
- 7.2.4. Autoimmune Diseases
- 7.3. Market Analysis, Insights and Forecast - by End User
- 7.3.1. Hospitals
- 7.3.2. Ambulatory Centers
- 7.3.3. Other End Users
- 7.1. Market Analysis, Insights and Forecast - by Product Type
- 8. Europe Photopheresis Products Market Analysis, Insights and Forecast, 2020-2032
- 8.1. Market Analysis, Insights and Forecast - by Product Type
- 8.1.1. Open System
- 8.1.2. Closed System
- 8.2. Market Analysis, Insights and Forecast - by Application
- 8.2.1. Graft versus Host Disease
- 8.2.2. Cutaneous T-Cell Lymphoma
- 8.2.3. Transplant Rejections
- 8.2.4. Autoimmune Diseases
- 8.3. Market Analysis, Insights and Forecast - by End User
- 8.3.1. Hospitals
- 8.3.2. Ambulatory Centers
- 8.3.3. Other End Users
- 8.1. Market Analysis, Insights and Forecast - by Product Type
- 9. Asia Pacific Photopheresis Products Market Analysis, Insights and Forecast, 2020-2032
- 9.1. Market Analysis, Insights and Forecast - by Product Type
- 9.1.1. Open System
- 9.1.2. Closed System
- 9.2. Market Analysis, Insights and Forecast - by Application
- 9.2.1. Graft versus Host Disease
- 9.2.2. Cutaneous T-Cell Lymphoma
- 9.2.3. Transplant Rejections
- 9.2.4. Autoimmune Diseases
- 9.3. Market Analysis, Insights and Forecast - by End User
- 9.3.1. Hospitals
- 9.3.2. Ambulatory Centers
- 9.3.3. Other End Users
- 9.1. Market Analysis, Insights and Forecast - by Product Type
- 10. Middle East and Africa Photopheresis Products Market Analysis, Insights and Forecast, 2020-2032
- 10.1. Market Analysis, Insights and Forecast - by Product Type
- 10.1.1. Open System
- 10.1.2. Closed System
- 10.2. Market Analysis, Insights and Forecast - by Application
- 10.2.1. Graft versus Host Disease
- 10.2.2. Cutaneous T-Cell Lymphoma
- 10.2.3. Transplant Rejections
- 10.2.4. Autoimmune Diseases
- 10.3. Market Analysis, Insights and Forecast - by End User
- 10.3.1. Hospitals
- 10.3.2. Ambulatory Centers
- 10.3.3. Other End Users
- 10.1. Market Analysis, Insights and Forecast - by Product Type
- 11. South America Photopheresis Products Market Analysis, Insights and Forecast, 2020-2032
- 11.1. Market Analysis, Insights and Forecast - by Product Type
- 11.1.1. Open System
- 11.1.2. Closed System
- 11.2. Market Analysis, Insights and Forecast - by Application
- 11.2.1. Graft versus Host Disease
- 11.2.2. Cutaneous T-Cell Lymphoma
- 11.2.3. Transplant Rejections
- 11.2.4. Autoimmune Diseases
- 11.3. Market Analysis, Insights and Forecast - by End User
- 11.3.1. Hospitals
- 11.3.2. Ambulatory Centers
- 11.3.3. Other End Users
- 11.1. Market Analysis, Insights and Forecast - by Product Type
- 12. Competitive Analysis
- 12.1. Company Profiles
- 12.1.1 Macopharma
- 12.1.1.1. Company Overview
- 12.1.1.2. Products
- 12.1.1.3. Company Financials
- 12.1.1.4. SWOT Analysis
- 12.1.2 Terumo Corporation*List Not Exhaustive
- 12.1.2.1. Company Overview
- 12.1.2.2. Products
- 12.1.2.3. Company Financials
- 12.1.2.4. SWOT Analysis
- 12.1.3 Fresenius Kabi AG
- 12.1.3.1. Company Overview
- 12.1.3.2. Products
- 12.1.3.3. Company Financials
- 12.1.3.4. SWOT Analysis
- 12.1.4 PIT Medical Systems
- 12.1.4.1. Company Overview
- 12.1.4.2. Products
- 12.1.4.3. Company Financials
- 12.1.4.4. SWOT Analysis
- 12.1.5 Haemonetics Corporation
- 12.1.5.1. Company Overview
- 12.1.5.2. Products
- 12.1.5.3. Company Financials
- 12.1.5.4. SWOT Analysis
- 12.1.6 Mallinckrodt Pharmaceuticals
- 12.1.6.1. Company Overview
- 12.1.6.2. Products
- 12.1.6.3. Company Financials
- 12.1.6.4. SWOT Analysis
- 12.1.1 Macopharma
- 12.2. Market Entropy
- 12.2.1 Company's Key Areas Served
- 12.2.2 Recent Developments
- 12.3. Company Market Share Analysis 2025
- 12.3.1 Top 5 Companies Market Share Analysis
- 12.3.2 Top 3 Companies Market Share Analysis
- 12.4. List of Potential Customers
- 13. Research Methodology
List of Figures
- Figure 1: Global Photopheresis Products Market Revenue Breakdown (million, %) by Region 2025 & 2033
- Figure 2: North America Photopheresis Products Market Revenue (million), by Product Type 2025 & 2033
- Figure 3: North America Photopheresis Products Market Revenue Share (%), by Product Type 2025 & 2033
- Figure 4: North America Photopheresis Products Market Revenue (million), by Application 2025 & 2033
- Figure 5: North America Photopheresis Products Market Revenue Share (%), by Application 2025 & 2033
- Figure 6: North America Photopheresis Products Market Revenue (million), by End User 2025 & 2033
- Figure 7: North America Photopheresis Products Market Revenue Share (%), by End User 2025 & 2033
- Figure 8: North America Photopheresis Products Market Revenue (million), by Country 2025 & 2033
- Figure 9: North America Photopheresis Products Market Revenue Share (%), by Country 2025 & 2033
- Figure 10: Europe Photopheresis Products Market Revenue (million), by Product Type 2025 & 2033
- Figure 11: Europe Photopheresis Products Market Revenue Share (%), by Product Type 2025 & 2033
- Figure 12: Europe Photopheresis Products Market Revenue (million), by Application 2025 & 2033
- Figure 13: Europe Photopheresis Products Market Revenue Share (%), by Application 2025 & 2033
- Figure 14: Europe Photopheresis Products Market Revenue (million), by End User 2025 & 2033
- Figure 15: Europe Photopheresis Products Market Revenue Share (%), by End User 2025 & 2033
- Figure 16: Europe Photopheresis Products Market Revenue (million), by Country 2025 & 2033
- Figure 17: Europe Photopheresis Products Market Revenue Share (%), by Country 2025 & 2033
- Figure 18: Asia Pacific Photopheresis Products Market Revenue (million), by Product Type 2025 & 2033
- Figure 19: Asia Pacific Photopheresis Products Market Revenue Share (%), by Product Type 2025 & 2033
- Figure 20: Asia Pacific Photopheresis Products Market Revenue (million), by Application 2025 & 2033
- Figure 21: Asia Pacific Photopheresis Products Market Revenue Share (%), by Application 2025 & 2033
- Figure 22: Asia Pacific Photopheresis Products Market Revenue (million), by End User 2025 & 2033
- Figure 23: Asia Pacific Photopheresis Products Market Revenue Share (%), by End User 2025 & 2033
- Figure 24: Asia Pacific Photopheresis Products Market Revenue (million), by Country 2025 & 2033
- Figure 25: Asia Pacific Photopheresis Products Market Revenue Share (%), by Country 2025 & 2033
- Figure 26: Middle East and Africa Photopheresis Products Market Revenue (million), by Product Type 2025 & 2033
- Figure 27: Middle East and Africa Photopheresis Products Market Revenue Share (%), by Product Type 2025 & 2033
- Figure 28: Middle East and Africa Photopheresis Products Market Revenue (million), by Application 2025 & 2033
- Figure 29: Middle East and Africa Photopheresis Products Market Revenue Share (%), by Application 2025 & 2033
- Figure 30: Middle East and Africa Photopheresis Products Market Revenue (million), by End User 2025 & 2033
- Figure 31: Middle East and Africa Photopheresis Products Market Revenue Share (%), by End User 2025 & 2033
- Figure 32: Middle East and Africa Photopheresis Products Market Revenue (million), by Country 2025 & 2033
- Figure 33: Middle East and Africa Photopheresis Products Market Revenue Share (%), by Country 2025 & 2033
- Figure 34: South America Photopheresis Products Market Revenue (million), by Product Type 2025 & 2033
- Figure 35: South America Photopheresis Products Market Revenue Share (%), by Product Type 2025 & 2033
- Figure 36: South America Photopheresis Products Market Revenue (million), by Application 2025 & 2033
- Figure 37: South America Photopheresis Products Market Revenue Share (%), by Application 2025 & 2033
- Figure 38: South America Photopheresis Products Market Revenue (million), by End User 2025 & 2033
- Figure 39: South America Photopheresis Products Market Revenue Share (%), by End User 2025 & 2033
- Figure 40: South America Photopheresis Products Market Revenue (million), by Country 2025 & 2033
- Figure 41: South America Photopheresis Products Market Revenue Share (%), by Country 2025 & 2033
List of Tables
- Table 1: Global Photopheresis Products Market Revenue million Forecast, by Product Type 2020 & 2033
- Table 2: Global Photopheresis Products Market Revenue million Forecast, by Application 2020 & 2033
- Table 3: Global Photopheresis Products Market Revenue million Forecast, by End User 2020 & 2033
- Table 4: Global Photopheresis Products Market Revenue million Forecast, by Region 2020 & 2033
- Table 5: Global Photopheresis Products Market Revenue million Forecast, by Product Type 2020 & 2033
- Table 6: Global Photopheresis Products Market Revenue million Forecast, by Application 2020 & 2033
- Table 7: Global Photopheresis Products Market Revenue million Forecast, by End User 2020 & 2033
- Table 8: Global Photopheresis Products Market Revenue million Forecast, by Country 2020 & 2033
- Table 9: United States Photopheresis Products Market Revenue (million) Forecast, by Application 2020 & 2033
- Table 10: Canada Photopheresis Products Market Revenue (million) Forecast, by Application 2020 & 2033
- Table 11: Mexico Photopheresis Products Market Revenue (million) Forecast, by Application 2020 & 2033
- Table 12: Global Photopheresis Products Market Revenue million Forecast, by Product Type 2020 & 2033
- Table 13: Global Photopheresis Products Market Revenue million Forecast, by Application 2020 & 2033
- Table 14: Global Photopheresis Products Market Revenue million Forecast, by End User 2020 & 2033
- Table 15: Global Photopheresis Products Market Revenue million Forecast, by Country 2020 & 2033
- Table 16: Germany Photopheresis Products Market Revenue (million) Forecast, by Application 2020 & 2033
- Table 17: United Kingdom Photopheresis Products Market Revenue (million) Forecast, by Application 2020 & 2033
- Table 18: France Photopheresis Products Market Revenue (million) Forecast, by Application 2020 & 2033
- Table 19: Italy Photopheresis Products Market Revenue (million) Forecast, by Application 2020 & 2033
- Table 20: Spain Photopheresis Products Market Revenue (million) Forecast, by Application 2020 & 2033
- Table 21: Rest of Europe Photopheresis Products Market Revenue (million) Forecast, by Application 2020 & 2033
- Table 22: Global Photopheresis Products Market Revenue million Forecast, by Product Type 2020 & 2033
- Table 23: Global Photopheresis Products Market Revenue million Forecast, by Application 2020 & 2033
- Table 24: Global Photopheresis Products Market Revenue million Forecast, by End User 2020 & 2033
- Table 25: Global Photopheresis Products Market Revenue million Forecast, by Country 2020 & 2033
- Table 26: China Photopheresis Products Market Revenue (million) Forecast, by Application 2020 & 2033
- Table 27: Japan Photopheresis Products Market Revenue (million) Forecast, by Application 2020 & 2033
- Table 28: India Photopheresis Products Market Revenue (million) Forecast, by Application 2020 & 2033
- Table 29: Australia Photopheresis Products Market Revenue (million) Forecast, by Application 2020 & 2033
- Table 30: South Korea Photopheresis Products Market Revenue (million) Forecast, by Application 2020 & 2033
- Table 31: Rest of Asia Pacific Photopheresis Products Market Revenue (million) Forecast, by Application 2020 & 2033
- Table 32: Global Photopheresis Products Market Revenue million Forecast, by Product Type 2020 & 2033
- Table 33: Global Photopheresis Products Market Revenue million Forecast, by Application 2020 & 2033
- Table 34: Global Photopheresis Products Market Revenue million Forecast, by End User 2020 & 2033
- Table 35: Global Photopheresis Products Market Revenue million Forecast, by Country 2020 & 2033
- Table 36: GCC Photopheresis Products Market Revenue (million) Forecast, by Application 2020 & 2033
- Table 37: South Africa Photopheresis Products Market Revenue (million) Forecast, by Application 2020 & 2033
- Table 38: Rest of Middle East and Africa Photopheresis Products Market Revenue (million) Forecast, by Application 2020 & 2033
- Table 39: Global Photopheresis Products Market Revenue million Forecast, by Product Type 2020 & 2033
- Table 40: Global Photopheresis Products Market Revenue million Forecast, by Application 2020 & 2033
- Table 41: Global Photopheresis Products Market Revenue million Forecast, by End User 2020 & 2033
- Table 42: Global Photopheresis Products Market Revenue million Forecast, by Country 2020 & 2033
- Table 43: Brazil Photopheresis Products Market Revenue (million) Forecast, by Application 2020 & 2033
- Table 44: Argentina Photopheresis Products Market Revenue (million) Forecast, by Application 2020 & 2033
- Table 45: Rest of South America Photopheresis Products Market Revenue (million) Forecast, by Application 2020 & 2033
Frequently Asked Questions
1. What is the projected Compound Annual Growth Rate (CAGR) of the Photopheresis Products Market?
The projected CAGR is approximately 5.6%.
2. Which companies are prominent players in the Photopheresis Products Market?
Key companies in the market include Macopharma, Terumo Corporation*List Not Exhaustive, Fresenius Kabi AG, PIT Medical Systems, Haemonetics Corporation, Mallinckrodt Pharmaceuticals.
3. What are the main segments of the Photopheresis Products Market?
The market segments include Product Type, Application, End User.
4. Can you provide details about the market size?
The market size is estimated to be USD 342.86 million as of 2022.
5. What are some drivers contributing to market growth?
Rise in Prevalence of Autoimmune Diseases; Increasing Technological Advancements.
6. What are the notable trends driving market growth?
Chronic Graft Versus Host Disease (GvHD) is Expected to Hold a Significant Market Share in the Market Studied..
7. Are there any restraints impacting market growth?
Low Adoption of Photopheresis in Pediatric Patients and Lack of Skilled Professionals.
8. Can you provide examples of recent developments in the market?
In September 2022, UAE opened a new apheresis unit in the Sheikh Shakhbout Medical City (SSMC) as a collaboration between Abu Dhabi Health Services Company (SEHA) and Mayo Clinic. Sheikh Shakhbout Medical City widens the treatment scope for diseases, including rare lymphoma of the skin.
9. What pricing options are available for accessing the report?
Pricing options include single-user, multi-user, and enterprise licenses priced at USD 4750, USD 5250, and USD 8750 respectively.
10. Is the market size provided in terms of value or volume?
The market size is provided in terms of value, measured in million.
11. Are there any specific market keywords associated with the report?
Yes, the market keyword associated with the report is "Photopheresis Products Market," which aids in identifying and referencing the specific market segment covered.
12. How do I determine which pricing option suits my needs best?
The pricing options vary based on user requirements and access needs. Individual users may opt for single-user licenses, while businesses requiring broader access may choose multi-user or enterprise licenses for cost-effective access to the report.
13. Are there any additional resources or data provided in the Photopheresis Products Market report?
While the report offers comprehensive insights, it's advisable to review the specific contents or supplementary materials provided to ascertain if additional resources or data are available.
14. How can I stay updated on further developments or reports in the Photopheresis Products Market?
To stay informed about further developments, trends, and reports in the Photopheresis Products Market, consider subscribing to industry newsletters, following relevant companies and organizations, or regularly checking reputable industry news sources and publications.
Methodology
Step 1 - Identification of Relevant Samples Size from Population Database


Step 2 - Approaches for Defining Global Market Size (Value, Volume* & Price*)

Note*: In applicable scenarios
Step 3 - Data Sources
Primary Research
- Web Analytics
- Survey Reports
- Research Institute
- Latest Research Reports
- Opinion Leaders
Secondary Research
- Annual Reports
- White Paper
- Latest Press Release
- Industry Association
- Paid Database
- Investor Presentations

Step 4 - Data Triangulation
Involves using different sources of information in order to increase the validity of a study
These sources are likely to be stakeholders in a program - participants, other researchers, program staff, other community members, and so on.
Then we put all data in single framework & apply various statistical tools to find out the dynamic on the market.
During the analysis stage, feedback from the stakeholder groups would be compared to determine areas of agreement as well as areas of divergence