
Key Insights
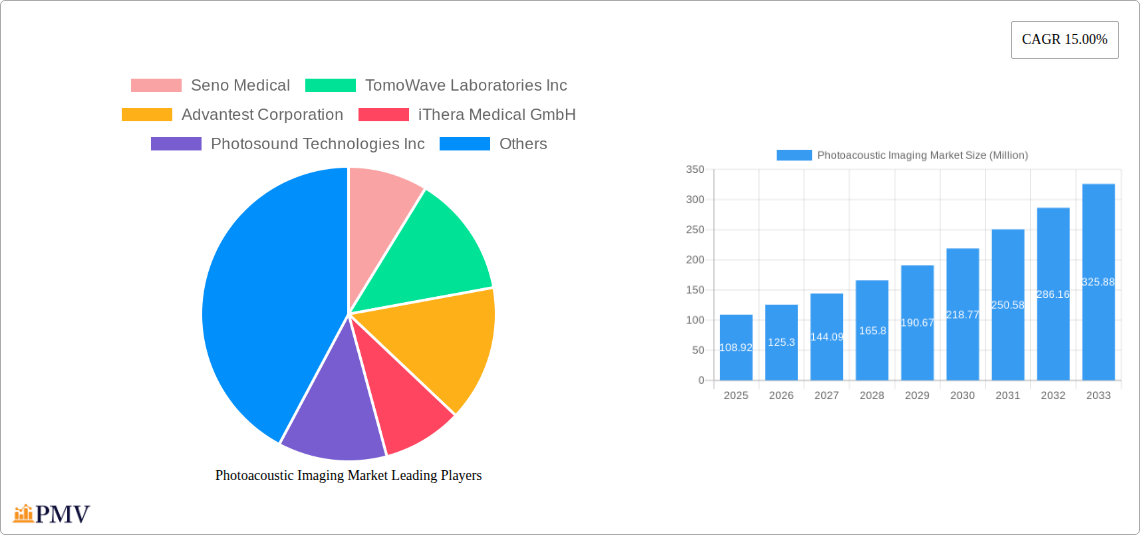
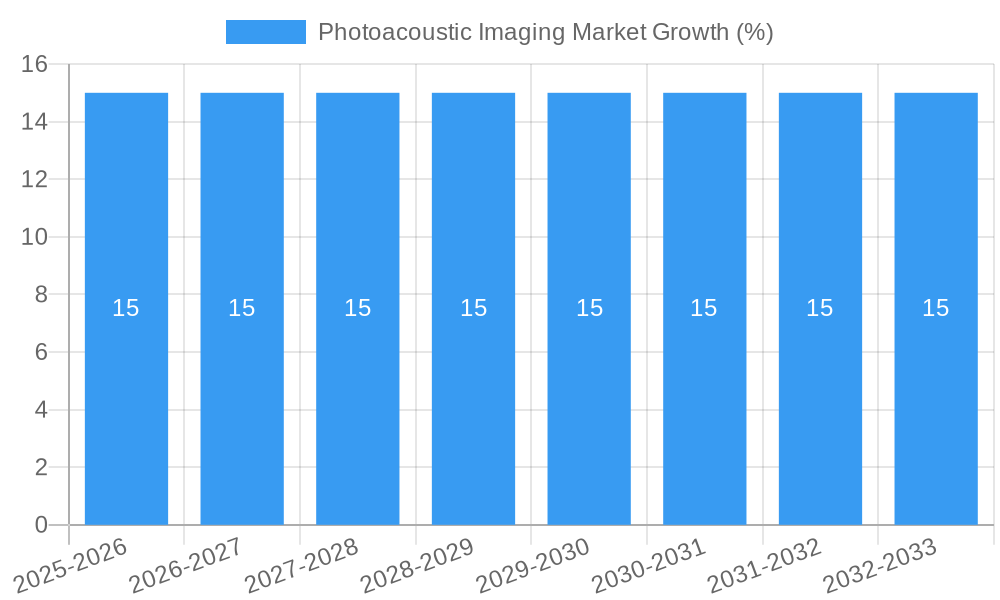
The photoacoustic imaging market is experiencing robust growth, projected to reach \$108.92 million in 2025 and exhibiting a Compound Annual Growth Rate (CAGR) of 15% from 2025 to 2033. This expansion is driven by several key factors. The increasing prevalence of chronic diseases like cancer and cardiovascular conditions fuels demand for advanced diagnostic tools offering superior imaging capabilities. Photoacoustic imaging's ability to provide high-resolution images with functional and molecular information surpasses traditional techniques, making it increasingly attractive for early disease detection and precise treatment planning. Technological advancements, such as improved sensor technology and data analysis algorithms, are further enhancing image quality and reducing acquisition times. The development of more portable and cost-effective systems is expanding access beyond specialized research settings to a broader range of healthcare providers. Furthermore, growing research funding and collaborations between academia and industry are accelerating innovation and driving market penetration.
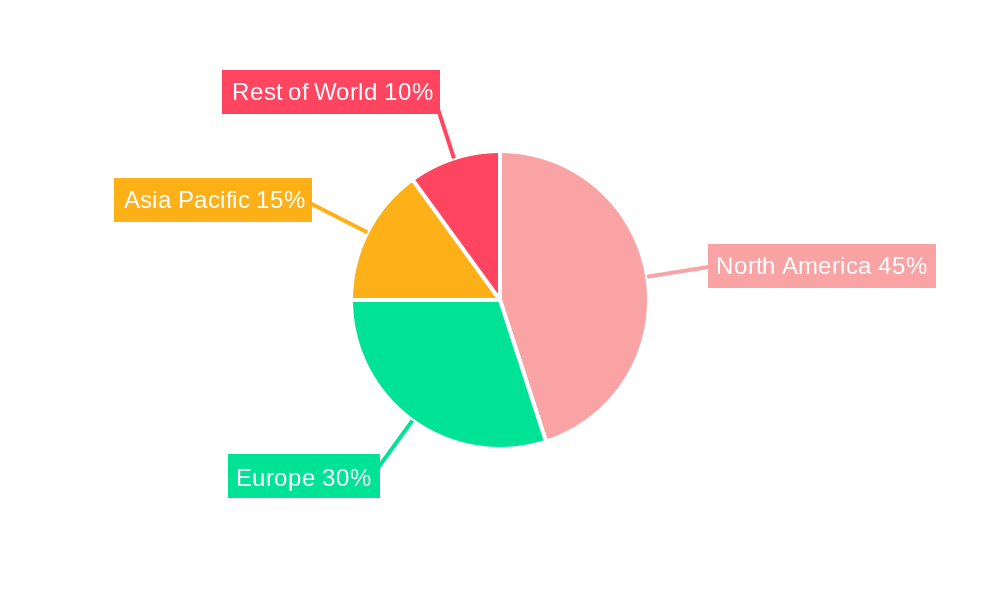
The market segmentation reveals significant opportunities across various product types, applications, and end-users. Photoacoustic tomography currently holds a larger market share than photoacoustic microscopy, but both segments are experiencing significant growth. Oncology and cardiology represent the largest application areas, driven by the critical need for accurate and timely diagnoses. Hospitals and diagnostic centers constitute the primary end-users, followed by academic and research institutes. North America and Europe currently dominate the market, with the Asia-Pacific region exhibiting high growth potential due to increasing healthcare spending and rising adoption of advanced medical technologies. The competitive landscape is characterized by a mix of established players and emerging companies, each vying for market share through product innovation, strategic partnerships, and geographical expansion. Ongoing research in areas such as contrast agent development and multi-modal imaging will further propel market growth in the coming years.
Photoacoustic Imaging Market: A Comprehensive Market Report (2019-2033)
This detailed report provides a comprehensive analysis of the Photoacoustic Imaging market, offering invaluable insights for stakeholders seeking to understand market dynamics, competitive landscapes, and future growth opportunities. The study period covers 2019-2033, with 2025 serving as the base and estimated year, and the forecast period spanning 2025-2033. The historical period analyzed is 2019-2024. The report segments the market by product type (Photoacoustic Tomography, Photoacoustic Microscopy), application (Oncology, Cardiology, Hematology, Other Applications), end-user (Hospitals, Diagnostic Centers, Academic and Research Institutes), and type (Imaging Systems, Lasers, Others). Key players analyzed include Seno Medical, TomoWave Laboratories Inc, Advantest Corporation, iThera Medical GmbH, Photosound Technologies Inc, Kibero, Fujifilm Holdings Corporation (Fujifilm Visualsonics Inc), illumiSonics Inc, InnoLas Laser GmbH, VibroniX, and Aspectus GmbH. The report projects a market value of xx Million by 2033.
Photoacoustic Imaging Market Market Structure & Competitive Dynamics
The photoacoustic imaging market exhibits a moderately concentrated structure, with a few major players holding significant market share. However, the market is witnessing increasing competition from emerging companies introducing innovative technologies and applications. The innovation ecosystem is dynamic, fueled by advancements in laser technology, image processing algorithms, and contrast agents. Regulatory frameworks vary across regions, impacting market entry and adoption rates. The market is characterized by limited product substitutes, with photoacoustic imaging offering unique advantages in terms of high resolution and deep tissue penetration. End-user trends indicate a growing preference for non-invasive imaging techniques, favoring the adoption of photoacoustic imaging in various applications. Mergers and acquisitions (M&A) activities are anticipated to intensify, driving market consolidation and technological advancements.
- Market Concentration: The top 5 companies hold approximately xx% of the market share in 2025.
- M&A Activity: The total value of M&A deals in the photoacoustic imaging market between 2019 and 2024 was approximately xx Million. This is expected to increase to xx Million by 2033.
- Regulatory Landscape: Stringent regulatory approvals are a key challenge in certain geographies.
- Innovation Ecosystem: Collaboration between research institutions and companies drives innovation in this space.
Photoacoustic Imaging Market Industry Trends & Insights
The photoacoustic imaging market is experiencing robust growth, driven by factors such as the rising prevalence of chronic diseases, increasing demand for minimally invasive diagnostic procedures, and technological advancements leading to enhanced image quality and improved functionality. The compound annual growth rate (CAGR) during the forecast period (2025-2033) is projected to be xx%. Market penetration is currently relatively low but is expected to increase significantly driven by expanding applications across various medical specialties. Technological disruptions, including the development of more compact and cost-effective systems, are further driving market expansion. Consumer preferences are shifting towards more user-friendly and portable devices, which manufacturers are actively addressing. Competitive dynamics are marked by both collaboration and competition among leading players as they seek to expand market share and enhance product offerings.
Dominant Markets & Segments in Photoacoustic Imaging Market
The North American region currently holds the largest market share, driven by factors such as high healthcare expenditure, early adoption of advanced technologies, and a robust research ecosystem. Within the segments:
- By Product Type: Photoacoustic tomography holds a larger market share than photoacoustic microscopy due to its broader applications.
- By Application: Oncology is the leading application segment, driven by its potential for early cancer detection and treatment monitoring.
- By End-User: Hospitals are the primary end-users, followed by diagnostic centers.
- By Type: Imaging systems constitute the largest segment, followed by lasers.
Key Drivers for Dominance:
- North America: High healthcare spending, advanced healthcare infrastructure, and favorable regulatory environment.
- Oncology Application: High prevalence of cancer, need for precise diagnosis and treatment monitoring.
- Hospitals & Diagnostic Centers: Established infrastructure and large patient base.
Photoacoustic Imaging Market Product Innovations
Recent years have witnessed significant advancements in photoacoustic imaging technology, including the development of more compact and portable systems, improved image resolution and contrast, and the incorporation of advanced image processing algorithms. These innovations enhance the clinical utility of photoacoustic imaging, widening its applications in various medical specialties. The integration of photoacoustic imaging with other modalities, such as ultrasound and MRI, further expands its diagnostic capabilities. This trend towards multi-modal imaging is likely to continue, further driving market growth.
Report Segmentation & Scope
This report comprehensively segments the photoacoustic imaging market across various parameters:
- By Product Type: Photoacoustic Tomography (xx Million in 2025, projected to reach xx Million by 2033), Photoacoustic Microscopy (xx Million in 2025, projected to reach xx Million by 2033). Both segments show strong growth potential, driven by technological advancements and increased applications.
- By Application: Oncology (xx Million in 2025, projected to reach xx Million by 2033), Cardiology (xx Million in 2025, projected to reach xx Million by 2033), Hematology (xx Million in 2025, projected to reach xx Million by 2033), and Other Applications (xx Million in 2025, projected to reach xx Million by 2033). Oncology dominates due to high demand.
- By End-User: Hospitals (xx Million in 2025, projected to reach xx Million by 2033), Diagnostic Centers (xx Million in 2025, projected to reach xx Million by 2033), and Academic and Research Institutes (xx Million in 2025, projected to reach xx Million by 2033).
- By Type: Imaging Systems (xx Million in 2025, projected to reach xx Million by 2033), Lasers (xx Million in 2025, projected to reach xx Million by 2033), and Others (xx Million in 2025, projected to reach xx Million by 2033). Imaging Systems represents the major share.
Key Drivers of Photoacoustic Imaging Market Growth
Several factors fuel the growth of the photoacoustic imaging market:
- Technological advancements: Improved image resolution, deeper penetration, and miniaturization of systems enhance clinical utility.
- Rising prevalence of chronic diseases: Increased demand for early diagnosis and accurate monitoring of diseases like cancer drives adoption.
- Regulatory approvals and reimbursement policies: Favorable regulatory landscape and reimbursement policies stimulate market growth.
Challenges in the Photoacoustic Imaging Market Sector
Despite its growth potential, the photoacoustic imaging market faces several challenges:
- High initial investment costs: The high cost of systems may limit adoption in resource-constrained settings.
- Limited skilled professionals: The lack of trained personnel to operate and interpret photoacoustic images poses a barrier to wider adoption.
- Competition from other imaging modalities: Photoacoustic imaging competes with other established imaging technologies like ultrasound and MRI.
Leading Players in the Photoacoustic Imaging Market Market
- Seno Medical
- TomoWave Laboratories Inc
- Advantest Corporation
- iThera Medical GmbH
- Photosound Technologies Inc
- Kibero
- Fujifilm Holdings Corporation (Fujifilm Visualsonics Inc)
- illumiSonics Inc
- InnoLas Laser GmbH
- VibroniX
- Aspectus GmbH
Key Developments in Photoacoustic Imaging Market Sector
- January 2023: Seno Medical partnered with Genetik, Inc., to expand market reach for its Imagio system, enhancing market penetration.
- May 2022: Fujifilm Visualsonics Inc. launched the Vevo F2 system, broadening its product portfolio and strengthening its competitive position.
Strategic Photoacoustic Imaging Market Market Outlook
The photoacoustic imaging market is poised for significant growth in the coming years, driven by continued technological advancements, expanding applications in various medical fields, and favorable regulatory developments. Strategic opportunities lie in developing cost-effective and user-friendly systems, expanding into emerging markets, and fostering collaborations with other imaging modality providers. The integration of artificial intelligence (AI) and machine learning (ML) holds immense potential for further enhancing the capabilities of photoacoustic imaging systems.
Photoacoustic Imaging Market Segmentation
-
1. Type
- 1.1. Imaging Systems
- 1.2. Lasers
- 1.3. Others
-
2. Product Type
- 2.1. Photoacoustic Tomography
- 2.2. Photoacoustic Microscopy
-
3. Application
- 3.1. Oncology
- 3.2. Cardiology
- 3.3. Hematology
- 3.4. Other Applications
-
4. End User
- 4.1. Hospitals
- 4.2. Diagnostic Centers
- 4.3. Academic and Research Institutes
Photoacoustic Imaging Market Segmentation By Geography
-
1. North America
- 1.1. United States
- 1.2. Canada
- 1.3. Mexico
-
2. Europe
- 2.1. Germany
- 2.2. United Kingdom
- 2.3. France
- 2.4. Italy
- 2.5. Spain
- 2.6. Rest of Europe
-
3. Asia Pacific
- 3.1. China
- 3.2. Japan
- 3.3. India
- 3.4. Australia
- 3.5. South Korea
- 3.6. Rest of Asia Pacific
- 4. Rest of the World
Photoacoustic Imaging Market REPORT HIGHLIGHTS
| Aspects | Details |
|---|---|
| Study Period | 2019-2033 |
| Base Year | 2024 |
| Estimated Year | 2025 |
| Forecast Period | 2025-2033 |
| Historical Period | 2019-2024 |
| Growth Rate | CAGR of 15.00% from 2019-2033 |
| Segmentation |
|
Table of Contents
- 1. Introduction
- 1.1. Research Scope
- 1.2. Market Segmentation
- 1.3. Research Methodology
- 1.4. Definitions and Assumptions
- 2. Executive Summary
- 2.1. Introduction
- 3. Market Dynamics
- 3.1. Introduction
- 3.2. Market Drivers
- 3.2.1. Rising Prevalence of Chronic Diseases; Increasing Adoption of Photoacoustic Imaging in Research Studies
- 3.3. Market Restrains
- 3.3.1. High Cost of the Imaging Systems and Lack of Skilled Professionals
- 3.4. Market Trends
- 3.4.1. Oncology Segment is Expected to Witness Significant Growth Over the Forecast Period
- 4. Market Factor Analysis
- 4.1. Porters Five Forces
- 4.2. Supply/Value Chain
- 4.3. PESTEL analysis
- 4.4. Market Entropy
- 4.5. Patent/Trademark Analysis
- 5. Global Photoacoustic Imaging Market Analysis, Insights and Forecast, 2019-2031
- 5.1. Market Analysis, Insights and Forecast - by Type
- 5.1.1. Imaging Systems
- 5.1.2. Lasers
- 5.1.3. Others
- 5.2. Market Analysis, Insights and Forecast - by Product Type
- 5.2.1. Photoacoustic Tomography
- 5.2.2. Photoacoustic Microscopy
- 5.3. Market Analysis, Insights and Forecast - by Application
- 5.3.1. Oncology
- 5.3.2. Cardiology
- 5.3.3. Hematology
- 5.3.4. Other Applications
- 5.4. Market Analysis, Insights and Forecast - by End User
- 5.4.1. Hospitals
- 5.4.2. Diagnostic Centers
- 5.4.3. Academic and Research Institutes
- 5.5. Market Analysis, Insights and Forecast - by Region
- 5.5.1. North America
- 5.5.2. Europe
- 5.5.3. Asia Pacific
- 5.5.4. Rest of the World
- 5.1. Market Analysis, Insights and Forecast - by Type
- 6. North America Photoacoustic Imaging Market Analysis, Insights and Forecast, 2019-2031
- 6.1. Market Analysis, Insights and Forecast - by Type
- 6.1.1. Imaging Systems
- 6.1.2. Lasers
- 6.1.3. Others
- 6.2. Market Analysis, Insights and Forecast - by Product Type
- 6.2.1. Photoacoustic Tomography
- 6.2.2. Photoacoustic Microscopy
- 6.3. Market Analysis, Insights and Forecast - by Application
- 6.3.1. Oncology
- 6.3.2. Cardiology
- 6.3.3. Hematology
- 6.3.4. Other Applications
- 6.4. Market Analysis, Insights and Forecast - by End User
- 6.4.1. Hospitals
- 6.4.2. Diagnostic Centers
- 6.4.3. Academic and Research Institutes
- 6.1. Market Analysis, Insights and Forecast - by Type
- 7. Europe Photoacoustic Imaging Market Analysis, Insights and Forecast, 2019-2031
- 7.1. Market Analysis, Insights and Forecast - by Type
- 7.1.1. Imaging Systems
- 7.1.2. Lasers
- 7.1.3. Others
- 7.2. Market Analysis, Insights and Forecast - by Product Type
- 7.2.1. Photoacoustic Tomography
- 7.2.2. Photoacoustic Microscopy
- 7.3. Market Analysis, Insights and Forecast - by Application
- 7.3.1. Oncology
- 7.3.2. Cardiology
- 7.3.3. Hematology
- 7.3.4. Other Applications
- 7.4. Market Analysis, Insights and Forecast - by End User
- 7.4.1. Hospitals
- 7.4.2. Diagnostic Centers
- 7.4.3. Academic and Research Institutes
- 7.1. Market Analysis, Insights and Forecast - by Type
- 8. Asia Pacific Photoacoustic Imaging Market Analysis, Insights and Forecast, 2019-2031
- 8.1. Market Analysis, Insights and Forecast - by Type
- 8.1.1. Imaging Systems
- 8.1.2. Lasers
- 8.1.3. Others
- 8.2. Market Analysis, Insights and Forecast - by Product Type
- 8.2.1. Photoacoustic Tomography
- 8.2.2. Photoacoustic Microscopy
- 8.3. Market Analysis, Insights and Forecast - by Application
- 8.3.1. Oncology
- 8.3.2. Cardiology
- 8.3.3. Hematology
- 8.3.4. Other Applications
- 8.4. Market Analysis, Insights and Forecast - by End User
- 8.4.1. Hospitals
- 8.4.2. Diagnostic Centers
- 8.4.3. Academic and Research Institutes
- 8.1. Market Analysis, Insights and Forecast - by Type
- 9. Rest of the World Photoacoustic Imaging Market Analysis, Insights and Forecast, 2019-2031
- 9.1. Market Analysis, Insights and Forecast - by Type
- 9.1.1. Imaging Systems
- 9.1.2. Lasers
- 9.1.3. Others
- 9.2. Market Analysis, Insights and Forecast - by Product Type
- 9.2.1. Photoacoustic Tomography
- 9.2.2. Photoacoustic Microscopy
- 9.3. Market Analysis, Insights and Forecast - by Application
- 9.3.1. Oncology
- 9.3.2. Cardiology
- 9.3.3. Hematology
- 9.3.4. Other Applications
- 9.4. Market Analysis, Insights and Forecast - by End User
- 9.4.1. Hospitals
- 9.4.2. Diagnostic Centers
- 9.4.3. Academic and Research Institutes
- 9.1. Market Analysis, Insights and Forecast - by Type
- 10. North America Photoacoustic Imaging Market Analysis, Insights and Forecast, 2019-2031
- 10.1. Market Analysis, Insights and Forecast - By Country/Sub-region
- 10.1.1 United States
- 10.1.2 Canada
- 10.1.3 Mexico
- 11. Europe Photoacoustic Imaging Market Analysis, Insights and Forecast, 2019-2031
- 11.1. Market Analysis, Insights and Forecast - By Country/Sub-region
- 11.1.1 Germany
- 11.1.2 United Kingdom
- 11.1.3 France
- 11.1.4 Spain
- 11.1.5 Italy
- 11.1.6 Spain
- 11.1.7 Belgium
- 11.1.8 Netherland
- 11.1.9 Nordics
- 11.1.10 Rest of Europe
- 12. Asia Pacific Photoacoustic Imaging Market Analysis, Insights and Forecast, 2019-2031
- 12.1. Market Analysis, Insights and Forecast - By Country/Sub-region
- 12.1.1 China
- 12.1.2 Japan
- 12.1.3 India
- 12.1.4 South Korea
- 12.1.5 Southeast Asia
- 12.1.6 Australia
- 12.1.7 Indonesia
- 12.1.8 Phillipes
- 12.1.9 Singapore
- 12.1.10 Thailandc
- 12.1.11 Rest of Asia Pacific
- 13. South America Photoacoustic Imaging Market Analysis, Insights and Forecast, 2019-2031
- 13.1. Market Analysis, Insights and Forecast - By Country/Sub-region
- 13.1.1 Brazil
- 13.1.2 Argentina
- 13.1.3 Peru
- 13.1.4 Chile
- 13.1.5 Colombia
- 13.1.6 Ecuador
- 13.1.7 Venezuela
- 13.1.8 Rest of South America
- 14. North America Photoacoustic Imaging Market Analysis, Insights and Forecast, 2019-2031
- 14.1. Market Analysis, Insights and Forecast - By Country/Sub-region
- 14.1.1 United States
- 14.1.2 Canada
- 14.1.3 Mexico
- 15. MEA Photoacoustic Imaging Market Analysis, Insights and Forecast, 2019-2031
- 15.1. Market Analysis, Insights and Forecast - By Country/Sub-region
- 15.1.1 United Arab Emirates
- 15.1.2 Saudi Arabia
- 15.1.3 South Africa
- 15.1.4 Rest of Middle East and Africa
- 16. Competitive Analysis
- 16.1. Global Market Share Analysis 2024
- 16.2. Company Profiles
- 16.2.1 Seno Medical
- 16.2.1.1. Overview
- 16.2.1.2. Products
- 16.2.1.3. SWOT Analysis
- 16.2.1.4. Recent Developments
- 16.2.1.5. Financials (Based on Availability)
- 16.2.2 TomoWave Laboratories Inc
- 16.2.2.1. Overview
- 16.2.2.2. Products
- 16.2.2.3. SWOT Analysis
- 16.2.2.4. Recent Developments
- 16.2.2.5. Financials (Based on Availability)
- 16.2.3 Advantest Corporation
- 16.2.3.1. Overview
- 16.2.3.2. Products
- 16.2.3.3. SWOT Analysis
- 16.2.3.4. Recent Developments
- 16.2.3.5. Financials (Based on Availability)
- 16.2.4 iThera Medical GmbH
- 16.2.4.1. Overview
- 16.2.4.2. Products
- 16.2.4.3. SWOT Analysis
- 16.2.4.4. Recent Developments
- 16.2.4.5. Financials (Based on Availability)
- 16.2.5 Photosound Technologies Inc
- 16.2.5.1. Overview
- 16.2.5.2. Products
- 16.2.5.3. SWOT Analysis
- 16.2.5.4. Recent Developments
- 16.2.5.5. Financials (Based on Availability)
- 16.2.6 Kibero
- 16.2.6.1. Overview
- 16.2.6.2. Products
- 16.2.6.3. SWOT Analysis
- 16.2.6.4. Recent Developments
- 16.2.6.5. Financials (Based on Availability)
- 16.2.7 Fujifilm Holdings Corporation (Fujifilm Visualsonics Inc )
- 16.2.7.1. Overview
- 16.2.7.2. Products
- 16.2.7.3. SWOT Analysis
- 16.2.7.4. Recent Developments
- 16.2.7.5. Financials (Based on Availability)
- 16.2.8 illumiSonics Inc
- 16.2.8.1. Overview
- 16.2.8.2. Products
- 16.2.8.3. SWOT Analysis
- 16.2.8.4. Recent Developments
- 16.2.8.5. Financials (Based on Availability)
- 16.2.9 InnoLas Laser GmbH
- 16.2.9.1. Overview
- 16.2.9.2. Products
- 16.2.9.3. SWOT Analysis
- 16.2.9.4. Recent Developments
- 16.2.9.5. Financials (Based on Availability)
- 16.2.10 VibroniX
- 16.2.10.1. Overview
- 16.2.10.2. Products
- 16.2.10.3. SWOT Analysis
- 16.2.10.4. Recent Developments
- 16.2.10.5. Financials (Based on Availability)
- 16.2.11 Aspectus GmbH
- 16.2.11.1. Overview
- 16.2.11.2. Products
- 16.2.11.3. SWOT Analysis
- 16.2.11.4. Recent Developments
- 16.2.11.5. Financials (Based on Availability)
- 16.2.1 Seno Medical
List of Figures
- Figure 1: Global Photoacoustic Imaging Market Revenue Breakdown (Million, %) by Region 2024 & 2032
- Figure 2: North America Photoacoustic Imaging Market Revenue (Million), by Country 2024 & 2032
- Figure 3: North America Photoacoustic Imaging Market Revenue Share (%), by Country 2024 & 2032
- Figure 4: Europe Photoacoustic Imaging Market Revenue (Million), by Country 2024 & 2032
- Figure 5: Europe Photoacoustic Imaging Market Revenue Share (%), by Country 2024 & 2032
- Figure 6: Asia Pacific Photoacoustic Imaging Market Revenue (Million), by Country 2024 & 2032
- Figure 7: Asia Pacific Photoacoustic Imaging Market Revenue Share (%), by Country 2024 & 2032
- Figure 8: South America Photoacoustic Imaging Market Revenue (Million), by Country 2024 & 2032
- Figure 9: South America Photoacoustic Imaging Market Revenue Share (%), by Country 2024 & 2032
- Figure 10: North America Photoacoustic Imaging Market Revenue (Million), by Country 2024 & 2032
- Figure 11: North America Photoacoustic Imaging Market Revenue Share (%), by Country 2024 & 2032
- Figure 12: MEA Photoacoustic Imaging Market Revenue (Million), by Country 2024 & 2032
- Figure 13: MEA Photoacoustic Imaging Market Revenue Share (%), by Country 2024 & 2032
- Figure 14: North America Photoacoustic Imaging Market Revenue (Million), by Type 2024 & 2032
- Figure 15: North America Photoacoustic Imaging Market Revenue Share (%), by Type 2024 & 2032
- Figure 16: North America Photoacoustic Imaging Market Revenue (Million), by Product Type 2024 & 2032
- Figure 17: North America Photoacoustic Imaging Market Revenue Share (%), by Product Type 2024 & 2032
- Figure 18: North America Photoacoustic Imaging Market Revenue (Million), by Application 2024 & 2032
- Figure 19: North America Photoacoustic Imaging Market Revenue Share (%), by Application 2024 & 2032
- Figure 20: North America Photoacoustic Imaging Market Revenue (Million), by End User 2024 & 2032
- Figure 21: North America Photoacoustic Imaging Market Revenue Share (%), by End User 2024 & 2032
- Figure 22: North America Photoacoustic Imaging Market Revenue (Million), by Country 2024 & 2032
- Figure 23: North America Photoacoustic Imaging Market Revenue Share (%), by Country 2024 & 2032
- Figure 24: Europe Photoacoustic Imaging Market Revenue (Million), by Type 2024 & 2032
- Figure 25: Europe Photoacoustic Imaging Market Revenue Share (%), by Type 2024 & 2032
- Figure 26: Europe Photoacoustic Imaging Market Revenue (Million), by Product Type 2024 & 2032
- Figure 27: Europe Photoacoustic Imaging Market Revenue Share (%), by Product Type 2024 & 2032
- Figure 28: Europe Photoacoustic Imaging Market Revenue (Million), by Application 2024 & 2032
- Figure 29: Europe Photoacoustic Imaging Market Revenue Share (%), by Application 2024 & 2032
- Figure 30: Europe Photoacoustic Imaging Market Revenue (Million), by End User 2024 & 2032
- Figure 31: Europe Photoacoustic Imaging Market Revenue Share (%), by End User 2024 & 2032
- Figure 32: Europe Photoacoustic Imaging Market Revenue (Million), by Country 2024 & 2032
- Figure 33: Europe Photoacoustic Imaging Market Revenue Share (%), by Country 2024 & 2032
- Figure 34: Asia Pacific Photoacoustic Imaging Market Revenue (Million), by Type 2024 & 2032
- Figure 35: Asia Pacific Photoacoustic Imaging Market Revenue Share (%), by Type 2024 & 2032
- Figure 36: Asia Pacific Photoacoustic Imaging Market Revenue (Million), by Product Type 2024 & 2032
- Figure 37: Asia Pacific Photoacoustic Imaging Market Revenue Share (%), by Product Type 2024 & 2032
- Figure 38: Asia Pacific Photoacoustic Imaging Market Revenue (Million), by Application 2024 & 2032
- Figure 39: Asia Pacific Photoacoustic Imaging Market Revenue Share (%), by Application 2024 & 2032
- Figure 40: Asia Pacific Photoacoustic Imaging Market Revenue (Million), by End User 2024 & 2032
- Figure 41: Asia Pacific Photoacoustic Imaging Market Revenue Share (%), by End User 2024 & 2032
- Figure 42: Asia Pacific Photoacoustic Imaging Market Revenue (Million), by Country 2024 & 2032
- Figure 43: Asia Pacific Photoacoustic Imaging Market Revenue Share (%), by Country 2024 & 2032
- Figure 44: Rest of the World Photoacoustic Imaging Market Revenue (Million), by Type 2024 & 2032
- Figure 45: Rest of the World Photoacoustic Imaging Market Revenue Share (%), by Type 2024 & 2032
- Figure 46: Rest of the World Photoacoustic Imaging Market Revenue (Million), by Product Type 2024 & 2032
- Figure 47: Rest of the World Photoacoustic Imaging Market Revenue Share (%), by Product Type 2024 & 2032
- Figure 48: Rest of the World Photoacoustic Imaging Market Revenue (Million), by Application 2024 & 2032
- Figure 49: Rest of the World Photoacoustic Imaging Market Revenue Share (%), by Application 2024 & 2032
- Figure 50: Rest of the World Photoacoustic Imaging Market Revenue (Million), by End User 2024 & 2032
- Figure 51: Rest of the World Photoacoustic Imaging Market Revenue Share (%), by End User 2024 & 2032
- Figure 52: Rest of the World Photoacoustic Imaging Market Revenue (Million), by Country 2024 & 2032
- Figure 53: Rest of the World Photoacoustic Imaging Market Revenue Share (%), by Country 2024 & 2032
List of Tables
- Table 1: Global Photoacoustic Imaging Market Revenue Million Forecast, by Region 2019 & 2032
- Table 2: Global Photoacoustic Imaging Market Revenue Million Forecast, by Type 2019 & 2032
- Table 3: Global Photoacoustic Imaging Market Revenue Million Forecast, by Product Type 2019 & 2032
- Table 4: Global Photoacoustic Imaging Market Revenue Million Forecast, by Application 2019 & 2032
- Table 5: Global Photoacoustic Imaging Market Revenue Million Forecast, by End User 2019 & 2032
- Table 6: Global Photoacoustic Imaging Market Revenue Million Forecast, by Region 2019 & 2032
- Table 7: Global Photoacoustic Imaging Market Revenue Million Forecast, by Country 2019 & 2032
- Table 8: United States Photoacoustic Imaging Market Revenue (Million) Forecast, by Application 2019 & 2032
- Table 9: Canada Photoacoustic Imaging Market Revenue (Million) Forecast, by Application 2019 & 2032
- Table 10: Mexico Photoacoustic Imaging Market Revenue (Million) Forecast, by Application 2019 & 2032
- Table 11: Global Photoacoustic Imaging Market Revenue Million Forecast, by Country 2019 & 2032
- Table 12: Germany Photoacoustic Imaging Market Revenue (Million) Forecast, by Application 2019 & 2032
- Table 13: United Kingdom Photoacoustic Imaging Market Revenue (Million) Forecast, by Application 2019 & 2032
- Table 14: France Photoacoustic Imaging Market Revenue (Million) Forecast, by Application 2019 & 2032
- Table 15: Spain Photoacoustic Imaging Market Revenue (Million) Forecast, by Application 2019 & 2032
- Table 16: Italy Photoacoustic Imaging Market Revenue (Million) Forecast, by Application 2019 & 2032
- Table 17: Spain Photoacoustic Imaging Market Revenue (Million) Forecast, by Application 2019 & 2032
- Table 18: Belgium Photoacoustic Imaging Market Revenue (Million) Forecast, by Application 2019 & 2032
- Table 19: Netherland Photoacoustic Imaging Market Revenue (Million) Forecast, by Application 2019 & 2032
- Table 20: Nordics Photoacoustic Imaging Market Revenue (Million) Forecast, by Application 2019 & 2032
- Table 21: Rest of Europe Photoacoustic Imaging Market Revenue (Million) Forecast, by Application 2019 & 2032
- Table 22: Global Photoacoustic Imaging Market Revenue Million Forecast, by Country 2019 & 2032
- Table 23: China Photoacoustic Imaging Market Revenue (Million) Forecast, by Application 2019 & 2032
- Table 24: Japan Photoacoustic Imaging Market Revenue (Million) Forecast, by Application 2019 & 2032
- Table 25: India Photoacoustic Imaging Market Revenue (Million) Forecast, by Application 2019 & 2032
- Table 26: South Korea Photoacoustic Imaging Market Revenue (Million) Forecast, by Application 2019 & 2032
- Table 27: Southeast Asia Photoacoustic Imaging Market Revenue (Million) Forecast, by Application 2019 & 2032
- Table 28: Australia Photoacoustic Imaging Market Revenue (Million) Forecast, by Application 2019 & 2032
- Table 29: Indonesia Photoacoustic Imaging Market Revenue (Million) Forecast, by Application 2019 & 2032
- Table 30: Phillipes Photoacoustic Imaging Market Revenue (Million) Forecast, by Application 2019 & 2032
- Table 31: Singapore Photoacoustic Imaging Market Revenue (Million) Forecast, by Application 2019 & 2032
- Table 32: Thailandc Photoacoustic Imaging Market Revenue (Million) Forecast, by Application 2019 & 2032
- Table 33: Rest of Asia Pacific Photoacoustic Imaging Market Revenue (Million) Forecast, by Application 2019 & 2032
- Table 34: Global Photoacoustic Imaging Market Revenue Million Forecast, by Country 2019 & 2032
- Table 35: Brazil Photoacoustic Imaging Market Revenue (Million) Forecast, by Application 2019 & 2032
- Table 36: Argentina Photoacoustic Imaging Market Revenue (Million) Forecast, by Application 2019 & 2032
- Table 37: Peru Photoacoustic Imaging Market Revenue (Million) Forecast, by Application 2019 & 2032
- Table 38: Chile Photoacoustic Imaging Market Revenue (Million) Forecast, by Application 2019 & 2032
- Table 39: Colombia Photoacoustic Imaging Market Revenue (Million) Forecast, by Application 2019 & 2032
- Table 40: Ecuador Photoacoustic Imaging Market Revenue (Million) Forecast, by Application 2019 & 2032
- Table 41: Venezuela Photoacoustic Imaging Market Revenue (Million) Forecast, by Application 2019 & 2032
- Table 42: Rest of South America Photoacoustic Imaging Market Revenue (Million) Forecast, by Application 2019 & 2032
- Table 43: Global Photoacoustic Imaging Market Revenue Million Forecast, by Country 2019 & 2032
- Table 44: United States Photoacoustic Imaging Market Revenue (Million) Forecast, by Application 2019 & 2032
- Table 45: Canada Photoacoustic Imaging Market Revenue (Million) Forecast, by Application 2019 & 2032
- Table 46: Mexico Photoacoustic Imaging Market Revenue (Million) Forecast, by Application 2019 & 2032
- Table 47: Global Photoacoustic Imaging Market Revenue Million Forecast, by Country 2019 & 2032
- Table 48: United Arab Emirates Photoacoustic Imaging Market Revenue (Million) Forecast, by Application 2019 & 2032
- Table 49: Saudi Arabia Photoacoustic Imaging Market Revenue (Million) Forecast, by Application 2019 & 2032
- Table 50: South Africa Photoacoustic Imaging Market Revenue (Million) Forecast, by Application 2019 & 2032
- Table 51: Rest of Middle East and Africa Photoacoustic Imaging Market Revenue (Million) Forecast, by Application 2019 & 2032
- Table 52: Global Photoacoustic Imaging Market Revenue Million Forecast, by Type 2019 & 2032
- Table 53: Global Photoacoustic Imaging Market Revenue Million Forecast, by Product Type 2019 & 2032
- Table 54: Global Photoacoustic Imaging Market Revenue Million Forecast, by Application 2019 & 2032
- Table 55: Global Photoacoustic Imaging Market Revenue Million Forecast, by End User 2019 & 2032
- Table 56: Global Photoacoustic Imaging Market Revenue Million Forecast, by Country 2019 & 2032
- Table 57: United States Photoacoustic Imaging Market Revenue (Million) Forecast, by Application 2019 & 2032
- Table 58: Canada Photoacoustic Imaging Market Revenue (Million) Forecast, by Application 2019 & 2032
- Table 59: Mexico Photoacoustic Imaging Market Revenue (Million) Forecast, by Application 2019 & 2032
- Table 60: Global Photoacoustic Imaging Market Revenue Million Forecast, by Type 2019 & 2032
- Table 61: Global Photoacoustic Imaging Market Revenue Million Forecast, by Product Type 2019 & 2032
- Table 62: Global Photoacoustic Imaging Market Revenue Million Forecast, by Application 2019 & 2032
- Table 63: Global Photoacoustic Imaging Market Revenue Million Forecast, by End User 2019 & 2032
- Table 64: Global Photoacoustic Imaging Market Revenue Million Forecast, by Country 2019 & 2032
- Table 65: Germany Photoacoustic Imaging Market Revenue (Million) Forecast, by Application 2019 & 2032
- Table 66: United Kingdom Photoacoustic Imaging Market Revenue (Million) Forecast, by Application 2019 & 2032
- Table 67: France Photoacoustic Imaging Market Revenue (Million) Forecast, by Application 2019 & 2032
- Table 68: Italy Photoacoustic Imaging Market Revenue (Million) Forecast, by Application 2019 & 2032
- Table 69: Spain Photoacoustic Imaging Market Revenue (Million) Forecast, by Application 2019 & 2032
- Table 70: Rest of Europe Photoacoustic Imaging Market Revenue (Million) Forecast, by Application 2019 & 2032
- Table 71: Global Photoacoustic Imaging Market Revenue Million Forecast, by Type 2019 & 2032
- Table 72: Global Photoacoustic Imaging Market Revenue Million Forecast, by Product Type 2019 & 2032
- Table 73: Global Photoacoustic Imaging Market Revenue Million Forecast, by Application 2019 & 2032
- Table 74: Global Photoacoustic Imaging Market Revenue Million Forecast, by End User 2019 & 2032
- Table 75: Global Photoacoustic Imaging Market Revenue Million Forecast, by Country 2019 & 2032
- Table 76: China Photoacoustic Imaging Market Revenue (Million) Forecast, by Application 2019 & 2032
- Table 77: Japan Photoacoustic Imaging Market Revenue (Million) Forecast, by Application 2019 & 2032
- Table 78: India Photoacoustic Imaging Market Revenue (Million) Forecast, by Application 2019 & 2032
- Table 79: Australia Photoacoustic Imaging Market Revenue (Million) Forecast, by Application 2019 & 2032
- Table 80: South Korea Photoacoustic Imaging Market Revenue (Million) Forecast, by Application 2019 & 2032
- Table 81: Rest of Asia Pacific Photoacoustic Imaging Market Revenue (Million) Forecast, by Application 2019 & 2032
- Table 82: Global Photoacoustic Imaging Market Revenue Million Forecast, by Type 2019 & 2032
- Table 83: Global Photoacoustic Imaging Market Revenue Million Forecast, by Product Type 2019 & 2032
- Table 84: Global Photoacoustic Imaging Market Revenue Million Forecast, by Application 2019 & 2032
- Table 85: Global Photoacoustic Imaging Market Revenue Million Forecast, by End User 2019 & 2032
- Table 86: Global Photoacoustic Imaging Market Revenue Million Forecast, by Country 2019 & 2032
Frequently Asked Questions
1. What is the projected Compound Annual Growth Rate (CAGR) of the Photoacoustic Imaging Market?
The projected CAGR is approximately 15.00%.
2. Which companies are prominent players in the Photoacoustic Imaging Market?
Key companies in the market include Seno Medical, TomoWave Laboratories Inc, Advantest Corporation, iThera Medical GmbH, Photosound Technologies Inc, Kibero, Fujifilm Holdings Corporation (Fujifilm Visualsonics Inc ), illumiSonics Inc, InnoLas Laser GmbH, VibroniX, Aspectus GmbH.
3. What are the main segments of the Photoacoustic Imaging Market?
The market segments include Type, Product Type, Application, End User.
4. Can you provide details about the market size?
The market size is estimated to be USD 108.92 Million as of 2022.
5. What are some drivers contributing to market growth?
Rising Prevalence of Chronic Diseases; Increasing Adoption of Photoacoustic Imaging in Research Studies.
6. What are the notable trends driving market growth?
Oncology Segment is Expected to Witness Significant Growth Over the Forecast Period.
7. Are there any restraints impacting market growth?
High Cost of the Imaging Systems and Lack of Skilled Professionals.
8. Can you provide examples of recent developments in the market?
January 2023: Seno Medical entered into an exclusive distributor agreement with Genetik, Inc., to market, sell, and service the company's Imagio Opto-Acoustic/Ultrasound (OA/US) Breast Imaging System.
9. What pricing options are available for accessing the report?
Pricing options include single-user, multi-user, and enterprise licenses priced at USD 4750, USD 5250, and USD 8750 respectively.
10. Is the market size provided in terms of value or volume?
The market size is provided in terms of value, measured in Million.
11. Are there any specific market keywords associated with the report?
Yes, the market keyword associated with the report is "Photoacoustic Imaging Market," which aids in identifying and referencing the specific market segment covered.
12. How do I determine which pricing option suits my needs best?
The pricing options vary based on user requirements and access needs. Individual users may opt for single-user licenses, while businesses requiring broader access may choose multi-user or enterprise licenses for cost-effective access to the report.
13. Are there any additional resources or data provided in the Photoacoustic Imaging Market report?
While the report offers comprehensive insights, it's advisable to review the specific contents or supplementary materials provided to ascertain if additional resources or data are available.
14. How can I stay updated on further developments or reports in the Photoacoustic Imaging Market?
To stay informed about further developments, trends, and reports in the Photoacoustic Imaging Market, consider subscribing to industry newsletters, following relevant companies and organizations, or regularly checking reputable industry news sources and publications.
Methodology
Step 1 - Identification of Relevant Samples Size from Population Database


Step 2 - Approaches for Defining Global Market Size (Value, Volume* & Price*)

Note*: In applicable scenarios
Step 3 - Data Sources
Primary Research
- Web Analytics
- Survey Reports
- Research Institute
- Latest Research Reports
- Opinion Leaders
Secondary Research
- Annual Reports
- White Paper
- Latest Press Release
- Industry Association
- Paid Database
- Investor Presentations

Step 4 - Data Triangulation
Involves using different sources of information in order to increase the validity of a study
These sources are likely to be stakeholders in a program - participants, other researchers, program staff, other community members, and so on.
Then we put all data in single framework & apply various statistical tools to find out the dynamic on the market.
During the analysis stage, feedback from the stakeholder groups would be compared to determine areas of agreement as well as areas of divergence


