
Key Insights
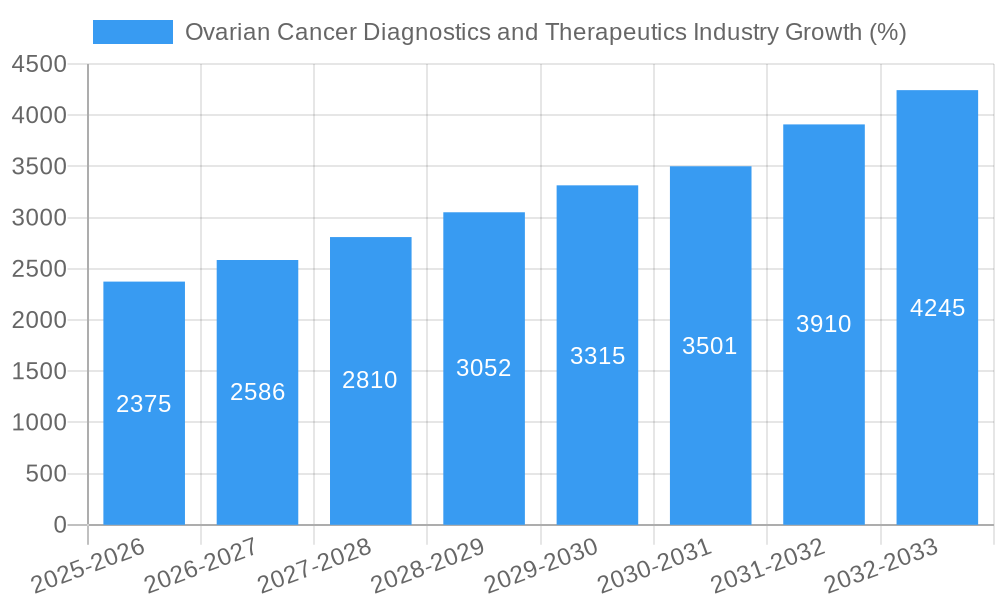
The Ovarian Cancer Diagnostics and Therapeutics market is experiencing robust growth, projected to reach a substantial size driven by increasing prevalence of ovarian cancer, advancements in diagnostic technologies, and the development of novel targeted therapies. The market's Compound Annual Growth Rate (CAGR) of 9.50% from 2019 to 2024 suggests a significant upward trajectory. This growth is fueled by several factors, including the rising incidence of ovarian cancer globally, particularly epithelial ovarian tumors which constitute a significant portion of the diagnosed cases. The increasing adoption of advanced diagnostic techniques, such as improved imaging modalities and biomarker analysis, enables earlier detection and improved treatment outcomes. Furthermore, the pipeline of innovative therapeutics, including targeted therapies and immunotherapies, offers promising treatment options and contributes to market expansion. While challenges remain, such as the often late-stage diagnosis of ovarian cancer and the high cost of novel therapies, the overall market outlook remains positive.
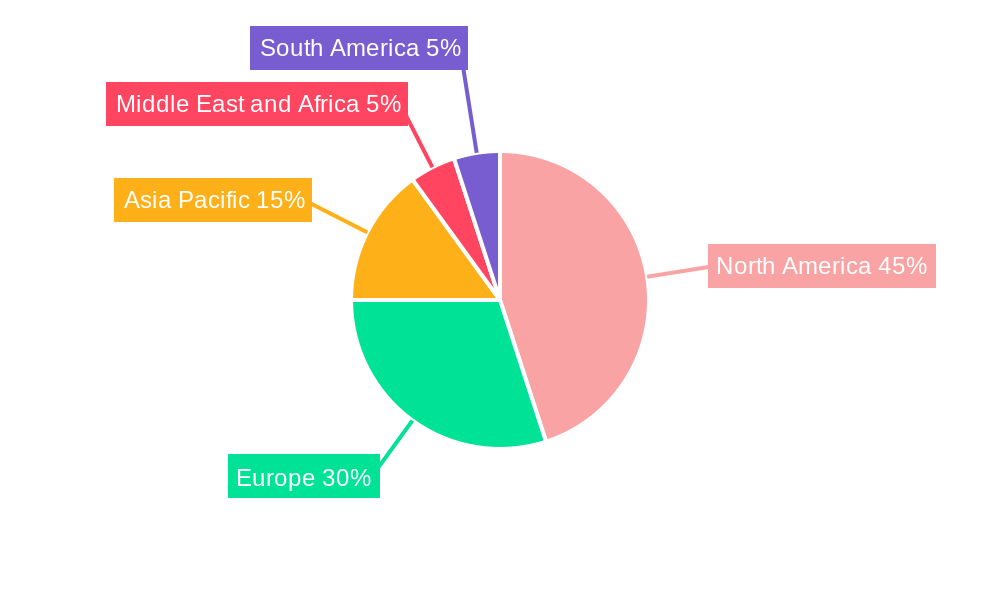
Segmentation reveals a strong emphasis on both diagnostics and therapeutics, with the diagnostics segment benefiting from technological advancements and the therapeutics segment driven by the development of more effective treatments. Epithelial ovarian tumors represent a major segment, reflecting their prevalence. Geographical distribution shows North America and Europe currently holding significant market shares, but Asia-Pacific is expected to exhibit substantial growth potential due to increasing healthcare spending and rising awareness. Key players such as Boehringer Ingelheim, AstraZeneca, and others are actively engaged in R&D and market expansion, further stimulating market dynamics and driving competition. The ongoing research in personalized medicine and the development of companion diagnostics are also expected to shape the future landscape, leading to more precise and effective treatments and a larger overall market size in the coming years.
This comprehensive report provides an in-depth analysis of the Ovarian Cancer Diagnostics and Therapeutics industry, offering crucial insights for stakeholders, investors, and industry professionals. The study period covers 2019-2033, with a base year of 2025 and a forecast period of 2025-2033. The report meticulously examines market segmentation, competitive dynamics, technological advancements, and future growth potential, providing actionable intelligence for informed decision-making. The global market size in 2025 is estimated at xx Million, and the Compound Annual Growth Rate (CAGR) during the forecast period is projected to be xx%.
Ovarian Cancer Diagnostics and Therapeutics Industry Market Structure & Competitive Dynamics
The ovarian cancer diagnostics and therapeutics market is characterized by a moderately concentrated structure with several key players vying for market share. Market concentration is further analyzed by examining the Herfindahl-Hirschman Index (HHI), which is predicted to be xx in 2025. Innovation ecosystems are vibrant, driven by significant R&D investments and collaborations between pharmaceutical companies, biotech firms, and academic institutions. Regulatory frameworks, particularly those governing drug approvals and reimbursement policies, significantly influence market dynamics. Product substitutes, while limited, include alternative therapeutic approaches and diagnostic methods, impacting market competition. End-user trends, including the increasing preference for targeted therapies and minimally invasive diagnostic procedures, are shaping market demand.
Mergers and acquisitions (M&A) activities have played a significant role in shaping the competitive landscape. Over the historical period (2019-2024), the total value of M&A deals in the ovarian cancer diagnostics and therapeutics sector is estimated to be xx Million. Key examples include (but are not limited to): the acquisition of xx company by xx company in xx for xx Million.
Ovarian Cancer Diagnostics and Therapeutics Industry Industry Trends & Insights
The ovarian cancer diagnostics and therapeutics market is experiencing robust growth, driven primarily by increasing prevalence of ovarian cancer, rising awareness about early detection and treatment, and technological advancements in diagnostic tools and therapeutic agents. The CAGR of the market is projected to be xx% from 2025 to 2033. Technological disruptions, such as the development of personalized medicine approaches and liquid biopsies, are revolutionizing diagnostic capabilities and treatment strategies. Consumer preferences are shifting towards less invasive procedures and targeted therapies with improved efficacy and fewer side effects. The market penetration of novel therapeutics is gradually increasing, reflecting a growing adoption of advanced treatment options. The competitive dynamics are intense, marked by ongoing innovation, strategic partnerships, and the entry of new players. Market penetration for targeted therapies is projected to reach xx% by 2033. Further growth is fueled by an expanding elderly population globally, increased funding for research and development, and supportive government policies aimed at improving cancer care. The market is further segmented by geographical region, with North America holding the largest share, followed by Europe and Asia Pacific.
Dominant Markets & Segments in Ovarian Cancer Diagnostics and Therapeutics Industry
Leading Region: North America holds a dominant position in the global ovarian cancer diagnostics and therapeutics market, driven by factors such as advanced healthcare infrastructure, high healthcare expenditure, and a high prevalence of ovarian cancer.
Dominant Cancer Type: Epithelial ovarian tumors account for the largest segment of the market due to their high prevalence and the availability of diverse treatment options.
Leading Modality: Therapeutics represent a larger market segment compared to diagnostics, reflecting the significant demand for effective treatment strategies for ovarian cancer.
Key Drivers for North American Dominance:
- Advanced healthcare infrastructure and technological capabilities.
- High healthcare expenditure and robust reimbursement policies.
- Presence of major pharmaceutical and biotech companies.
- Strong research and development activities.
- High prevalence of ovarian cancer and increased awareness of early detection and treatment.
Detailed Dominance Analysis: The dominance of North America stems from a confluence of factors, including robust regulatory frameworks that support the development and marketing of innovative therapies. The high prevalence of ovarian cancer in the region, coupled with an aging population, creates a substantial demand for diagnostic and therapeutic solutions. The strong presence of leading pharmaceutical and biotechnology companies accelerates innovation and market penetration of novel treatments. Furthermore, favorable reimbursement policies enable wider access to advanced therapies, further bolstering market growth.
Ovarian Cancer Diagnostics and Therapeutics Industry Product Innovations
Recent years have witnessed significant advancements in ovarian cancer diagnostics and therapeutics, with a focus on developing more precise and effective treatments. Innovations include the development of targeted therapies based on specific genetic mutations, such as PARP inhibitors and immunotherapy agents. Advanced imaging techniques, including MRI and PET scans, are improving diagnostic accuracy and enabling earlier detection. Liquid biopsies are emerging as a promising tool for early detection and monitoring of treatment response. These innovations offer improved patient outcomes, reduced side effects, and increased treatment efficacy, thereby driving significant market growth. The market is witnessing a shift from traditional chemotherapy-based treatments to more targeted therapies that offer improved efficacy and reduced toxicity. The integration of artificial intelligence and machine learning in diagnostics and personalized medicine is revolutionizing patient care.
Report Segmentation & Scope
The report provides a detailed segmentation of the ovarian cancer diagnostics and therapeutics market based on cancer type, modality, and geography.
Cancer Type:
Epithelial Ovarian Tumors: This segment holds the largest market share, driven by the high prevalence of this cancer type. The market size for this segment is projected to reach xx Million by 2033. Competitive dynamics are intense, with major players focusing on developing targeted therapies.
Ovarian Germ Cell Tumors: This segment represents a smaller market share compared to epithelial ovarian tumors. Growth in this segment is projected at xx% during the forecast period, driven by advancements in targeted therapies and improved diagnostic capabilities.
Other Cancer Types: This segment includes rare ovarian cancers, with a relatively smaller market size. Growth in this segment depends on research developments and regulatory approvals.
Modality:
Diagnosis: This segment includes various diagnostic techniques, such as imaging, biopsies, and genetic testing. Market growth is fueled by the adoption of advanced diagnostic technologies, improving early detection rates.
Therapeutics: This segment encompasses various therapeutic approaches, including chemotherapy, targeted therapy, and immunotherapy. Growth is projected to be significantly higher than in the diagnostics segment, driven by the emergence of novel and effective therapies.
Key Drivers of Ovarian Cancer Diagnostics and Therapeutics Industry Growth
The growth of the ovarian cancer diagnostics and therapeutics market is primarily driven by several key factors:
Rising prevalence of ovarian cancer: Globally, the incidence of ovarian cancer continues to increase, particularly in developed countries.
Technological advancements: Improvements in diagnostic imaging and the development of more targeted and effective therapies are significantly impacting market growth.
Favorable regulatory environment: Regulatory approvals of novel drugs and diagnostic tools fuel market expansion.
Increased healthcare spending: Rising healthcare expenditure, especially in developed nations, fuels investments in research, development, and treatment.
Challenges in the Ovarian Cancer Diagnostics and Therapeutics Industry Sector
Despite substantial growth, the ovarian cancer diagnostics and therapeutics market faces some notable challenges.
High cost of treatment: Many advanced therapies are expensive, limiting access for patients in low- and middle-income countries. This results in a xx% reduction in overall market penetration based on current pricing models.
Regulatory hurdles: The lengthy and complex regulatory process for drug and diagnostic approval can hinder market entry for new products.
Drug resistance: The development of drug resistance is a major challenge, necessitating the development of new treatment strategies.
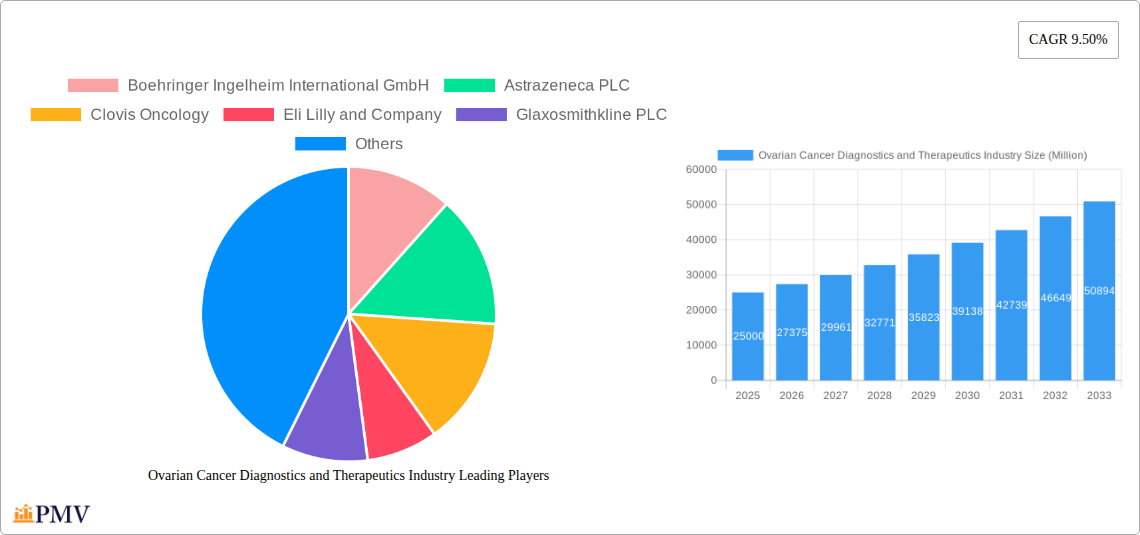
Leading Players in the Ovarian Cancer Diagnostics and Therapeutics Industry Market
- Boehringer Ingelheim International GmbH
- AstraZeneca PLC
- Clovis Oncology
- Eli Lilly and Company
- GlaxoSmithKline PLC
- Siemens Healthineers AG
- Johnson & Johnson (Janssen Pharmaceuticals)
- Abbvie (Allergan PLC)
- Bristol Myers Squibb Company
- F. Hoffmann-La Roche Ltd
- Amneal Pharmaceuticals LLC
- Pfizer Inc
Key Developments in Ovarian Cancer Diagnostics and Therapeutics Industry Sector
May 2022: HLB's subsidiary, Elevar Therapeutics, launched Apealea, an ovarian cancer treatment, in Germany after listing it on Gelbe Liste. This expands treatment options available in the German market.
May 2022: ImmunoGen received FDA acceptance for a Biologics License Application for mirvetuximab soravtansine, a potential new treatment for platinum-resistant ovarian cancer. This signals a potential significant advancement in treatment for a challenging patient population.
Strategic Ovarian Cancer Diagnostics and Therapeutics Industry Market Outlook
The future of the ovarian cancer diagnostics and therapeutics market is bright, driven by ongoing research and development, technological advancements, and a growing understanding of the disease. The market is poised for substantial growth, with significant opportunities for companies engaged in the development and commercialization of innovative diagnostic tools and therapeutic agents. Further growth will be driven by the adoption of personalized medicine approaches, improving diagnostic capabilities, and an expanding pipeline of new drugs. Strategic partnerships and collaborations are expected to play a key role in shaping the competitive landscape. A focus on addressing unmet medical needs and improving patient outcomes will be crucial for success in this dynamic market.
Ovarian Cancer Diagnostics and Therapeutics Industry Segmentation
-
1. Cancer Type
- 1.1. Epithelial Ovarian Tumors
- 1.2. Ovarian Germ Cell Tumors
- 1.3. Other Cancer Types
-
2. Modality
-
2.1. Diagnosis
- 2.1.1. Biopsy
- 2.1.2. Blood Tests
- 2.1.3. Ultrasound
- 2.1.4. PET
- 2.1.5. CT Scan
- 2.1.6. Other Diagnosis
-
2.2. Therapeutics
- 2.2.1. Chemotherapy
- 2.2.2. Radiation Therapy
- 2.2.3. Immunotherapy
- 2.2.4. Hormonal Therapy
- 2.2.5. Other Therapeutics
-
2.1. Diagnosis
Ovarian Cancer Diagnostics and Therapeutics Industry Segmentation By Geography
-
1. North America
- 1.1. United States
- 1.2. Canada
- 1.3. Mexico
-
2. Europe
- 2.1. Germany
- 2.2. United Kingdom
- 2.3. France
- 2.4. Italy
- 2.5. Spain
- 2.6. Rest of Europe
-
3. Asia Pacific
- 3.1. China
- 3.2. Japan
- 3.3. India
- 3.4. Australia
- 3.5. South Korea
- 3.6. Rest of Asia Pacific
-
4. Middle East and Africa
- 4.1. GCC
- 4.2. South Africa
- 4.3. Rest of Middle East and Africa
-
5. South America
- 5.1. Brazil
- 5.2. Argentina
- 5.3. Rest of South America
Ovarian Cancer Diagnostics and Therapeutics Industry REPORT HIGHLIGHTS
| Aspects | Details |
|---|---|
| Study Period | 2019-2033 |
| Base Year | 2024 |
| Estimated Year | 2025 |
| Forecast Period | 2025-2033 |
| Historical Period | 2019-2024 |
| Growth Rate | CAGR of 9.50% from 2019-2033 |
| Segmentation |
|
Table of Contents
- 1. Introduction
- 1.1. Research Scope
- 1.2. Market Segmentation
- 1.3. Research Methodology
- 1.4. Definitions and Assumptions
- 2. Executive Summary
- 2.1. Introduction
- 3. Market Dynamics
- 3.1. Introduction
- 3.2. Market Drivers
- 3.2.1. Increasing Burden of Ovarian Cancer; Use of Combination Therapies for the Treatment of Ovarian Cancer
- 3.3. Market Restrains
- 3.3.1. Lack of Accurate Diagnosis of Ovarian Cancer; Lack of Awareness in Emerging and Low Income Economies
- 3.4. Market Trends
- 3.4.1. CT Scan Segment is Expected to Show Better Growth Over the Forecast Period
- 4. Market Factor Analysis
- 4.1. Porters Five Forces
- 4.2. Supply/Value Chain
- 4.3. PESTEL analysis
- 4.4. Market Entropy
- 4.5. Patent/Trademark Analysis
- 5. Global Ovarian Cancer Diagnostics and Therapeutics Industry Analysis, Insights and Forecast, 2019-2031
- 5.1. Market Analysis, Insights and Forecast - by Cancer Type
- 5.1.1. Epithelial Ovarian Tumors
- 5.1.2. Ovarian Germ Cell Tumors
- 5.1.3. Other Cancer Types
- 5.2. Market Analysis, Insights and Forecast - by Modality
- 5.2.1. Diagnosis
- 5.2.1.1. Biopsy
- 5.2.1.2. Blood Tests
- 5.2.1.3. Ultrasound
- 5.2.1.4. PET
- 5.2.1.5. CT Scan
- 5.2.1.6. Other Diagnosis
- 5.2.2. Therapeutics
- 5.2.2.1. Chemotherapy
- 5.2.2.2. Radiation Therapy
- 5.2.2.3. Immunotherapy
- 5.2.2.4. Hormonal Therapy
- 5.2.2.5. Other Therapeutics
- 5.2.1. Diagnosis
- 5.3. Market Analysis, Insights and Forecast - by Region
- 5.3.1. North America
- 5.3.2. Europe
- 5.3.3. Asia Pacific
- 5.3.4. Middle East and Africa
- 5.3.5. South America
- 5.1. Market Analysis, Insights and Forecast - by Cancer Type
- 6. North America Ovarian Cancer Diagnostics and Therapeutics Industry Analysis, Insights and Forecast, 2019-2031
- 6.1. Market Analysis, Insights and Forecast - by Cancer Type
- 6.1.1. Epithelial Ovarian Tumors
- 6.1.2. Ovarian Germ Cell Tumors
- 6.1.3. Other Cancer Types
- 6.2. Market Analysis, Insights and Forecast - by Modality
- 6.2.1. Diagnosis
- 6.2.1.1. Biopsy
- 6.2.1.2. Blood Tests
- 6.2.1.3. Ultrasound
- 6.2.1.4. PET
- 6.2.1.5. CT Scan
- 6.2.1.6. Other Diagnosis
- 6.2.2. Therapeutics
- 6.2.2.1. Chemotherapy
- 6.2.2.2. Radiation Therapy
- 6.2.2.3. Immunotherapy
- 6.2.2.4. Hormonal Therapy
- 6.2.2.5. Other Therapeutics
- 6.2.1. Diagnosis
- 6.1. Market Analysis, Insights and Forecast - by Cancer Type
- 7. Europe Ovarian Cancer Diagnostics and Therapeutics Industry Analysis, Insights and Forecast, 2019-2031
- 7.1. Market Analysis, Insights and Forecast - by Cancer Type
- 7.1.1. Epithelial Ovarian Tumors
- 7.1.2. Ovarian Germ Cell Tumors
- 7.1.3. Other Cancer Types
- 7.2. Market Analysis, Insights and Forecast - by Modality
- 7.2.1. Diagnosis
- 7.2.1.1. Biopsy
- 7.2.1.2. Blood Tests
- 7.2.1.3. Ultrasound
- 7.2.1.4. PET
- 7.2.1.5. CT Scan
- 7.2.1.6. Other Diagnosis
- 7.2.2. Therapeutics
- 7.2.2.1. Chemotherapy
- 7.2.2.2. Radiation Therapy
- 7.2.2.3. Immunotherapy
- 7.2.2.4. Hormonal Therapy
- 7.2.2.5. Other Therapeutics
- 7.2.1. Diagnosis
- 7.1. Market Analysis, Insights and Forecast - by Cancer Type
- 8. Asia Pacific Ovarian Cancer Diagnostics and Therapeutics Industry Analysis, Insights and Forecast, 2019-2031
- 8.1. Market Analysis, Insights and Forecast - by Cancer Type
- 8.1.1. Epithelial Ovarian Tumors
- 8.1.2. Ovarian Germ Cell Tumors
- 8.1.3. Other Cancer Types
- 8.2. Market Analysis, Insights and Forecast - by Modality
- 8.2.1. Diagnosis
- 8.2.1.1. Biopsy
- 8.2.1.2. Blood Tests
- 8.2.1.3. Ultrasound
- 8.2.1.4. PET
- 8.2.1.5. CT Scan
- 8.2.1.6. Other Diagnosis
- 8.2.2. Therapeutics
- 8.2.2.1. Chemotherapy
- 8.2.2.2. Radiation Therapy
- 8.2.2.3. Immunotherapy
- 8.2.2.4. Hormonal Therapy
- 8.2.2.5. Other Therapeutics
- 8.2.1. Diagnosis
- 8.1. Market Analysis, Insights and Forecast - by Cancer Type
- 9. Middle East and Africa Ovarian Cancer Diagnostics and Therapeutics Industry Analysis, Insights and Forecast, 2019-2031
- 9.1. Market Analysis, Insights and Forecast - by Cancer Type
- 9.1.1. Epithelial Ovarian Tumors
- 9.1.2. Ovarian Germ Cell Tumors
- 9.1.3. Other Cancer Types
- 9.2. Market Analysis, Insights and Forecast - by Modality
- 9.2.1. Diagnosis
- 9.2.1.1. Biopsy
- 9.2.1.2. Blood Tests
- 9.2.1.3. Ultrasound
- 9.2.1.4. PET
- 9.2.1.5. CT Scan
- 9.2.1.6. Other Diagnosis
- 9.2.2. Therapeutics
- 9.2.2.1. Chemotherapy
- 9.2.2.2. Radiation Therapy
- 9.2.2.3. Immunotherapy
- 9.2.2.4. Hormonal Therapy
- 9.2.2.5. Other Therapeutics
- 9.2.1. Diagnosis
- 9.1. Market Analysis, Insights and Forecast - by Cancer Type
- 10. South America Ovarian Cancer Diagnostics and Therapeutics Industry Analysis, Insights and Forecast, 2019-2031
- 10.1. Market Analysis, Insights and Forecast - by Cancer Type
- 10.1.1. Epithelial Ovarian Tumors
- 10.1.2. Ovarian Germ Cell Tumors
- 10.1.3. Other Cancer Types
- 10.2. Market Analysis, Insights and Forecast - by Modality
- 10.2.1. Diagnosis
- 10.2.1.1. Biopsy
- 10.2.1.2. Blood Tests
- 10.2.1.3. Ultrasound
- 10.2.1.4. PET
- 10.2.1.5. CT Scan
- 10.2.1.6. Other Diagnosis
- 10.2.2. Therapeutics
- 10.2.2.1. Chemotherapy
- 10.2.2.2. Radiation Therapy
- 10.2.2.3. Immunotherapy
- 10.2.2.4. Hormonal Therapy
- 10.2.2.5. Other Therapeutics
- 10.2.1. Diagnosis
- 10.1. Market Analysis, Insights and Forecast - by Cancer Type
- 11. North America Ovarian Cancer Diagnostics and Therapeutics Industry Analysis, Insights and Forecast, 2019-2031
- 11.1. Market Analysis, Insights and Forecast - By Country/Sub-region
- 11.1.1 United States
- 11.1.2 Canada
- 11.1.3 Mexico
- 12. Europe Ovarian Cancer Diagnostics and Therapeutics Industry Analysis, Insights and Forecast, 2019-2031
- 12.1. Market Analysis, Insights and Forecast - By Country/Sub-region
- 12.1.1 Germany
- 12.1.2 United Kingdom
- 12.1.3 France
- 12.1.4 Italy
- 12.1.5 Spain
- 12.1.6 Rest of Europe
- 13. Asia Pacific Ovarian Cancer Diagnostics and Therapeutics Industry Analysis, Insights and Forecast, 2019-2031
- 13.1. Market Analysis, Insights and Forecast - By Country/Sub-region
- 13.1.1 China
- 13.1.2 Japan
- 13.1.3 India
- 13.1.4 Australia
- 13.1.5 South Korea
- 13.1.6 Rest of Asia Pacific
- 14. Middle East and Africa Ovarian Cancer Diagnostics and Therapeutics Industry Analysis, Insights and Forecast, 2019-2031
- 14.1. Market Analysis, Insights and Forecast - By Country/Sub-region
- 14.1.1 GCC
- 14.1.2 South Africa
- 14.1.3 Rest of Middle East and Africa
- 15. South America Ovarian Cancer Diagnostics and Therapeutics Industry Analysis, Insights and Forecast, 2019-2031
- 15.1. Market Analysis, Insights and Forecast - By Country/Sub-region
- 15.1.1 Brazil
- 15.1.2 Argentina
- 15.1.3 Rest of South America
- 16. Competitive Analysis
- 16.1. Global Market Share Analysis 2024
- 16.2. Company Profiles
- 16.2.1 Boehringer Ingelheim International GmbH
- 16.2.1.1. Overview
- 16.2.1.2. Products
- 16.2.1.3. SWOT Analysis
- 16.2.1.4. Recent Developments
- 16.2.1.5. Financials (Based on Availability)
- 16.2.2 Astrazeneca PLC
- 16.2.2.1. Overview
- 16.2.2.2. Products
- 16.2.2.3. SWOT Analysis
- 16.2.2.4. Recent Developments
- 16.2.2.5. Financials (Based on Availability)
- 16.2.3 Clovis Oncology
- 16.2.3.1. Overview
- 16.2.3.2. Products
- 16.2.3.3. SWOT Analysis
- 16.2.3.4. Recent Developments
- 16.2.3.5. Financials (Based on Availability)
- 16.2.4 Eli Lilly and Company
- 16.2.4.1. Overview
- 16.2.4.2. Products
- 16.2.4.3. SWOT Analysis
- 16.2.4.4. Recent Developments
- 16.2.4.5. Financials (Based on Availability)
- 16.2.5 Glaxosmithkline PLC
- 16.2.5.1. Overview
- 16.2.5.2. Products
- 16.2.5.3. SWOT Analysis
- 16.2.5.4. Recent Developments
- 16.2.5.5. Financials (Based on Availability)
- 16.2.6 Siemens Healthineers AG
- 16.2.6.1. Overview
- 16.2.6.2. Products
- 16.2.6.3. SWOT Analysis
- 16.2.6.4. Recent Developments
- 16.2.6.5. Financials (Based on Availability)
- 16.2.7 Johnson and Johnson (Janssen Pharmaceuticals)
- 16.2.7.1. Overview
- 16.2.7.2. Products
- 16.2.7.3. SWOT Analysis
- 16.2.7.4. Recent Developments
- 16.2.7.5. Financials (Based on Availability)
- 16.2.8 Abbvie (Allergan PLC)
- 16.2.8.1. Overview
- 16.2.8.2. Products
- 16.2.8.3. SWOT Analysis
- 16.2.8.4. Recent Developments
- 16.2.8.5. Financials (Based on Availability)
- 16.2.9 Bristol Myers Squibb Company
- 16.2.9.1. Overview
- 16.2.9.2. Products
- 16.2.9.3. SWOT Analysis
- 16.2.9.4. Recent Developments
- 16.2.9.5. Financials (Based on Availability)
- 16.2.10 F Hoffman-La Roche Ltd
- 16.2.10.1. Overview
- 16.2.10.2. Products
- 16.2.10.3. SWOT Analysis
- 16.2.10.4. Recent Developments
- 16.2.10.5. Financials (Based on Availability)
- 16.2.11 Amneal Pharmaceuticals LLC
- 16.2.11.1. Overview
- 16.2.11.2. Products
- 16.2.11.3. SWOT Analysis
- 16.2.11.4. Recent Developments
- 16.2.11.5. Financials (Based on Availability)
- 16.2.12 Pfizer Inc
- 16.2.12.1. Overview
- 16.2.12.2. Products
- 16.2.12.3. SWOT Analysis
- 16.2.12.4. Recent Developments
- 16.2.12.5. Financials (Based on Availability)
- 16.2.1 Boehringer Ingelheim International GmbH
List of Figures
- Figure 1: Global Ovarian Cancer Diagnostics and Therapeutics Industry Revenue Breakdown (Million, %) by Region 2024 & 2032
- Figure 2: Global Ovarian Cancer Diagnostics and Therapeutics Industry Volume Breakdown (K Unit, %) by Region 2024 & 2032
- Figure 3: North America Ovarian Cancer Diagnostics and Therapeutics Industry Revenue (Million), by Country 2024 & 2032
- Figure 4: North America Ovarian Cancer Diagnostics and Therapeutics Industry Volume (K Unit), by Country 2024 & 2032
- Figure 5: North America Ovarian Cancer Diagnostics and Therapeutics Industry Revenue Share (%), by Country 2024 & 2032
- Figure 6: North America Ovarian Cancer Diagnostics and Therapeutics Industry Volume Share (%), by Country 2024 & 2032
- Figure 7: Europe Ovarian Cancer Diagnostics and Therapeutics Industry Revenue (Million), by Country 2024 & 2032
- Figure 8: Europe Ovarian Cancer Diagnostics and Therapeutics Industry Volume (K Unit), by Country 2024 & 2032
- Figure 9: Europe Ovarian Cancer Diagnostics and Therapeutics Industry Revenue Share (%), by Country 2024 & 2032
- Figure 10: Europe Ovarian Cancer Diagnostics and Therapeutics Industry Volume Share (%), by Country 2024 & 2032
- Figure 11: Asia Pacific Ovarian Cancer Diagnostics and Therapeutics Industry Revenue (Million), by Country 2024 & 2032
- Figure 12: Asia Pacific Ovarian Cancer Diagnostics and Therapeutics Industry Volume (K Unit), by Country 2024 & 2032
- Figure 13: Asia Pacific Ovarian Cancer Diagnostics and Therapeutics Industry Revenue Share (%), by Country 2024 & 2032
- Figure 14: Asia Pacific Ovarian Cancer Diagnostics and Therapeutics Industry Volume Share (%), by Country 2024 & 2032
- Figure 15: Middle East and Africa Ovarian Cancer Diagnostics and Therapeutics Industry Revenue (Million), by Country 2024 & 2032
- Figure 16: Middle East and Africa Ovarian Cancer Diagnostics and Therapeutics Industry Volume (K Unit), by Country 2024 & 2032
- Figure 17: Middle East and Africa Ovarian Cancer Diagnostics and Therapeutics Industry Revenue Share (%), by Country 2024 & 2032
- Figure 18: Middle East and Africa Ovarian Cancer Diagnostics and Therapeutics Industry Volume Share (%), by Country 2024 & 2032
- Figure 19: South America Ovarian Cancer Diagnostics and Therapeutics Industry Revenue (Million), by Country 2024 & 2032
- Figure 20: South America Ovarian Cancer Diagnostics and Therapeutics Industry Volume (K Unit), by Country 2024 & 2032
- Figure 21: South America Ovarian Cancer Diagnostics and Therapeutics Industry Revenue Share (%), by Country 2024 & 2032
- Figure 22: South America Ovarian Cancer Diagnostics and Therapeutics Industry Volume Share (%), by Country 2024 & 2032
- Figure 23: North America Ovarian Cancer Diagnostics and Therapeutics Industry Revenue (Million), by Cancer Type 2024 & 2032
- Figure 24: North America Ovarian Cancer Diagnostics and Therapeutics Industry Volume (K Unit), by Cancer Type 2024 & 2032
- Figure 25: North America Ovarian Cancer Diagnostics and Therapeutics Industry Revenue Share (%), by Cancer Type 2024 & 2032
- Figure 26: North America Ovarian Cancer Diagnostics and Therapeutics Industry Volume Share (%), by Cancer Type 2024 & 2032
- Figure 27: North America Ovarian Cancer Diagnostics and Therapeutics Industry Revenue (Million), by Modality 2024 & 2032
- Figure 28: North America Ovarian Cancer Diagnostics and Therapeutics Industry Volume (K Unit), by Modality 2024 & 2032
- Figure 29: North America Ovarian Cancer Diagnostics and Therapeutics Industry Revenue Share (%), by Modality 2024 & 2032
- Figure 30: North America Ovarian Cancer Diagnostics and Therapeutics Industry Volume Share (%), by Modality 2024 & 2032
- Figure 31: North America Ovarian Cancer Diagnostics and Therapeutics Industry Revenue (Million), by Country 2024 & 2032
- Figure 32: North America Ovarian Cancer Diagnostics and Therapeutics Industry Volume (K Unit), by Country 2024 & 2032
- Figure 33: North America Ovarian Cancer Diagnostics and Therapeutics Industry Revenue Share (%), by Country 2024 & 2032
- Figure 34: North America Ovarian Cancer Diagnostics and Therapeutics Industry Volume Share (%), by Country 2024 & 2032
- Figure 35: Europe Ovarian Cancer Diagnostics and Therapeutics Industry Revenue (Million), by Cancer Type 2024 & 2032
- Figure 36: Europe Ovarian Cancer Diagnostics and Therapeutics Industry Volume (K Unit), by Cancer Type 2024 & 2032
- Figure 37: Europe Ovarian Cancer Diagnostics and Therapeutics Industry Revenue Share (%), by Cancer Type 2024 & 2032
- Figure 38: Europe Ovarian Cancer Diagnostics and Therapeutics Industry Volume Share (%), by Cancer Type 2024 & 2032
- Figure 39: Europe Ovarian Cancer Diagnostics and Therapeutics Industry Revenue (Million), by Modality 2024 & 2032
- Figure 40: Europe Ovarian Cancer Diagnostics and Therapeutics Industry Volume (K Unit), by Modality 2024 & 2032
- Figure 41: Europe Ovarian Cancer Diagnostics and Therapeutics Industry Revenue Share (%), by Modality 2024 & 2032
- Figure 42: Europe Ovarian Cancer Diagnostics and Therapeutics Industry Volume Share (%), by Modality 2024 & 2032
- Figure 43: Europe Ovarian Cancer Diagnostics and Therapeutics Industry Revenue (Million), by Country 2024 & 2032
- Figure 44: Europe Ovarian Cancer Diagnostics and Therapeutics Industry Volume (K Unit), by Country 2024 & 2032
- Figure 45: Europe Ovarian Cancer Diagnostics and Therapeutics Industry Revenue Share (%), by Country 2024 & 2032
- Figure 46: Europe Ovarian Cancer Diagnostics and Therapeutics Industry Volume Share (%), by Country 2024 & 2032
- Figure 47: Asia Pacific Ovarian Cancer Diagnostics and Therapeutics Industry Revenue (Million), by Cancer Type 2024 & 2032
- Figure 48: Asia Pacific Ovarian Cancer Diagnostics and Therapeutics Industry Volume (K Unit), by Cancer Type 2024 & 2032
- Figure 49: Asia Pacific Ovarian Cancer Diagnostics and Therapeutics Industry Revenue Share (%), by Cancer Type 2024 & 2032
- Figure 50: Asia Pacific Ovarian Cancer Diagnostics and Therapeutics Industry Volume Share (%), by Cancer Type 2024 & 2032
- Figure 51: Asia Pacific Ovarian Cancer Diagnostics and Therapeutics Industry Revenue (Million), by Modality 2024 & 2032
- Figure 52: Asia Pacific Ovarian Cancer Diagnostics and Therapeutics Industry Volume (K Unit), by Modality 2024 & 2032
- Figure 53: Asia Pacific Ovarian Cancer Diagnostics and Therapeutics Industry Revenue Share (%), by Modality 2024 & 2032
- Figure 54: Asia Pacific Ovarian Cancer Diagnostics and Therapeutics Industry Volume Share (%), by Modality 2024 & 2032
- Figure 55: Asia Pacific Ovarian Cancer Diagnostics and Therapeutics Industry Revenue (Million), by Country 2024 & 2032
- Figure 56: Asia Pacific Ovarian Cancer Diagnostics and Therapeutics Industry Volume (K Unit), by Country 2024 & 2032
- Figure 57: Asia Pacific Ovarian Cancer Diagnostics and Therapeutics Industry Revenue Share (%), by Country 2024 & 2032
- Figure 58: Asia Pacific Ovarian Cancer Diagnostics and Therapeutics Industry Volume Share (%), by Country 2024 & 2032
- Figure 59: Middle East and Africa Ovarian Cancer Diagnostics and Therapeutics Industry Revenue (Million), by Cancer Type 2024 & 2032
- Figure 60: Middle East and Africa Ovarian Cancer Diagnostics and Therapeutics Industry Volume (K Unit), by Cancer Type 2024 & 2032
- Figure 61: Middle East and Africa Ovarian Cancer Diagnostics and Therapeutics Industry Revenue Share (%), by Cancer Type 2024 & 2032
- Figure 62: Middle East and Africa Ovarian Cancer Diagnostics and Therapeutics Industry Volume Share (%), by Cancer Type 2024 & 2032
- Figure 63: Middle East and Africa Ovarian Cancer Diagnostics and Therapeutics Industry Revenue (Million), by Modality 2024 & 2032
- Figure 64: Middle East and Africa Ovarian Cancer Diagnostics and Therapeutics Industry Volume (K Unit), by Modality 2024 & 2032
- Figure 65: Middle East and Africa Ovarian Cancer Diagnostics and Therapeutics Industry Revenue Share (%), by Modality 2024 & 2032
- Figure 66: Middle East and Africa Ovarian Cancer Diagnostics and Therapeutics Industry Volume Share (%), by Modality 2024 & 2032
- Figure 67: Middle East and Africa Ovarian Cancer Diagnostics and Therapeutics Industry Revenue (Million), by Country 2024 & 2032
- Figure 68: Middle East and Africa Ovarian Cancer Diagnostics and Therapeutics Industry Volume (K Unit), by Country 2024 & 2032
- Figure 69: Middle East and Africa Ovarian Cancer Diagnostics and Therapeutics Industry Revenue Share (%), by Country 2024 & 2032
- Figure 70: Middle East and Africa Ovarian Cancer Diagnostics and Therapeutics Industry Volume Share (%), by Country 2024 & 2032
- Figure 71: South America Ovarian Cancer Diagnostics and Therapeutics Industry Revenue (Million), by Cancer Type 2024 & 2032
- Figure 72: South America Ovarian Cancer Diagnostics and Therapeutics Industry Volume (K Unit), by Cancer Type 2024 & 2032
- Figure 73: South America Ovarian Cancer Diagnostics and Therapeutics Industry Revenue Share (%), by Cancer Type 2024 & 2032
- Figure 74: South America Ovarian Cancer Diagnostics and Therapeutics Industry Volume Share (%), by Cancer Type 2024 & 2032
- Figure 75: South America Ovarian Cancer Diagnostics and Therapeutics Industry Revenue (Million), by Modality 2024 & 2032
- Figure 76: South America Ovarian Cancer Diagnostics and Therapeutics Industry Volume (K Unit), by Modality 2024 & 2032
- Figure 77: South America Ovarian Cancer Diagnostics and Therapeutics Industry Revenue Share (%), by Modality 2024 & 2032
- Figure 78: South America Ovarian Cancer Diagnostics and Therapeutics Industry Volume Share (%), by Modality 2024 & 2032
- Figure 79: South America Ovarian Cancer Diagnostics and Therapeutics Industry Revenue (Million), by Country 2024 & 2032
- Figure 80: South America Ovarian Cancer Diagnostics and Therapeutics Industry Volume (K Unit), by Country 2024 & 2032
- Figure 81: South America Ovarian Cancer Diagnostics and Therapeutics Industry Revenue Share (%), by Country 2024 & 2032
- Figure 82: South America Ovarian Cancer Diagnostics and Therapeutics Industry Volume Share (%), by Country 2024 & 2032
List of Tables
- Table 1: Global Ovarian Cancer Diagnostics and Therapeutics Industry Revenue Million Forecast, by Region 2019 & 2032
- Table 2: Global Ovarian Cancer Diagnostics and Therapeutics Industry Volume K Unit Forecast, by Region 2019 & 2032
- Table 3: Global Ovarian Cancer Diagnostics and Therapeutics Industry Revenue Million Forecast, by Cancer Type 2019 & 2032
- Table 4: Global Ovarian Cancer Diagnostics and Therapeutics Industry Volume K Unit Forecast, by Cancer Type 2019 & 2032
- Table 5: Global Ovarian Cancer Diagnostics and Therapeutics Industry Revenue Million Forecast, by Modality 2019 & 2032
- Table 6: Global Ovarian Cancer Diagnostics and Therapeutics Industry Volume K Unit Forecast, by Modality 2019 & 2032
- Table 7: Global Ovarian Cancer Diagnostics and Therapeutics Industry Revenue Million Forecast, by Region 2019 & 2032
- Table 8: Global Ovarian Cancer Diagnostics and Therapeutics Industry Volume K Unit Forecast, by Region 2019 & 2032
- Table 9: Global Ovarian Cancer Diagnostics and Therapeutics Industry Revenue Million Forecast, by Country 2019 & 2032
- Table 10: Global Ovarian Cancer Diagnostics and Therapeutics Industry Volume K Unit Forecast, by Country 2019 & 2032
- Table 11: United States Ovarian Cancer Diagnostics and Therapeutics Industry Revenue (Million) Forecast, by Application 2019 & 2032
- Table 12: United States Ovarian Cancer Diagnostics and Therapeutics Industry Volume (K Unit) Forecast, by Application 2019 & 2032
- Table 13: Canada Ovarian Cancer Diagnostics and Therapeutics Industry Revenue (Million) Forecast, by Application 2019 & 2032
- Table 14: Canada Ovarian Cancer Diagnostics and Therapeutics Industry Volume (K Unit) Forecast, by Application 2019 & 2032
- Table 15: Mexico Ovarian Cancer Diagnostics and Therapeutics Industry Revenue (Million) Forecast, by Application 2019 & 2032
- Table 16: Mexico Ovarian Cancer Diagnostics and Therapeutics Industry Volume (K Unit) Forecast, by Application 2019 & 2032
- Table 17: Global Ovarian Cancer Diagnostics and Therapeutics Industry Revenue Million Forecast, by Country 2019 & 2032
- Table 18: Global Ovarian Cancer Diagnostics and Therapeutics Industry Volume K Unit Forecast, by Country 2019 & 2032
- Table 19: Germany Ovarian Cancer Diagnostics and Therapeutics Industry Revenue (Million) Forecast, by Application 2019 & 2032
- Table 20: Germany Ovarian Cancer Diagnostics and Therapeutics Industry Volume (K Unit) Forecast, by Application 2019 & 2032
- Table 21: United Kingdom Ovarian Cancer Diagnostics and Therapeutics Industry Revenue (Million) Forecast, by Application 2019 & 2032
- Table 22: United Kingdom Ovarian Cancer Diagnostics and Therapeutics Industry Volume (K Unit) Forecast, by Application 2019 & 2032
- Table 23: France Ovarian Cancer Diagnostics and Therapeutics Industry Revenue (Million) Forecast, by Application 2019 & 2032
- Table 24: France Ovarian Cancer Diagnostics and Therapeutics Industry Volume (K Unit) Forecast, by Application 2019 & 2032
- Table 25: Italy Ovarian Cancer Diagnostics and Therapeutics Industry Revenue (Million) Forecast, by Application 2019 & 2032
- Table 26: Italy Ovarian Cancer Diagnostics and Therapeutics Industry Volume (K Unit) Forecast, by Application 2019 & 2032
- Table 27: Spain Ovarian Cancer Diagnostics and Therapeutics Industry Revenue (Million) Forecast, by Application 2019 & 2032
- Table 28: Spain Ovarian Cancer Diagnostics and Therapeutics Industry Volume (K Unit) Forecast, by Application 2019 & 2032
- Table 29: Rest of Europe Ovarian Cancer Diagnostics and Therapeutics Industry Revenue (Million) Forecast, by Application 2019 & 2032
- Table 30: Rest of Europe Ovarian Cancer Diagnostics and Therapeutics Industry Volume (K Unit) Forecast, by Application 2019 & 2032
- Table 31: Global Ovarian Cancer Diagnostics and Therapeutics Industry Revenue Million Forecast, by Country 2019 & 2032
- Table 32: Global Ovarian Cancer Diagnostics and Therapeutics Industry Volume K Unit Forecast, by Country 2019 & 2032
- Table 33: China Ovarian Cancer Diagnostics and Therapeutics Industry Revenue (Million) Forecast, by Application 2019 & 2032
- Table 34: China Ovarian Cancer Diagnostics and Therapeutics Industry Volume (K Unit) Forecast, by Application 2019 & 2032
- Table 35: Japan Ovarian Cancer Diagnostics and Therapeutics Industry Revenue (Million) Forecast, by Application 2019 & 2032
- Table 36: Japan Ovarian Cancer Diagnostics and Therapeutics Industry Volume (K Unit) Forecast, by Application 2019 & 2032
- Table 37: India Ovarian Cancer Diagnostics and Therapeutics Industry Revenue (Million) Forecast, by Application 2019 & 2032
- Table 38: India Ovarian Cancer Diagnostics and Therapeutics Industry Volume (K Unit) Forecast, by Application 2019 & 2032
- Table 39: Australia Ovarian Cancer Diagnostics and Therapeutics Industry Revenue (Million) Forecast, by Application 2019 & 2032
- Table 40: Australia Ovarian Cancer Diagnostics and Therapeutics Industry Volume (K Unit) Forecast, by Application 2019 & 2032
- Table 41: South Korea Ovarian Cancer Diagnostics and Therapeutics Industry Revenue (Million) Forecast, by Application 2019 & 2032
- Table 42: South Korea Ovarian Cancer Diagnostics and Therapeutics Industry Volume (K Unit) Forecast, by Application 2019 & 2032
- Table 43: Rest of Asia Pacific Ovarian Cancer Diagnostics and Therapeutics Industry Revenue (Million) Forecast, by Application 2019 & 2032
- Table 44: Rest of Asia Pacific Ovarian Cancer Diagnostics and Therapeutics Industry Volume (K Unit) Forecast, by Application 2019 & 2032
- Table 45: Global Ovarian Cancer Diagnostics and Therapeutics Industry Revenue Million Forecast, by Country 2019 & 2032
- Table 46: Global Ovarian Cancer Diagnostics and Therapeutics Industry Volume K Unit Forecast, by Country 2019 & 2032
- Table 47: GCC Ovarian Cancer Diagnostics and Therapeutics Industry Revenue (Million) Forecast, by Application 2019 & 2032
- Table 48: GCC Ovarian Cancer Diagnostics and Therapeutics Industry Volume (K Unit) Forecast, by Application 2019 & 2032
- Table 49: South Africa Ovarian Cancer Diagnostics and Therapeutics Industry Revenue (Million) Forecast, by Application 2019 & 2032
- Table 50: South Africa Ovarian Cancer Diagnostics and Therapeutics Industry Volume (K Unit) Forecast, by Application 2019 & 2032
- Table 51: Rest of Middle East and Africa Ovarian Cancer Diagnostics and Therapeutics Industry Revenue (Million) Forecast, by Application 2019 & 2032
- Table 52: Rest of Middle East and Africa Ovarian Cancer Diagnostics and Therapeutics Industry Volume (K Unit) Forecast, by Application 2019 & 2032
- Table 53: Global Ovarian Cancer Diagnostics and Therapeutics Industry Revenue Million Forecast, by Country 2019 & 2032
- Table 54: Global Ovarian Cancer Diagnostics and Therapeutics Industry Volume K Unit Forecast, by Country 2019 & 2032
- Table 55: Brazil Ovarian Cancer Diagnostics and Therapeutics Industry Revenue (Million) Forecast, by Application 2019 & 2032
- Table 56: Brazil Ovarian Cancer Diagnostics and Therapeutics Industry Volume (K Unit) Forecast, by Application 2019 & 2032
- Table 57: Argentina Ovarian Cancer Diagnostics and Therapeutics Industry Revenue (Million) Forecast, by Application 2019 & 2032
- Table 58: Argentina Ovarian Cancer Diagnostics and Therapeutics Industry Volume (K Unit) Forecast, by Application 2019 & 2032
- Table 59: Rest of South America Ovarian Cancer Diagnostics and Therapeutics Industry Revenue (Million) Forecast, by Application 2019 & 2032
- Table 60: Rest of South America Ovarian Cancer Diagnostics and Therapeutics Industry Volume (K Unit) Forecast, by Application 2019 & 2032
- Table 61: Global Ovarian Cancer Diagnostics and Therapeutics Industry Revenue Million Forecast, by Cancer Type 2019 & 2032
- Table 62: Global Ovarian Cancer Diagnostics and Therapeutics Industry Volume K Unit Forecast, by Cancer Type 2019 & 2032
- Table 63: Global Ovarian Cancer Diagnostics and Therapeutics Industry Revenue Million Forecast, by Modality 2019 & 2032
- Table 64: Global Ovarian Cancer Diagnostics and Therapeutics Industry Volume K Unit Forecast, by Modality 2019 & 2032
- Table 65: Global Ovarian Cancer Diagnostics and Therapeutics Industry Revenue Million Forecast, by Country 2019 & 2032
- Table 66: Global Ovarian Cancer Diagnostics and Therapeutics Industry Volume K Unit Forecast, by Country 2019 & 2032
- Table 67: United States Ovarian Cancer Diagnostics and Therapeutics Industry Revenue (Million) Forecast, by Application 2019 & 2032
- Table 68: United States Ovarian Cancer Diagnostics and Therapeutics Industry Volume (K Unit) Forecast, by Application 2019 & 2032
- Table 69: Canada Ovarian Cancer Diagnostics and Therapeutics Industry Revenue (Million) Forecast, by Application 2019 & 2032
- Table 70: Canada Ovarian Cancer Diagnostics and Therapeutics Industry Volume (K Unit) Forecast, by Application 2019 & 2032
- Table 71: Mexico Ovarian Cancer Diagnostics and Therapeutics Industry Revenue (Million) Forecast, by Application 2019 & 2032
- Table 72: Mexico Ovarian Cancer Diagnostics and Therapeutics Industry Volume (K Unit) Forecast, by Application 2019 & 2032
- Table 73: Global Ovarian Cancer Diagnostics and Therapeutics Industry Revenue Million Forecast, by Cancer Type 2019 & 2032
- Table 74: Global Ovarian Cancer Diagnostics and Therapeutics Industry Volume K Unit Forecast, by Cancer Type 2019 & 2032
- Table 75: Global Ovarian Cancer Diagnostics and Therapeutics Industry Revenue Million Forecast, by Modality 2019 & 2032
- Table 76: Global Ovarian Cancer Diagnostics and Therapeutics Industry Volume K Unit Forecast, by Modality 2019 & 2032
- Table 77: Global Ovarian Cancer Diagnostics and Therapeutics Industry Revenue Million Forecast, by Country 2019 & 2032
- Table 78: Global Ovarian Cancer Diagnostics and Therapeutics Industry Volume K Unit Forecast, by Country 2019 & 2032
- Table 79: Germany Ovarian Cancer Diagnostics and Therapeutics Industry Revenue (Million) Forecast, by Application 2019 & 2032
- Table 80: Germany Ovarian Cancer Diagnostics and Therapeutics Industry Volume (K Unit) Forecast, by Application 2019 & 2032
- Table 81: United Kingdom Ovarian Cancer Diagnostics and Therapeutics Industry Revenue (Million) Forecast, by Application 2019 & 2032
- Table 82: United Kingdom Ovarian Cancer Diagnostics and Therapeutics Industry Volume (K Unit) Forecast, by Application 2019 & 2032
- Table 83: France Ovarian Cancer Diagnostics and Therapeutics Industry Revenue (Million) Forecast, by Application 2019 & 2032
- Table 84: France Ovarian Cancer Diagnostics and Therapeutics Industry Volume (K Unit) Forecast, by Application 2019 & 2032
- Table 85: Italy Ovarian Cancer Diagnostics and Therapeutics Industry Revenue (Million) Forecast, by Application 2019 & 2032
- Table 86: Italy Ovarian Cancer Diagnostics and Therapeutics Industry Volume (K Unit) Forecast, by Application 2019 & 2032
- Table 87: Spain Ovarian Cancer Diagnostics and Therapeutics Industry Revenue (Million) Forecast, by Application 2019 & 2032
- Table 88: Spain Ovarian Cancer Diagnostics and Therapeutics Industry Volume (K Unit) Forecast, by Application 2019 & 2032
- Table 89: Rest of Europe Ovarian Cancer Diagnostics and Therapeutics Industry Revenue (Million) Forecast, by Application 2019 & 2032
- Table 90: Rest of Europe Ovarian Cancer Diagnostics and Therapeutics Industry Volume (K Unit) Forecast, by Application 2019 & 2032
- Table 91: Global Ovarian Cancer Diagnostics and Therapeutics Industry Revenue Million Forecast, by Cancer Type 2019 & 2032
- Table 92: Global Ovarian Cancer Diagnostics and Therapeutics Industry Volume K Unit Forecast, by Cancer Type 2019 & 2032
- Table 93: Global Ovarian Cancer Diagnostics and Therapeutics Industry Revenue Million Forecast, by Modality 2019 & 2032
- Table 94: Global Ovarian Cancer Diagnostics and Therapeutics Industry Volume K Unit Forecast, by Modality 2019 & 2032
- Table 95: Global Ovarian Cancer Diagnostics and Therapeutics Industry Revenue Million Forecast, by Country 2019 & 2032
- Table 96: Global Ovarian Cancer Diagnostics and Therapeutics Industry Volume K Unit Forecast, by Country 2019 & 2032
- Table 97: China Ovarian Cancer Diagnostics and Therapeutics Industry Revenue (Million) Forecast, by Application 2019 & 2032
- Table 98: China Ovarian Cancer Diagnostics and Therapeutics Industry Volume (K Unit) Forecast, by Application 2019 & 2032
- Table 99: Japan Ovarian Cancer Diagnostics and Therapeutics Industry Revenue (Million) Forecast, by Application 2019 & 2032
- Table 100: Japan Ovarian Cancer Diagnostics and Therapeutics Industry Volume (K Unit) Forecast, by Application 2019 & 2032
- Table 101: India Ovarian Cancer Diagnostics and Therapeutics Industry Revenue (Million) Forecast, by Application 2019 & 2032
- Table 102: India Ovarian Cancer Diagnostics and Therapeutics Industry Volume (K Unit) Forecast, by Application 2019 & 2032
- Table 103: Australia Ovarian Cancer Diagnostics and Therapeutics Industry Revenue (Million) Forecast, by Application 2019 & 2032
- Table 104: Australia Ovarian Cancer Diagnostics and Therapeutics Industry Volume (K Unit) Forecast, by Application 2019 & 2032
- Table 105: South Korea Ovarian Cancer Diagnostics and Therapeutics Industry Revenue (Million) Forecast, by Application 2019 & 2032
- Table 106: South Korea Ovarian Cancer Diagnostics and Therapeutics Industry Volume (K Unit) Forecast, by Application 2019 & 2032
- Table 107: Rest of Asia Pacific Ovarian Cancer Diagnostics and Therapeutics Industry Revenue (Million) Forecast, by Application 2019 & 2032
- Table 108: Rest of Asia Pacific Ovarian Cancer Diagnostics and Therapeutics Industry Volume (K Unit) Forecast, by Application 2019 & 2032
- Table 109: Global Ovarian Cancer Diagnostics and Therapeutics Industry Revenue Million Forecast, by Cancer Type 2019 & 2032
- Table 110: Global Ovarian Cancer Diagnostics and Therapeutics Industry Volume K Unit Forecast, by Cancer Type 2019 & 2032
- Table 111: Global Ovarian Cancer Diagnostics and Therapeutics Industry Revenue Million Forecast, by Modality 2019 & 2032
- Table 112: Global Ovarian Cancer Diagnostics and Therapeutics Industry Volume K Unit Forecast, by Modality 2019 & 2032
- Table 113: Global Ovarian Cancer Diagnostics and Therapeutics Industry Revenue Million Forecast, by Country 2019 & 2032
- Table 114: Global Ovarian Cancer Diagnostics and Therapeutics Industry Volume K Unit Forecast, by Country 2019 & 2032
- Table 115: GCC Ovarian Cancer Diagnostics and Therapeutics Industry Revenue (Million) Forecast, by Application 2019 & 2032
- Table 116: GCC Ovarian Cancer Diagnostics and Therapeutics Industry Volume (K Unit) Forecast, by Application 2019 & 2032
- Table 117: South Africa Ovarian Cancer Diagnostics and Therapeutics Industry Revenue (Million) Forecast, by Application 2019 & 2032
- Table 118: South Africa Ovarian Cancer Diagnostics and Therapeutics Industry Volume (K Unit) Forecast, by Application 2019 & 2032
- Table 119: Rest of Middle East and Africa Ovarian Cancer Diagnostics and Therapeutics Industry Revenue (Million) Forecast, by Application 2019 & 2032
- Table 120: Rest of Middle East and Africa Ovarian Cancer Diagnostics and Therapeutics Industry Volume (K Unit) Forecast, by Application 2019 & 2032
- Table 121: Global Ovarian Cancer Diagnostics and Therapeutics Industry Revenue Million Forecast, by Cancer Type 2019 & 2032
- Table 122: Global Ovarian Cancer Diagnostics and Therapeutics Industry Volume K Unit Forecast, by Cancer Type 2019 & 2032
- Table 123: Global Ovarian Cancer Diagnostics and Therapeutics Industry Revenue Million Forecast, by Modality 2019 & 2032
- Table 124: Global Ovarian Cancer Diagnostics and Therapeutics Industry Volume K Unit Forecast, by Modality 2019 & 2032
- Table 125: Global Ovarian Cancer Diagnostics and Therapeutics Industry Revenue Million Forecast, by Country 2019 & 2032
- Table 126: Global Ovarian Cancer Diagnostics and Therapeutics Industry Volume K Unit Forecast, by Country 2019 & 2032
- Table 127: Brazil Ovarian Cancer Diagnostics and Therapeutics Industry Revenue (Million) Forecast, by Application 2019 & 2032
- Table 128: Brazil Ovarian Cancer Diagnostics and Therapeutics Industry Volume (K Unit) Forecast, by Application 2019 & 2032
- Table 129: Argentina Ovarian Cancer Diagnostics and Therapeutics Industry Revenue (Million) Forecast, by Application 2019 & 2032
- Table 130: Argentina Ovarian Cancer Diagnostics and Therapeutics Industry Volume (K Unit) Forecast, by Application 2019 & 2032
- Table 131: Rest of South America Ovarian Cancer Diagnostics and Therapeutics Industry Revenue (Million) Forecast, by Application 2019 & 2032
- Table 132: Rest of South America Ovarian Cancer Diagnostics and Therapeutics Industry Volume (K Unit) Forecast, by Application 2019 & 2032
Frequently Asked Questions
1. What is the projected Compound Annual Growth Rate (CAGR) of the Ovarian Cancer Diagnostics and Therapeutics Industry?
The projected CAGR is approximately 9.50%.
2. Which companies are prominent players in the Ovarian Cancer Diagnostics and Therapeutics Industry?
Key companies in the market include Boehringer Ingelheim International GmbH, Astrazeneca PLC, Clovis Oncology, Eli Lilly and Company, Glaxosmithkline PLC, Siemens Healthineers AG, Johnson and Johnson (Janssen Pharmaceuticals), Abbvie (Allergan PLC), Bristol Myers Squibb Company, F Hoffman-La Roche Ltd, Amneal Pharmaceuticals LLC, Pfizer Inc.
3. What are the main segments of the Ovarian Cancer Diagnostics and Therapeutics Industry?
The market segments include Cancer Type, Modality.
4. Can you provide details about the market size?
The market size is estimated to be USD XX Million as of 2022.
5. What are some drivers contributing to market growth?
Increasing Burden of Ovarian Cancer; Use of Combination Therapies for the Treatment of Ovarian Cancer.
6. What are the notable trends driving market growth?
CT Scan Segment is Expected to Show Better Growth Over the Forecast Period.
7. Are there any restraints impacting market growth?
Lack of Accurate Diagnosis of Ovarian Cancer; Lack of Awareness in Emerging and Low Income Economies.
8. Can you provide examples of recent developments in the market?
May 2022: HLB reported that its subsidiary Elevar Therapeutics started marketing Apealea, an ovarian cancer treatment, in Germany after listing the drug on Gelbe Liste, a German drug distribution website.
9. What pricing options are available for accessing the report?
Pricing options include single-user, multi-user, and enterprise licenses priced at USD 4750, USD 5250, and USD 8750 respectively.
10. Is the market size provided in terms of value or volume?
The market size is provided in terms of value, measured in Million and volume, measured in K Unit.
11. Are there any specific market keywords associated with the report?
Yes, the market keyword associated with the report is "Ovarian Cancer Diagnostics and Therapeutics Industry," which aids in identifying and referencing the specific market segment covered.
12. How do I determine which pricing option suits my needs best?
The pricing options vary based on user requirements and access needs. Individual users may opt for single-user licenses, while businesses requiring broader access may choose multi-user or enterprise licenses for cost-effective access to the report.
13. Are there any additional resources or data provided in the Ovarian Cancer Diagnostics and Therapeutics Industry report?
While the report offers comprehensive insights, it's advisable to review the specific contents or supplementary materials provided to ascertain if additional resources or data are available.
14. How can I stay updated on further developments or reports in the Ovarian Cancer Diagnostics and Therapeutics Industry?
To stay informed about further developments, trends, and reports in the Ovarian Cancer Diagnostics and Therapeutics Industry, consider subscribing to industry newsletters, following relevant companies and organizations, or regularly checking reputable industry news sources and publications.
Methodology
Step 1 - Identification of Relevant Samples Size from Population Database


Step 2 - Approaches for Defining Global Market Size (Value, Volume* & Price*)

Note*: In applicable scenarios
Step 3 - Data Sources
Primary Research
- Web Analytics
- Survey Reports
- Research Institute
- Latest Research Reports
- Opinion Leaders
Secondary Research
- Annual Reports
- White Paper
- Latest Press Release
- Industry Association
- Paid Database
- Investor Presentations

Step 4 - Data Triangulation
Involves using different sources of information in order to increase the validity of a study
These sources are likely to be stakeholders in a program - participants, other researchers, program staff, other community members, and so on.
Then we put all data in single framework & apply various statistical tools to find out the dynamic on the market.
During the analysis stage, feedback from the stakeholder groups would be compared to determine areas of agreement as well as areas of divergence


