


Key Insights
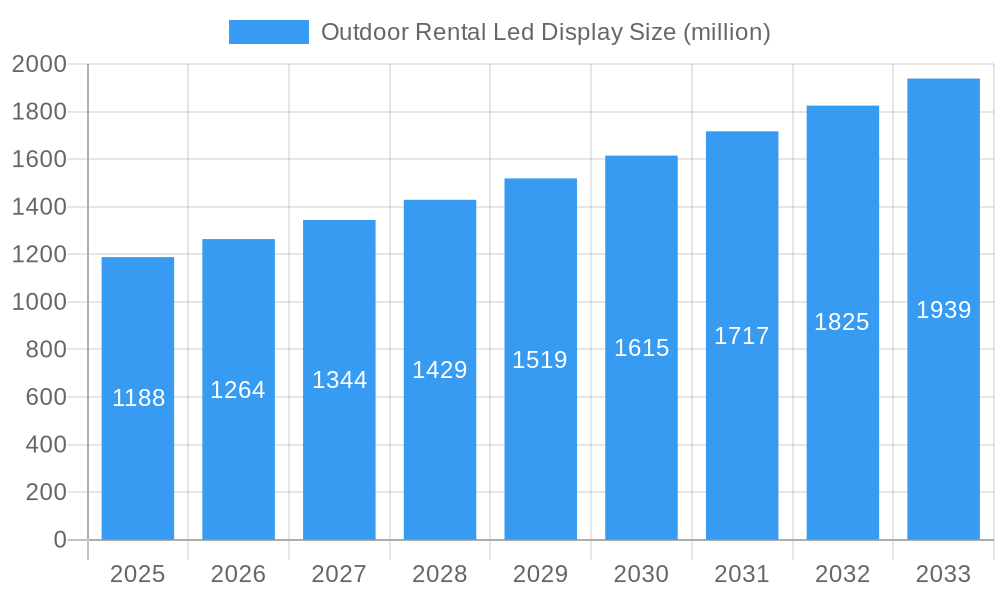
The outdoor rental LED display market, valued at $1188 million in 2025, is projected to experience robust growth, driven by the increasing popularity of concerts, music festivals, and other large-scale outdoor events. A Compound Annual Growth Rate (CAGR) of 6.2% from 2025 to 2033 indicates a significant expansion of this market. Key drivers include the rising demand for high-resolution, vibrant displays that enhance the audience experience, technological advancements leading to lighter, more energy-efficient displays, and a growing preference for immersive visual experiences in outdoor settings. The market segmentation reveals a strong preference for SMD and COB LED display types, reflecting the ongoing technological shift towards improved pixel density and brightness. Geographically, North America and Asia Pacific are expected to be dominant markets, fueled by high disposable incomes, strong entertainment industries, and significant investments in infrastructure. However, challenges such as high initial investment costs and the need for specialized technical expertise could potentially restrain market growth to some extent. Competitive pressures from numerous manufacturers, including established players like Unilumin, Absen, and Leyard, along with emerging companies, are shaping pricing strategies and driving innovation.
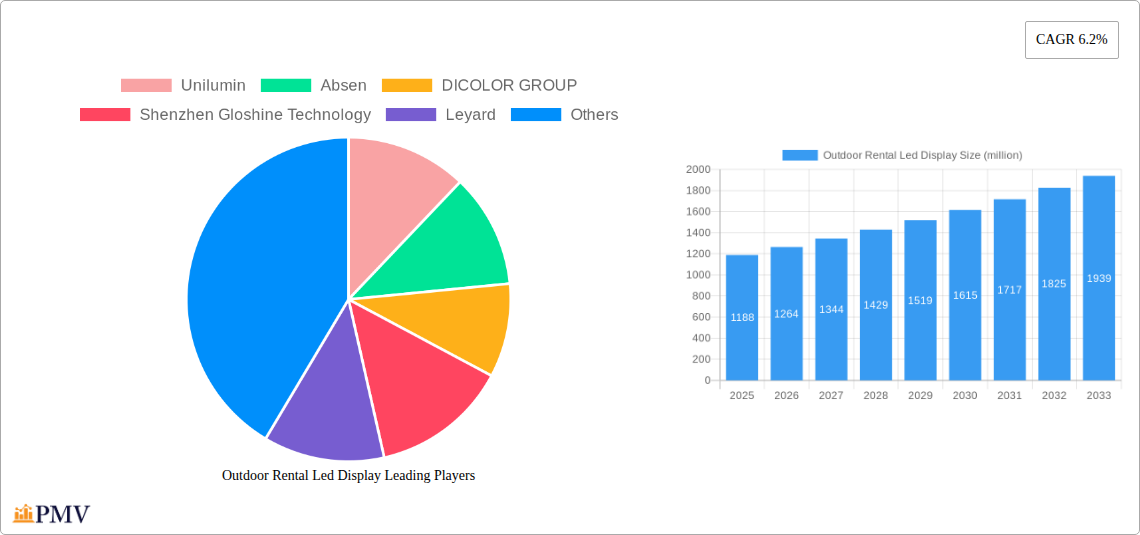
Outdoor Rental Led Display Market Size (In Billion)

The continued expansion of the live entertainment industry and the adoption of advanced LED display technologies will be crucial factors in driving future market growth. The increasing prevalence of virtual and augmented reality experiences integrated with outdoor LED displays offers exciting possibilities for market diversification. As technology continues to improve, we can expect to see the development of even more energy-efficient, high-resolution displays, offering enhanced visual clarity and captivating audience engagement. Furthermore, the growing focus on sustainable technologies and environmentally friendly solutions will increasingly influence the manufacturing and deployment of outdoor rental LED displays. The market's success will hinge on the ability of manufacturers to adapt to evolving technological advancements, cater to the specific needs of diverse event organizers, and offer competitive pricing structures.
Outdoor Rental Led Display Company Market Share
Outdoor Rental LED Display Market Report: 2019-2033
This comprehensive report provides an in-depth analysis of the global outdoor rental LED display market, offering invaluable insights for businesses and investors seeking to navigate this dynamic landscape. The report covers the period from 2019 to 2033, with a base year of 2025 and a forecast period of 2025-2033. The market is segmented by application (Concert, Music Festival, Others) and display type (SMD LED Display, COB LED Display), with a focus on key players including Unilumin, Absen, DICOLOR GROUP, and more. The global market size is projected to reach xx million by 2033, presenting significant growth opportunities. This report details market structure, competitive dynamics, industry trends, and future outlooks, providing actionable insights for strategic decision-making.
Outdoor Rental Led Display Market Structure & Competitive Dynamics
The outdoor rental LED display market exhibits a moderately concentrated structure, with a handful of major players commanding significant market share. Unilumin, Absen, and DICOLOR GROUP, among others, hold leading positions, fueled by substantial R&D investments and aggressive expansion strategies. The market is characterized by intense competition, driven by continuous innovation in display technology, evolving customer demands, and fluctuating raw material prices. The average market share of top 5 players was approximately 40% in 2024.
- Market Concentration: High, with the top five players holding approximately 40% of the market share in 2024.
- Innovation Ecosystems: Robust, with significant investments in R&D by leading companies, fostering advancements in brightness, resolution, and energy efficiency.
- Regulatory Frameworks: Vary across regions, influencing product certification, safety standards, and environmental regulations.
- Product Substitutes: Limited, with traditional display technologies offering less flexibility and higher costs for outdoor rental applications.
- End-User Trends: Growing preference for higher resolution, brighter displays with improved energy efficiency and ease of installation.
- M&A Activities: The market has witnessed several mergers and acquisitions in the past five years, with deal values ranging from xx million to xx million, reflecting the industry's consolidation trend. Consolidation is driven by the need to expand market share and gain access to new technologies and markets.
Outdoor Rental Led Display Industry Trends & Insights
The outdoor rental LED display market is experiencing robust growth, driven by several key factors. The compound annual growth rate (CAGR) is estimated to be xx% during the forecast period (2025-2033). Increased adoption of LED displays in concerts, music festivals, and other outdoor events is a primary driver. Technological advancements, such as mini-LED and micro-LED technologies, are enhancing display quality, while advancements in power management systems are improving energy efficiency. Consumer preferences are shifting towards larger, higher-resolution displays with improved brightness and color accuracy.
The market penetration of LED displays in the outdoor rental sector is steadily increasing, surpassing xx% in 2024 and projected to reach xx% by 2033. Increased demand from the entertainment industry and the rising adoption of LED displays in sporting events and public spaces are contributing factors. Competitive dynamics, characterized by innovation and price competition, are also driving market growth.
Dominant Markets & Segments in Outdoor Rental Led Display
The North American and European regions currently dominate the outdoor rental LED display market, owing to a high concentration of events and a strong entertainment industry. Within applications, concerts and music festivals represent major segments, accounting for approximately xx million in 2024. The SMD LED display type maintains a larger market share compared to COB LED displays, due to its cost-effectiveness and widespread availability.
- Key Drivers in North America & Europe:
- Strong entertainment industries and large-scale events.
- High disposable incomes and spending power.
- Developed infrastructure for transportation and logistics.
- Supportive regulatory environments and efficient supply chains.
- Dominant Segment Analysis: The concert and music festival segments are projected to experience the highest growth rates, fueled by rising event attendance and technological advancements. SMD LED displays are expected to maintain market dominance due to their cost-effectiveness, however, COB LED displays are witnessing increased adoption due to their improved brightness and durability.
Outdoor Rental Led Display Product Innovations
Recent product innovations focus on improving display brightness, resolution, and energy efficiency. Mini-LED and micro-LED technologies are gaining traction, offering superior image quality and reduced power consumption. Advances in control systems and software are enhancing display management and integration capabilities, while lightweight and modular designs improve ease of transport and installation. These innovations address the increasing demand for high-quality, energy-efficient displays that are easy to deploy for outdoor rental applications.
Report Segmentation & Scope
This report segments the outdoor rental LED display market by application (Concert, Music Festival, Others) and display type (SMD LED Display, COB LED Display). Each segment's market size, growth projections, and competitive dynamics are analyzed in detail. The "Concert" segment is projected to witness strong growth driven by increased event frequency. The "Music Festival" segment follows a similar trend, while the "Others" segment displays steady growth, attributed to various factors like corporate events and public installations. SMD LED displays currently hold a larger market share than COB LED displays but COB is expected to see growth due to the superior quality.
Key Drivers of Outdoor Rental Led Display Growth
Several factors fuel the growth of the outdoor rental LED display market. Technological advancements, such as higher resolution and brightness, enhance visual appeal and attract more customers. The rising popularity of large-scale outdoor events, concerts, and music festivals drive demand. Government initiatives promoting tourism and entertainment contribute to the market expansion. Finally, declining LED display prices increase affordability and accessibility for a wider range of customers.
Challenges in the Outdoor Rental Led Display Sector
The outdoor rental LED display market faces various challenges, including intense competition, price fluctuations of raw materials, and potential supply chain disruptions. Stringent environmental regulations, particularly on energy consumption, may pose additional obstacles. Moreover, technological obsolescence and the need for continuous innovation add to the complexity of the business environment. These challenges can significantly impact profitability and market growth.
Leading Players in the Outdoor Rental Led Display Market
- Unilumin
- Absen
- DICOLOR GROUP
- Shenzhen Gloshine Technology
- Leyard
- INFiLED
- YES TECH
- Daktronics
- LCF-LED
- Liantronics
- Shenzhen Mightary LED
- Sansitech
- Showtechled
- Ledman
- AOTO
- LightKing
- Shenzhen Eager
- FABULUX LED
Key Developments in Outdoor Rental Led Display Sector
- 2022 Q4: Unilumin launched a new series of high-brightness LED displays.
- 2023 Q1: Absen announced a strategic partnership with a major rental company.
- 2023 Q2: DICOLOR GROUP acquired a smaller competitor, expanding its market share.
- 2024 Q1: Significant advancements in Mini-LED technology were unveiled at industry trade shows.
Strategic Outdoor Rental Led Display Market Outlook
The outdoor rental LED display market is poised for significant growth, fueled by technological advancements, increasing event frequency, and evolving consumer preferences. Strategic opportunities lie in developing innovative products, expanding into new markets, and leveraging strategic partnerships to enhance market penetration. Focusing on energy efficiency and sustainability will become crucial for long-term success. Companies should also invest in R&D to maintain a competitive edge in this rapidly evolving landscape.
Outdoor Rental Led Display Segmentation
-
1. Application
- 1.1. Concert
- 1.2. Music Festival
- 1.3. Others
-
2. Type
- 2.1. SMD LED Display
- 2.2. COB LED Display
Outdoor Rental Led Display Segmentation By Geography
-
1. North America
- 1.1. United States
- 1.2. Canada
- 1.3. Mexico
-
2. South America
- 2.1. Brazil
- 2.2. Argentina
- 2.3. Rest of South America
-
3. Europe
- 3.1. United Kingdom
- 3.2. Germany
- 3.3. France
- 3.4. Italy
- 3.5. Spain
- 3.6. Russia
- 3.7. Benelux
- 3.8. Nordics
- 3.9. Rest of Europe
-
4. Middle East & Africa
- 4.1. Turkey
- 4.2. Israel
- 4.3. GCC
- 4.4. North Africa
- 4.5. South Africa
- 4.6. Rest of Middle East & Africa
-
5. Asia Pacific
- 5.1. China
- 5.2. India
- 5.3. Japan
- 5.4. South Korea
- 5.5. ASEAN
- 5.6. Oceania
- 5.7. Rest of Asia Pacific
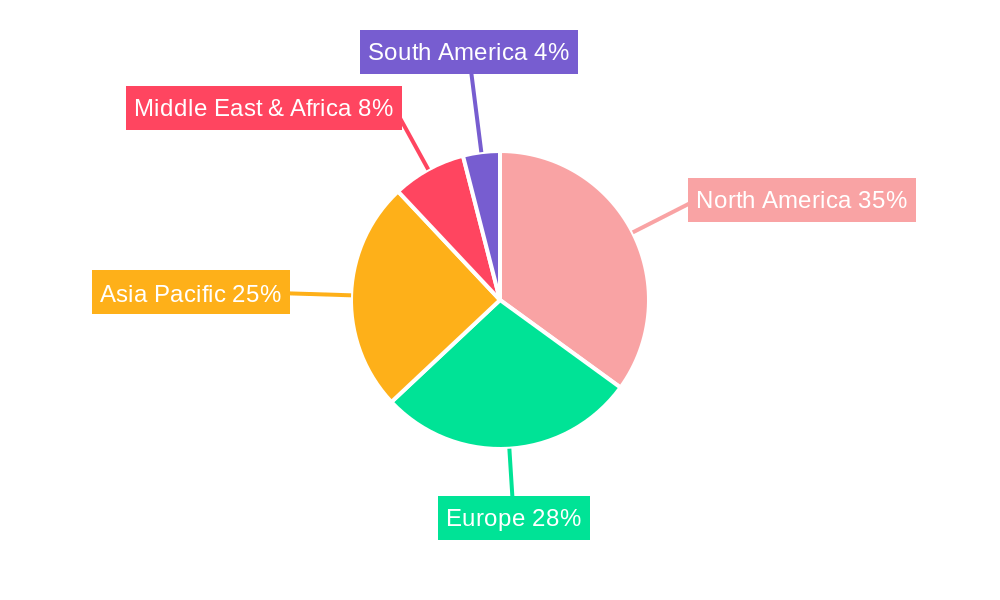
Outdoor Rental Led Display Regional Market Share
Geographic Coverage of Outdoor Rental Led Display
Outdoor Rental Led Display REPORT HIGHLIGHTS
| Aspects | Details |
|---|---|
| Study Period | 2020-2034 |
| Base Year | 2025 |
| Estimated Year | 2026 |
| Forecast Period | 2026-2034 |
| Historical Period | 2020-2025 |
| Growth Rate | CAGR of 6.2% from 2020-2034 |
| Segmentation |
|
Table of Contents
- 1. Introduction
- 1.1. Research Scope
- 1.2. Market Segmentation
- 1.3. Research Methodology
- 1.4. Definitions and Assumptions
- 2. Executive Summary
- 2.1. Introduction
- 3. Market Dynamics
- 3.1. Introduction
- 3.2. Market Drivers
- 3.3. Market Restrains
- 3.4. Market Trends
- 4. Market Factor Analysis
- 4.1. Porters Five Forces
- 4.2. Supply/Value Chain
- 4.3. PESTEL analysis
- 4.4. Market Entropy
- 4.5. Patent/Trademark Analysis
- 5. Global Outdoor Rental Led Display Analysis, Insights and Forecast, 2020-2032
- 5.1. Market Analysis, Insights and Forecast - by Application
- 5.1.1. Concert
- 5.1.2. Music Festival
- 5.1.3. Others
- 5.2. Market Analysis, Insights and Forecast - by Type
- 5.2.1. SMD LED Display
- 5.2.2. COB LED Display
- 5.3. Market Analysis, Insights and Forecast - by Region
- 5.3.1. North America
- 5.3.2. South America
- 5.3.3. Europe
- 5.3.4. Middle East & Africa
- 5.3.5. Asia Pacific
- 5.1. Market Analysis, Insights and Forecast - by Application
- 6. North America Outdoor Rental Led Display Analysis, Insights and Forecast, 2020-2032
- 6.1. Market Analysis, Insights and Forecast - by Application
- 6.1.1. Concert
- 6.1.2. Music Festival
- 6.1.3. Others
- 6.2. Market Analysis, Insights and Forecast - by Type
- 6.2.1. SMD LED Display
- 6.2.2. COB LED Display
- 6.1. Market Analysis, Insights and Forecast - by Application
- 7. South America Outdoor Rental Led Display Analysis, Insights and Forecast, 2020-2032
- 7.1. Market Analysis, Insights and Forecast - by Application
- 7.1.1. Concert
- 7.1.2. Music Festival
- 7.1.3. Others
- 7.2. Market Analysis, Insights and Forecast - by Type
- 7.2.1. SMD LED Display
- 7.2.2. COB LED Display
- 7.1. Market Analysis, Insights and Forecast - by Application
- 8. Europe Outdoor Rental Led Display Analysis, Insights and Forecast, 2020-2032
- 8.1. Market Analysis, Insights and Forecast - by Application
- 8.1.1. Concert
- 8.1.2. Music Festival
- 8.1.3. Others
- 8.2. Market Analysis, Insights and Forecast - by Type
- 8.2.1. SMD LED Display
- 8.2.2. COB LED Display
- 8.1. Market Analysis, Insights and Forecast - by Application
- 9. Middle East & Africa Outdoor Rental Led Display Analysis, Insights and Forecast, 2020-2032
- 9.1. Market Analysis, Insights and Forecast - by Application
- 9.1.1. Concert
- 9.1.2. Music Festival
- 9.1.3. Others
- 9.2. Market Analysis, Insights and Forecast - by Type
- 9.2.1. SMD LED Display
- 9.2.2. COB LED Display
- 9.1. Market Analysis, Insights and Forecast - by Application
- 10. Asia Pacific Outdoor Rental Led Display Analysis, Insights and Forecast, 2020-2032
- 10.1. Market Analysis, Insights and Forecast - by Application
- 10.1.1. Concert
- 10.1.2. Music Festival
- 10.1.3. Others
- 10.2. Market Analysis, Insights and Forecast - by Type
- 10.2.1. SMD LED Display
- 10.2.2. COB LED Display
- 10.1. Market Analysis, Insights and Forecast - by Application
- 11. Competitive Analysis
- 11.1. Global Market Share Analysis 2025
- 11.2. Company Profiles
- 11.2.1 Unilumin
- 11.2.1.1. Overview
- 11.2.1.2. Products
- 11.2.1.3. SWOT Analysis
- 11.2.1.4. Recent Developments
- 11.2.1.5. Financials (Based on Availability)
- 11.2.2 Absen
- 11.2.2.1. Overview
- 11.2.2.2. Products
- 11.2.2.3. SWOT Analysis
- 11.2.2.4. Recent Developments
- 11.2.2.5. Financials (Based on Availability)
- 11.2.3 DICOLOR GROUP
- 11.2.3.1. Overview
- 11.2.3.2. Products
- 11.2.3.3. SWOT Analysis
- 11.2.3.4. Recent Developments
- 11.2.3.5. Financials (Based on Availability)
- 11.2.4 Shenzhen Gloshine Technology
- 11.2.4.1. Overview
- 11.2.4.2. Products
- 11.2.4.3. SWOT Analysis
- 11.2.4.4. Recent Developments
- 11.2.4.5. Financials (Based on Availability)
- 11.2.5 Leyard
- 11.2.5.1. Overview
- 11.2.5.2. Products
- 11.2.5.3. SWOT Analysis
- 11.2.5.4. Recent Developments
- 11.2.5.5. Financials (Based on Availability)
- 11.2.6 INFiLED
- 11.2.6.1. Overview
- 11.2.6.2. Products
- 11.2.6.3. SWOT Analysis
- 11.2.6.4. Recent Developments
- 11.2.6.5. Financials (Based on Availability)
- 11.2.7 YES TECH
- 11.2.7.1. Overview
- 11.2.7.2. Products
- 11.2.7.3. SWOT Analysis
- 11.2.7.4. Recent Developments
- 11.2.7.5. Financials (Based on Availability)
- 11.2.8 Daktronics
- 11.2.8.1. Overview
- 11.2.8.2. Products
- 11.2.8.3. SWOT Analysis
- 11.2.8.4. Recent Developments
- 11.2.8.5. Financials (Based on Availability)
- 11.2.9 LCF-LED
- 11.2.9.1. Overview
- 11.2.9.2. Products
- 11.2.9.3. SWOT Analysis
- 11.2.9.4. Recent Developments
- 11.2.9.5. Financials (Based on Availability)
- 11.2.10 Liantronics
- 11.2.10.1. Overview
- 11.2.10.2. Products
- 11.2.10.3. SWOT Analysis
- 11.2.10.4. Recent Developments
- 11.2.10.5. Financials (Based on Availability)
- 11.2.11 Shenzhen Mightary LED
- 11.2.11.1. Overview
- 11.2.11.2. Products
- 11.2.11.3. SWOT Analysis
- 11.2.11.4. Recent Developments
- 11.2.11.5. Financials (Based on Availability)
- 11.2.12 Sansitech
- 11.2.12.1. Overview
- 11.2.12.2. Products
- 11.2.12.3. SWOT Analysis
- 11.2.12.4. Recent Developments
- 11.2.12.5. Financials (Based on Availability)
- 11.2.13 Showtechled
- 11.2.13.1. Overview
- 11.2.13.2. Products
- 11.2.13.3. SWOT Analysis
- 11.2.13.4. Recent Developments
- 11.2.13.5. Financials (Based on Availability)
- 11.2.14 Ledman
- 11.2.14.1. Overview
- 11.2.14.2. Products
- 11.2.14.3. SWOT Analysis
- 11.2.14.4. Recent Developments
- 11.2.14.5. Financials (Based on Availability)
- 11.2.15 AOTO
- 11.2.15.1. Overview
- 11.2.15.2. Products
- 11.2.15.3. SWOT Analysis
- 11.2.15.4. Recent Developments
- 11.2.15.5. Financials (Based on Availability)
- 11.2.16 LightKing
- 11.2.16.1. Overview
- 11.2.16.2. Products
- 11.2.16.3. SWOT Analysis
- 11.2.16.4. Recent Developments
- 11.2.16.5. Financials (Based on Availability)
- 11.2.17 Shenzhen Eager
- 11.2.17.1. Overview
- 11.2.17.2. Products
- 11.2.17.3. SWOT Analysis
- 11.2.17.4. Recent Developments
- 11.2.17.5. Financials (Based on Availability)
- 11.2.18 FABULUX LED
- 11.2.18.1. Overview
- 11.2.18.2. Products
- 11.2.18.3. SWOT Analysis
- 11.2.18.4. Recent Developments
- 11.2.18.5. Financials (Based on Availability)
- 11.2.1 Unilumin
List of Figures
- Figure 1: Global Outdoor Rental Led Display Revenue Breakdown (million, %) by Region 2025 & 2033
- Figure 2: North America Outdoor Rental Led Display Revenue (million), by Application 2025 & 2033
- Figure 3: North America Outdoor Rental Led Display Revenue Share (%), by Application 2025 & 2033
- Figure 4: North America Outdoor Rental Led Display Revenue (million), by Type 2025 & 2033
- Figure 5: North America Outdoor Rental Led Display Revenue Share (%), by Type 2025 & 2033
- Figure 6: North America Outdoor Rental Led Display Revenue (million), by Country 2025 & 2033
- Figure 7: North America Outdoor Rental Led Display Revenue Share (%), by Country 2025 & 2033
- Figure 8: South America Outdoor Rental Led Display Revenue (million), by Application 2025 & 2033
- Figure 9: South America Outdoor Rental Led Display Revenue Share (%), by Application 2025 & 2033
- Figure 10: South America Outdoor Rental Led Display Revenue (million), by Type 2025 & 2033
- Figure 11: South America Outdoor Rental Led Display Revenue Share (%), by Type 2025 & 2033
- Figure 12: South America Outdoor Rental Led Display Revenue (million), by Country 2025 & 2033
- Figure 13: South America Outdoor Rental Led Display Revenue Share (%), by Country 2025 & 2033
- Figure 14: Europe Outdoor Rental Led Display Revenue (million), by Application 2025 & 2033
- Figure 15: Europe Outdoor Rental Led Display Revenue Share (%), by Application 2025 & 2033
- Figure 16: Europe Outdoor Rental Led Display Revenue (million), by Type 2025 & 2033
- Figure 17: Europe Outdoor Rental Led Display Revenue Share (%), by Type 2025 & 2033
- Figure 18: Europe Outdoor Rental Led Display Revenue (million), by Country 2025 & 2033
- Figure 19: Europe Outdoor Rental Led Display Revenue Share (%), by Country 2025 & 2033
- Figure 20: Middle East & Africa Outdoor Rental Led Display Revenue (million), by Application 2025 & 2033
- Figure 21: Middle East & Africa Outdoor Rental Led Display Revenue Share (%), by Application 2025 & 2033
- Figure 22: Middle East & Africa Outdoor Rental Led Display Revenue (million), by Type 2025 & 2033
- Figure 23: Middle East & Africa Outdoor Rental Led Display Revenue Share (%), by Type 2025 & 2033
- Figure 24: Middle East & Africa Outdoor Rental Led Display Revenue (million), by Country 2025 & 2033
- Figure 25: Middle East & Africa Outdoor Rental Led Display Revenue Share (%), by Country 2025 & 2033
- Figure 26: Asia Pacific Outdoor Rental Led Display Revenue (million), by Application 2025 & 2033
- Figure 27: Asia Pacific Outdoor Rental Led Display Revenue Share (%), by Application 2025 & 2033
- Figure 28: Asia Pacific Outdoor Rental Led Display Revenue (million), by Type 2025 & 2033
- Figure 29: Asia Pacific Outdoor Rental Led Display Revenue Share (%), by Type 2025 & 2033
- Figure 30: Asia Pacific Outdoor Rental Led Display Revenue (million), by Country 2025 & 2033
- Figure 31: Asia Pacific Outdoor Rental Led Display Revenue Share (%), by Country 2025 & 2033
List of Tables
- Table 1: Global Outdoor Rental Led Display Revenue million Forecast, by Application 2020 & 2033
- Table 2: Global Outdoor Rental Led Display Revenue million Forecast, by Type 2020 & 2033
- Table 3: Global Outdoor Rental Led Display Revenue million Forecast, by Region 2020 & 2033
- Table 4: Global Outdoor Rental Led Display Revenue million Forecast, by Application 2020 & 2033
- Table 5: Global Outdoor Rental Led Display Revenue million Forecast, by Type 2020 & 2033
- Table 6: Global Outdoor Rental Led Display Revenue million Forecast, by Country 2020 & 2033
- Table 7: United States Outdoor Rental Led Display Revenue (million) Forecast, by Application 2020 & 2033
- Table 8: Canada Outdoor Rental Led Display Revenue (million) Forecast, by Application 2020 & 2033
- Table 9: Mexico Outdoor Rental Led Display Revenue (million) Forecast, by Application 2020 & 2033
- Table 10: Global Outdoor Rental Led Display Revenue million Forecast, by Application 2020 & 2033
- Table 11: Global Outdoor Rental Led Display Revenue million Forecast, by Type 2020 & 2033
- Table 12: Global Outdoor Rental Led Display Revenue million Forecast, by Country 2020 & 2033
- Table 13: Brazil Outdoor Rental Led Display Revenue (million) Forecast, by Application 2020 & 2033
- Table 14: Argentina Outdoor Rental Led Display Revenue (million) Forecast, by Application 2020 & 2033
- Table 15: Rest of South America Outdoor Rental Led Display Revenue (million) Forecast, by Application 2020 & 2033
- Table 16: Global Outdoor Rental Led Display Revenue million Forecast, by Application 2020 & 2033
- Table 17: Global Outdoor Rental Led Display Revenue million Forecast, by Type 2020 & 2033
- Table 18: Global Outdoor Rental Led Display Revenue million Forecast, by Country 2020 & 2033
- Table 19: United Kingdom Outdoor Rental Led Display Revenue (million) Forecast, by Application 2020 & 2033
- Table 20: Germany Outdoor Rental Led Display Revenue (million) Forecast, by Application 2020 & 2033
- Table 21: France Outdoor Rental Led Display Revenue (million) Forecast, by Application 2020 & 2033
- Table 22: Italy Outdoor Rental Led Display Revenue (million) Forecast, by Application 2020 & 2033
- Table 23: Spain Outdoor Rental Led Display Revenue (million) Forecast, by Application 2020 & 2033
- Table 24: Russia Outdoor Rental Led Display Revenue (million) Forecast, by Application 2020 & 2033
- Table 25: Benelux Outdoor Rental Led Display Revenue (million) Forecast, by Application 2020 & 2033
- Table 26: Nordics Outdoor Rental Led Display Revenue (million) Forecast, by Application 2020 & 2033
- Table 27: Rest of Europe Outdoor Rental Led Display Revenue (million) Forecast, by Application 2020 & 2033
- Table 28: Global Outdoor Rental Led Display Revenue million Forecast, by Application 2020 & 2033
- Table 29: Global Outdoor Rental Led Display Revenue million Forecast, by Type 2020 & 2033
- Table 30: Global Outdoor Rental Led Display Revenue million Forecast, by Country 2020 & 2033
- Table 31: Turkey Outdoor Rental Led Display Revenue (million) Forecast, by Application 2020 & 2033
- Table 32: Israel Outdoor Rental Led Display Revenue (million) Forecast, by Application 2020 & 2033
- Table 33: GCC Outdoor Rental Led Display Revenue (million) Forecast, by Application 2020 & 2033
- Table 34: North Africa Outdoor Rental Led Display Revenue (million) Forecast, by Application 2020 & 2033
- Table 35: South Africa Outdoor Rental Led Display Revenue (million) Forecast, by Application 2020 & 2033
- Table 36: Rest of Middle East & Africa Outdoor Rental Led Display Revenue (million) Forecast, by Application 2020 & 2033
- Table 37: Global Outdoor Rental Led Display Revenue million Forecast, by Application 2020 & 2033
- Table 38: Global Outdoor Rental Led Display Revenue million Forecast, by Type 2020 & 2033
- Table 39: Global Outdoor Rental Led Display Revenue million Forecast, by Country 2020 & 2033
- Table 40: China Outdoor Rental Led Display Revenue (million) Forecast, by Application 2020 & 2033
- Table 41: India Outdoor Rental Led Display Revenue (million) Forecast, by Application 2020 & 2033
- Table 42: Japan Outdoor Rental Led Display Revenue (million) Forecast, by Application 2020 & 2033
- Table 43: South Korea Outdoor Rental Led Display Revenue (million) Forecast, by Application 2020 & 2033
- Table 44: ASEAN Outdoor Rental Led Display Revenue (million) Forecast, by Application 2020 & 2033
- Table 45: Oceania Outdoor Rental Led Display Revenue (million) Forecast, by Application 2020 & 2033
- Table 46: Rest of Asia Pacific Outdoor Rental Led Display Revenue (million) Forecast, by Application 2020 & 2033
Frequently Asked Questions
1. What is the projected Compound Annual Growth Rate (CAGR) of the Outdoor Rental Led Display?
The projected CAGR is approximately 6.2%.
2. Which companies are prominent players in the Outdoor Rental Led Display?
Key companies in the market include Unilumin, Absen, DICOLOR GROUP, Shenzhen Gloshine Technology, Leyard, INFiLED, YES TECH, Daktronics, LCF-LED, Liantronics, Shenzhen Mightary LED, Sansitech, Showtechled, Ledman, AOTO, LightKing, Shenzhen Eager, FABULUX LED.
3. What are the main segments of the Outdoor Rental Led Display?
The market segments include Application, Type.
4. Can you provide details about the market size?
The market size is estimated to be USD 1188 million as of 2022.
5. What are some drivers contributing to market growth?
N/A
6. What are the notable trends driving market growth?
N/A
7. Are there any restraints impacting market growth?
N/A
8. Can you provide examples of recent developments in the market?
N/A
9. What pricing options are available for accessing the report?
Pricing options include single-user, multi-user, and enterprise licenses priced at USD 4250.00, USD 6375.00, and USD 8500.00 respectively.
10. Is the market size provided in terms of value or volume?
The market size is provided in terms of value, measured in million.
11. Are there any specific market keywords associated with the report?
Yes, the market keyword associated with the report is "Outdoor Rental Led Display," which aids in identifying and referencing the specific market segment covered.
12. How do I determine which pricing option suits my needs best?
The pricing options vary based on user requirements and access needs. Individual users may opt for single-user licenses, while businesses requiring broader access may choose multi-user or enterprise licenses for cost-effective access to the report.
13. Are there any additional resources or data provided in the Outdoor Rental Led Display report?
While the report offers comprehensive insights, it's advisable to review the specific contents or supplementary materials provided to ascertain if additional resources or data are available.
14. How can I stay updated on further developments or reports in the Outdoor Rental Led Display?
To stay informed about further developments, trends, and reports in the Outdoor Rental Led Display, consider subscribing to industry newsletters, following relevant companies and organizations, or regularly checking reputable industry news sources and publications.
Methodology
Step 1 - Identification of Relevant Samples Size from Population Database


Step 2 - Approaches for Defining Global Market Size (Value, Volume* & Price*)

Note*: In applicable scenarios
Step 3 - Data Sources
Primary Research
- Web Analytics
- Survey Reports
- Research Institute
- Latest Research Reports
- Opinion Leaders
Secondary Research
- Annual Reports
- White Paper
- Latest Press Release
- Industry Association
- Paid Database
- Investor Presentations

Step 4 - Data Triangulation
Involves using different sources of information in order to increase the validity of a study
These sources are likely to be stakeholders in a program - participants, other researchers, program staff, other community members, and so on.
Then we put all data in single framework & apply various statistical tools to find out the dynamic on the market.
During the analysis stage, feedback from the stakeholder groups would be compared to determine areas of agreement as well as areas of divergence