

Key Insights
The global OTC Braces & Supports market is projected to reach $1.15 billion in 2025, exhibiting robust growth with a Compound Annual Growth Rate (CAGR) of 6.6% through 2033. This expansion is fueled by increasing consumer awareness regarding preventive healthcare and the growing prevalence of musculoskeletal conditions, sports-related injuries, and age-related ailments like arthritis. The accessibility of over-the-counter solutions, coupled with advancements in material technology leading to more comfortable and effective brace designs, significantly contributes to market traction. Furthermore, the rising participation in sports and fitness activities across all age groups, alongside an aging global population requiring enhanced joint support, are key drivers propelling market demand. E-commerce channels are also playing a pivotal role in expanding market reach, offering consumers convenient access to a wide array of products.
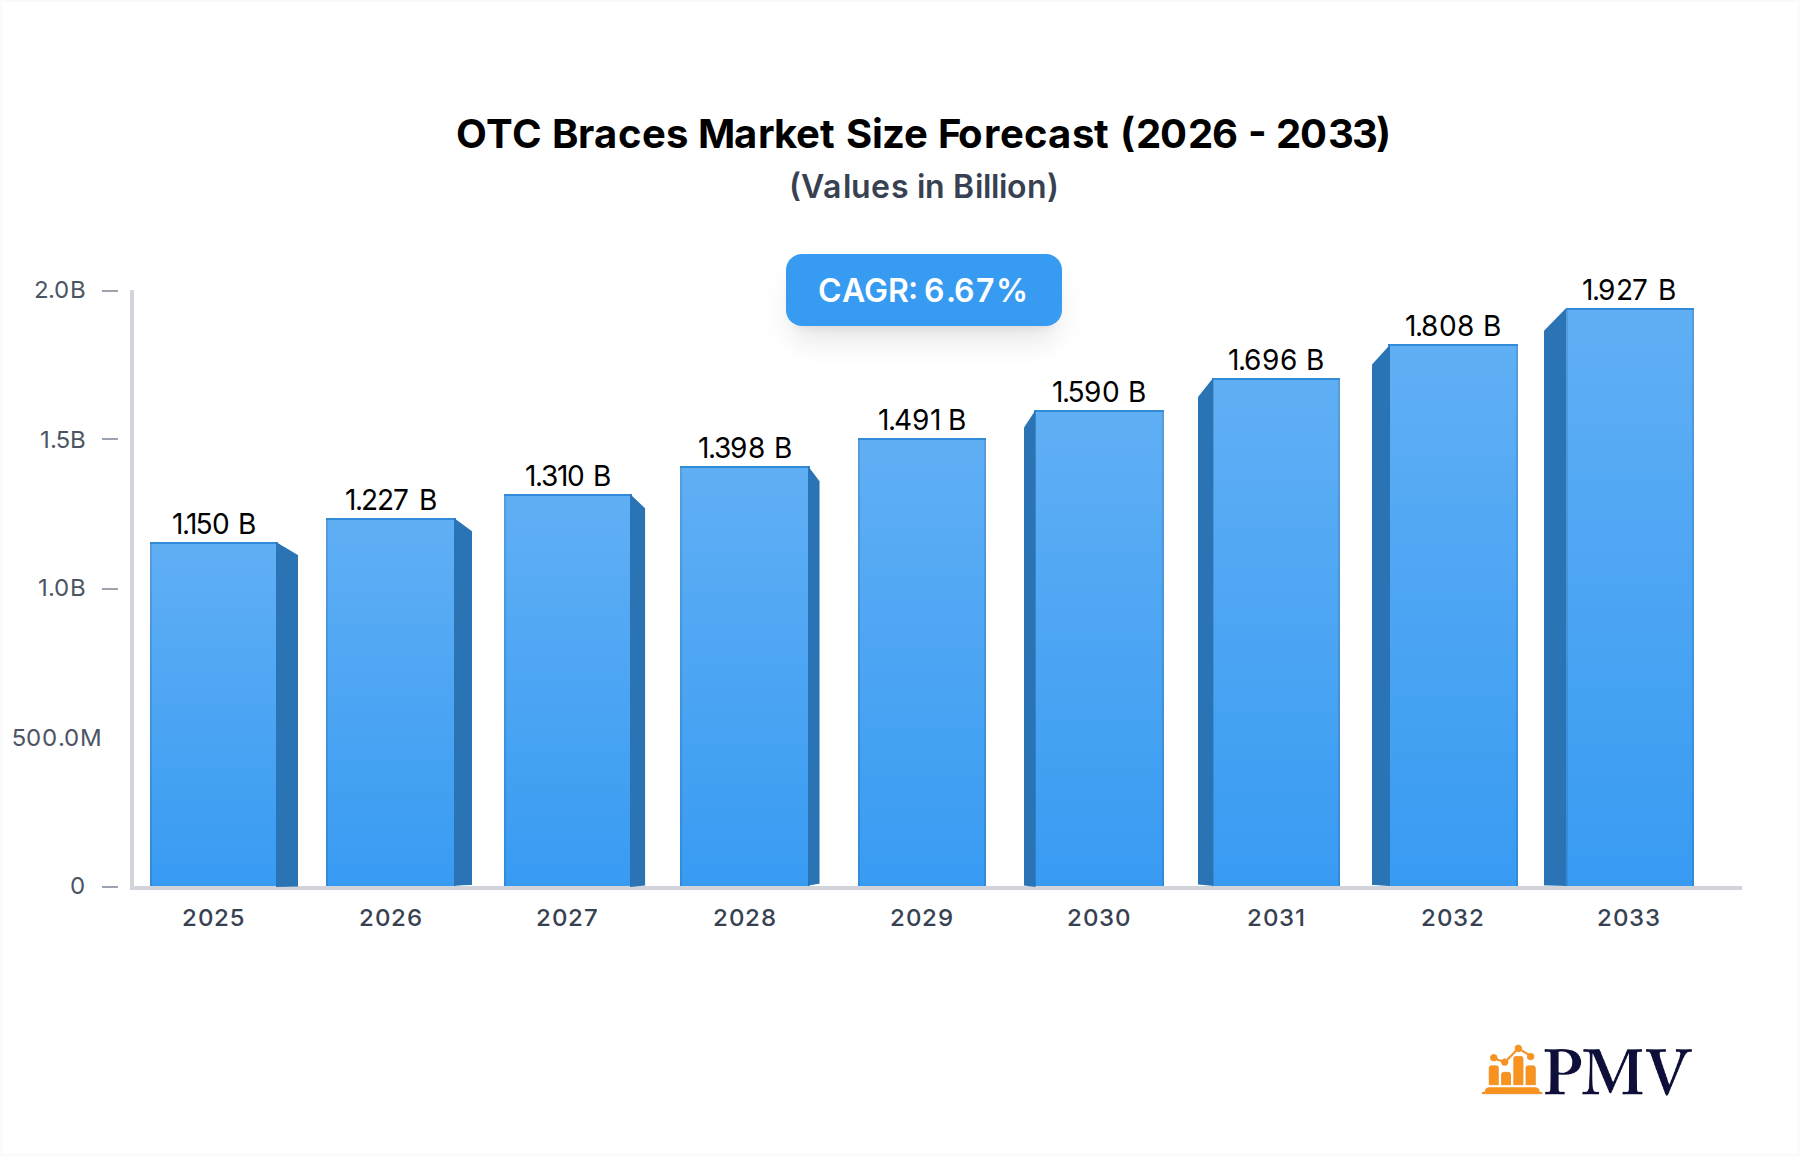
OTC Braces & Supports Market Size (In Billion)
The market is segmented across various applications, with Hospitals and Clinics forming a substantial segment due to their role in diagnosis and recommendation, while Pharmacies and E-Commerce platforms cater to direct consumer purchases. In terms of product types, Knee, Ankle, and Spine braces represent the largest segments, addressing common injury and pain areas. However, rising demand for specialized supports for Shoulder, Neck, Elbow, Wrist, and Facial applications is also notable. Key players like 3M, Bauerfeind, DJO Finance, BSN Medical, Össur Hf, and DeRoyal Industries are actively engaged in product innovation and strategic collaborations to capture a larger market share. Despite the positive outlook, factors such as limited physician recommendation for certain OTC products and the availability of alternative treatments like physiotherapy can pose some challenges, though the overall market trajectory remains strongly upward.

OTC Braces & Supports Company Market Share
This in-depth report delivers a panoramic view of the global OTC braces & supports market, meticulously analyzing its present state and projecting its trajectory through 2033. Spanning the historical period of 2019–2024, with the base year and estimated year at 2025, and a comprehensive forecast period of 2025–2033, this study is an indispensable resource for stakeholders seeking to understand market dynamics, identify growth opportunities, and strategize for success in this vital healthcare segment. The report leverages a vast dataset, with all monetary values presented in billions, providing a clear and quantifiable understanding of market scale and potential.
OTC Braces & Supports Market Structure & Competitive Dynamics
The global OTC braces & supports market exhibits a dynamic competitive landscape characterized by a blend of established industry giants and emerging innovators. Market concentration varies across different product categories and geographical regions. Key players like 3M, Bauerfeind, DJO Finance, BSN Medical, Össur Hf, and DeRoyal Industries dominate significant market shares, driven by their extensive product portfolios, robust distribution networks, and ongoing investment in research and development. Innovation ecosystems thrive, fostering the development of advanced materials, ergonomic designs, and smart brace technologies. Regulatory frameworks, while crucial for ensuring product safety and efficacy, also present compliance challenges that influence market entry and product development strategies. Product substitutes, ranging from traditional elastic bandages to more advanced therapeutic devices, present a constant competitive pressure, pushing manufacturers to differentiate through superior performance and value. End-user trends, including an aging global population, increasing prevalence of sports-related injuries, and growing awareness of preventative healthcare, are reshaping demand patterns. Mergers and acquisitions (M&A) remain a strategic tool for consolidation and market expansion, with notable deal values anticipated to exceed hundreds of billions over the forecast period, impacting market share and competitive positioning.
OTC Braces & Supports Industry Trends & Insights
The OTC braces & supports industry is poised for significant expansion, fueled by a confluence of powerful growth drivers. The escalating global prevalence of chronic musculoskeletal conditions, an aging population demanding better mobility and pain management solutions, and a surge in sports and fitness activities are primary catalysts. Technological advancements are revolutionizing product design and functionality. We anticipate a Compound Annual Growth Rate (CAGR) of approximately 6.5% for the OTC braces & supports market during the forecast period. Market penetration is projected to reach over 75% in developed economies by 2033, driven by increased accessibility and consumer education. The rise of e-commerce channels has democratized access to these essential products, allowing a broader consumer base to purchase directly, bypassing traditional retail limitations. Furthermore, the growing emphasis on preventative healthcare and rehabilitation post-injury or surgery is creating a sustained demand for effective, non-prescription support solutions. Innovations in materials science, such as the incorporation of advanced polymers and breathable fabrics, are enhancing comfort and therapeutic efficacy. Smart braces, equipped with sensors to monitor patient adherence and provide real-time feedback, are emerging as a significant disruptive trend, offering personalized care and improved treatment outcomes. The competitive landscape is characterized by strategic partnerships, product diversification, and a relentless focus on cost-effectiveness without compromising quality. Industry developments are increasingly being shaped by the integration of digital health platforms and telemedicine, facilitating remote patient monitoring and personalized treatment plans. The overall market sentiment remains highly positive, with projections indicating market values reaching several hundred billion by the end of the forecast period.
Dominant Markets & Segments in OTC Braces & Supports
The knee braces segment is projected to be the dominant force within the global OTC braces & supports market, accounting for an estimated over 30% of the total market value by 2033. This dominance is attributed to the high incidence of knee injuries in sports and athletic activities, as well as the growing prevalence of osteoarthritis in the aging population. Within the Application segmentation, E-commerce is emerging as a leading channel, expected to capture over 25% of the market share by 2033, driven by its convenience, wider product selection, and competitive pricing. Key drivers for this growth include increasing internet penetration, sophisticated online marketplaces, and direct-to-consumer (DTC) strategies employed by manufacturers. Geographically, North America is anticipated to remain a dominant region, driven by high disposable incomes, a strong awareness of sports-related injuries, and advanced healthcare infrastructure. However, the Asia-Pacific region is expected to exhibit the fastest growth, propelled by increasing healthcare expenditure, a rapidly growing middle class, and a rising participation in sports and fitness activities.
- Dominant Segment (Type): Knee Braces
- Key Drivers: High incidence of sports injuries, rising osteoarthritis prevalence, post-surgical rehabilitation needs.
- Market Size Projection: Estimated to reach over 150 billion by 2033.
- Competitive Landscape: Fierce competition with continuous innovation in materials and design.
- Dominant Segment (Application): E-Commerce
- Key Drivers: Consumer convenience, wider product accessibility, competitive pricing, direct-to-consumer models.
- Market Share Projection: Expected to capture over 25% of the market by 2033.
- Growth Trajectory: Rapid expansion due to increasing digital adoption and robust online retail infrastructure.
- Dominant Region: North America
- Key Drivers: High disposable income, strong sports culture, advanced healthcare systems, extensive marketing efforts.
- Market Penetration: High, with continuous demand for advanced support solutions.
- Fastest Growing Region: Asia-Pacific
- Key Drivers: Increasing healthcare spending, growing middle class, rising sports participation, expanding distribution networks.
- Market Potential: Significant untapped potential, with rapid market development expected.
OTC Braces & Supports Product Innovations
Product innovations in the OTC braces & supports market are primarily focused on enhancing user comfort, therapeutic efficacy, and intelligent functionality. Manufacturers are increasingly utilizing lightweight, breathable, and durable materials like advanced polymers and specialized fabrics to improve patient compliance and product longevity. Smart brace technology, integrating sensors to monitor movement, pressure, and muscle activity, is a significant trend, offering personalized rehabilitation and performance tracking. This allows for more targeted interventions and data-driven recovery processes, providing a distinct competitive advantage for companies investing in these advanced solutions.
Report Segmentation & Scope
This report segments the global OTC braces & supports market comprehensively across key categories. The Application segmentation includes Hospitals, Clinics, Pharmacies, and E-Commerce, each offering unique market dynamics and growth potentials. The Types segmentation encompasses a wide range of orthopaedic supports, including Knee, Ankle, Spine, Shoulder, Neck, Elbow, Wrist, and Facial braces. Each segment is analyzed in detail, with projected market sizes and growth rates estimated for the forecast period.
- Application Segments:
- Hospitals: Significant for post-operative and rehabilitation needs.
- Clinics: Driven by sports medicine and physiotherapy practices.
- Pharmacies: Accessible retail point for general support needs.
- E-Commerce: Rapidly growing channel offering broad accessibility and convenience.
- Type Segments:
- Knee Braces: Dominant segment due to high injury rates.
- Ankle Braces: Essential for sports and daily mobility.
- Spine Braces: Addressing chronic back pain and post-injury recovery.
- Shoulder Braces: Crucial for rotator cuff injuries and dislocations.
- Neck Braces: Used for whiplash and cervical support.
- Elbow Braces: Targeting tennis elbow and golfer's elbow.
- Wrist Braces: Essential for carpal tunnel syndrome and sprains.
- Facial Braces: Specialized for post-facial trauma recovery.
Key Drivers of OTC Braces & Supports Growth
The growth of the OTC braces & supports market is propelled by several interconnected factors. The escalating global burden of musculoskeletal disorders, including arthritis and sports-related injuries, directly fuels demand. An increasingly active and aging population seeks solutions for pain management and enhanced mobility, creating a sustained market. Technological advancements in material science and smart device integration are leading to more effective and user-friendly products. Furthermore, a growing awareness of the benefits of preventative care and early intervention for injuries contributes significantly to market expansion. Favorable reimbursement policies in certain regions and the increasing accessibility through e-commerce platforms further bolster growth.
Challenges in the OTC Braces & Supports Sector
Despite robust growth, the OTC braces & supports sector faces notable challenges. Stringent regulatory approvals for new product categories or advanced technologies can lead to prolonged market entry times and increased development costs. The competitive landscape is intense, with numerous players vying for market share, leading to price pressures and the need for continuous innovation. Supply chain disruptions, particularly those related to raw material sourcing and global logistics, can impact product availability and manufacturing efficiency, potentially costing the industry billions in lost revenue. Ensuring product quality and efficacy across a diverse range of manufacturers also presents ongoing challenges for market integrity.
Leading Players in the OTC Braces & Supports Market
- 3M
- Bauerfeind
- DJO Finance
- BSN Medical
- Össur Hf
- DeRoyal Industries
Key Developments in OTC Braces & Supports Sector
- 2023: Launch of advanced smart knee brace technology by Bauerfeind, integrating real-time motion tracking and AI-powered feedback, significantly impacting rehabilitation protocols.
- 2023: 3M acquires a leading-edge textile manufacturer specializing in advanced compression fabrics, bolstering its capacity for innovative brace material development.
- 2024: Össur Hf introduces a new line of lightweight and highly adjustable spinal orthoses, enhancing patient comfort and compliance, projected to capture significant market share.
- 2024: DJO Finance expands its e-commerce distribution network across emerging markets in Southeast Asia, anticipating a substantial increase in market penetration.
- 2024: BSN Medical partners with a prominent sports medicine research institute to accelerate the development of next-generation athletic braces, focusing on injury prevention.
Strategic OTC Braces & Supports Market Outlook
The strategic outlook for the OTC braces & supports market remains exceptionally promising, driven by persistent demand and continuous innovation. Opportunities abound for companies that can leverage technological advancements, such as smart bracing and personalized therapy solutions, to capture market leadership. Expanding into emerging economies with growing healthcare expenditure and increasing sports participation presents a significant growth accelerator. Strategic partnerships, aimed at enhancing product development, distribution, and market reach, will be crucial. The ongoing trend towards preventative healthcare and active lifestyles will continue to fuel demand, positioning the market for sustained growth and substantial returns, projected to reach hundreds of billions in value.
OTC Braces & Supports Segmentation
-
1. Application
- 1.1. Hospitals
- 1.2. Clinics
- 1.3. Pharmacies
- 1.4. E-Commerce
-
2. Types
- 2.1. Knee
- 2.2. Ankle
- 2.3. Spine
- 2.4. Shoulder
- 2.5. Neck
- 2.6. Elbow
- 2.7. Wrist
- 2.8. Facial
OTC Braces & Supports Segmentation By Geography
-
1. North America
- 1.1. United States
- 1.2. Canada
- 1.3. Mexico
-
2. South America
- 2.1. Brazil
- 2.2. Argentina
- 2.3. Rest of South America
-
3. Europe
- 3.1. United Kingdom
- 3.2. Germany
- 3.3. France
- 3.4. Italy
- 3.5. Spain
- 3.6. Russia
- 3.7. Benelux
- 3.8. Nordics
- 3.9. Rest of Europe
-
4. Middle East & Africa
- 4.1. Turkey
- 4.2. Israel
- 4.3. GCC
- 4.4. North Africa
- 4.5. South Africa
- 4.6. Rest of Middle East & Africa
-
5. Asia Pacific
- 5.1. China
- 5.2. India
- 5.3. Japan
- 5.4. South Korea
- 5.5. ASEAN
- 5.6. Oceania
- 5.7. Rest of Asia Pacific
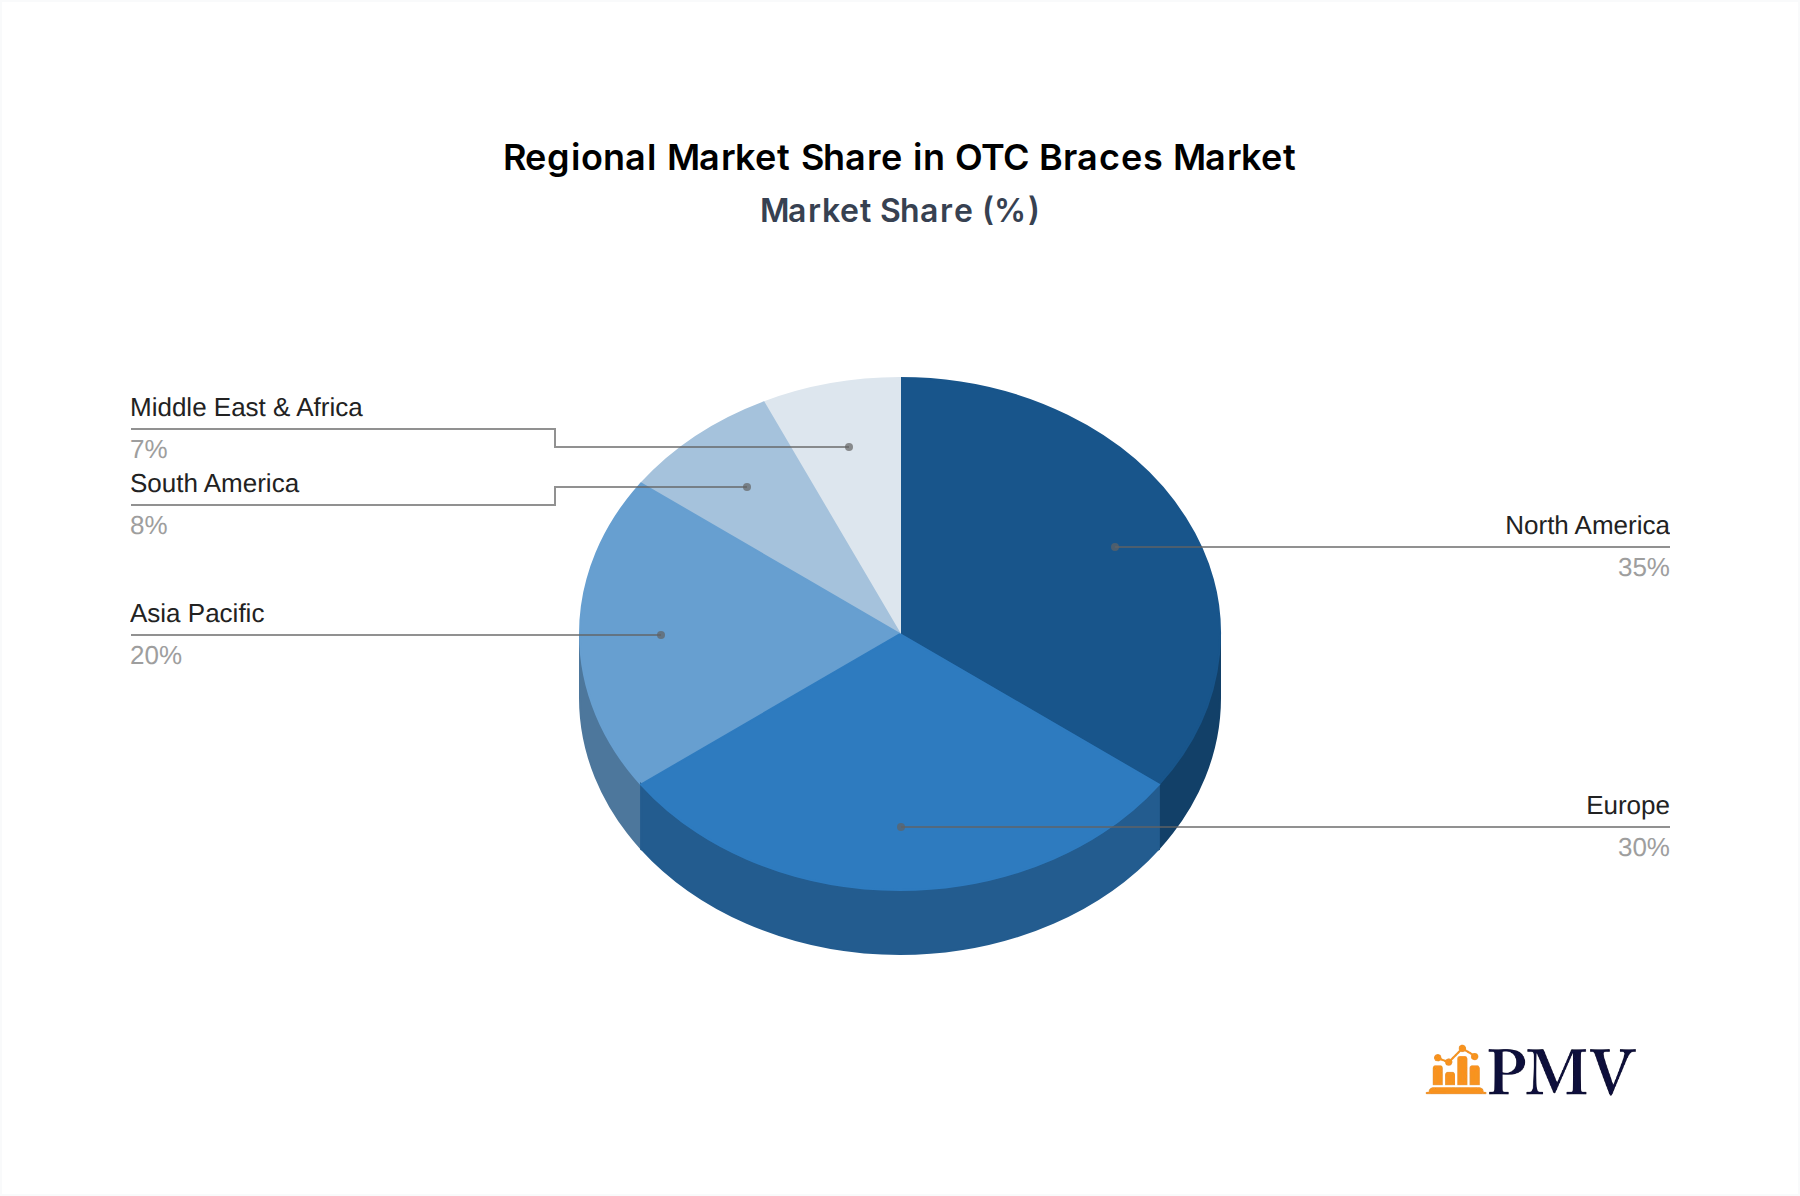
OTC Braces & Supports Regional Market Share
Geographic Coverage of OTC Braces & Supports
OTC Braces & Supports REPORT HIGHLIGHTS
| Aspects | Details |
|---|---|
| Study Period | 2020-2034 |
| Base Year | 2025 |
| Estimated Year | 2026 |
| Forecast Period | 2026-2034 |
| Historical Period | 2020-2025 |
| Growth Rate | CAGR of 6.6% from 2020-2034 |
| Segmentation |
|
Table of Contents
- 1. Introduction
- 1.1. Research Scope
- 1.2. Market Segmentation
- 1.3. Research Objective
- 1.4. Definitions and Assumptions
- 2. Executive Summary
- 2.1. Market Snapshot
- 3. Market Dynamics
- 3.1. Market Drivers
- 3.2. Market Restrains
- 3.3. Market Trends
- 3.4. Market Opportunities
- 4. Market Factor Analysis
- 4.1. Porters Five Forces
- 4.1.1. Bargaining Power of Suppliers
- 4.1.2. Bargaining Power of Buyers
- 4.1.3. Threat of New Entrants
- 4.1.4. Threat of Substitutes
- 4.1.5. Competitive Rivalry
- 4.2. PESTEL analysis
- 4.3. BCG Analysis
- 4.3.1. Stars (High Growth, High Market Share)
- 4.3.2. Cash Cows (Low Growth, High Market Share)
- 4.3.3. Question Mark (High Growth, Low Market Share)
- 4.3.4. Dogs (Low Growth, Low Market Share)
- 4.4. Ansoff Matrix Analysis
- 4.5. Supply Chain Analysis
- 4.6. Regulatory Landscape
- 4.7. Current Market Potential and Opportunity Assessment (TAM–SAM–SOM Framework)
- 4.8. PMV Analyst Note
- 4.1. Porters Five Forces
- 5. Market Analysis, Insights and Forecast 2021-2033
- 5.1. Market Analysis, Insights and Forecast - by Application
- 5.1.1. Hospitals
- 5.1.2. Clinics
- 5.1.3. Pharmacies
- 5.1.4. E-Commerce
- 5.2. Market Analysis, Insights and Forecast - by Types
- 5.2.1. Knee
- 5.2.2. Ankle
- 5.2.3. Spine
- 5.2.4. Shoulder
- 5.2.5. Neck
- 5.2.6. Elbow
- 5.2.7. Wrist
- 5.2.8. Facial
- 5.3. Market Analysis, Insights and Forecast - by Region
- 5.3.1. North America
- 5.3.2. South America
- 5.3.3. Europe
- 5.3.4. Middle East & Africa
- 5.3.5. Asia Pacific
- 5.1. Market Analysis, Insights and Forecast - by Application
- 6. Global OTC Braces & Supports Analysis, Insights and Forecast, 2021-2033
- 6.1. Market Analysis, Insights and Forecast - by Application
- 6.1.1. Hospitals
- 6.1.2. Clinics
- 6.1.3. Pharmacies
- 6.1.4. E-Commerce
- 6.2. Market Analysis, Insights and Forecast - by Types
- 6.2.1. Knee
- 6.2.2. Ankle
- 6.2.3. Spine
- 6.2.4. Shoulder
- 6.2.5. Neck
- 6.2.6. Elbow
- 6.2.7. Wrist
- 6.2.8. Facial
- 6.1. Market Analysis, Insights and Forecast - by Application
- 7. North America OTC Braces & Supports Analysis, Insights and Forecast, 2020-2032
- 7.1. Market Analysis, Insights and Forecast - by Application
- 7.1.1. Hospitals
- 7.1.2. Clinics
- 7.1.3. Pharmacies
- 7.1.4. E-Commerce
- 7.2. Market Analysis, Insights and Forecast - by Types
- 7.2.1. Knee
- 7.2.2. Ankle
- 7.2.3. Spine
- 7.2.4. Shoulder
- 7.2.5. Neck
- 7.2.6. Elbow
- 7.2.7. Wrist
- 7.2.8. Facial
- 7.1. Market Analysis, Insights and Forecast - by Application
- 8. South America OTC Braces & Supports Analysis, Insights and Forecast, 2020-2032
- 8.1. Market Analysis, Insights and Forecast - by Application
- 8.1.1. Hospitals
- 8.1.2. Clinics
- 8.1.3. Pharmacies
- 8.1.4. E-Commerce
- 8.2. Market Analysis, Insights and Forecast - by Types
- 8.2.1. Knee
- 8.2.2. Ankle
- 8.2.3. Spine
- 8.2.4. Shoulder
- 8.2.5. Neck
- 8.2.6. Elbow
- 8.2.7. Wrist
- 8.2.8. Facial
- 8.1. Market Analysis, Insights and Forecast - by Application
- 9. Europe OTC Braces & Supports Analysis, Insights and Forecast, 2020-2032
- 9.1. Market Analysis, Insights and Forecast - by Application
- 9.1.1. Hospitals
- 9.1.2. Clinics
- 9.1.3. Pharmacies
- 9.1.4. E-Commerce
- 9.2. Market Analysis, Insights and Forecast - by Types
- 9.2.1. Knee
- 9.2.2. Ankle
- 9.2.3. Spine
- 9.2.4. Shoulder
- 9.2.5. Neck
- 9.2.6. Elbow
- 9.2.7. Wrist
- 9.2.8. Facial
- 9.1. Market Analysis, Insights and Forecast - by Application
- 10. Middle East & Africa OTC Braces & Supports Analysis, Insights and Forecast, 2020-2032
- 10.1. Market Analysis, Insights and Forecast - by Application
- 10.1.1. Hospitals
- 10.1.2. Clinics
- 10.1.3. Pharmacies
- 10.1.4. E-Commerce
- 10.2. Market Analysis, Insights and Forecast - by Types
- 10.2.1. Knee
- 10.2.2. Ankle
- 10.2.3. Spine
- 10.2.4. Shoulder
- 10.2.5. Neck
- 10.2.6. Elbow
- 10.2.7. Wrist
- 10.2.8. Facial
- 10.1. Market Analysis, Insights and Forecast - by Application
- 11. Asia Pacific OTC Braces & Supports Analysis, Insights and Forecast, 2020-2032
- 11.1. Market Analysis, Insights and Forecast - by Application
- 11.1.1. Hospitals
- 11.1.2. Clinics
- 11.1.3. Pharmacies
- 11.1.4. E-Commerce
- 11.2. Market Analysis, Insights and Forecast - by Types
- 11.2.1. Knee
- 11.2.2. Ankle
- 11.2.3. Spine
- 11.2.4. Shoulder
- 11.2.5. Neck
- 11.2.6. Elbow
- 11.2.7. Wrist
- 11.2.8. Facial
- 11.1. Market Analysis, Insights and Forecast - by Application
- 12. Competitive Analysis
- 12.1. Company Profiles
- 12.1.1 3M
- 12.1.1.1. Company Overview
- 12.1.1.2. Products
- 12.1.1.3. Company Financials
- 12.1.1.4. SWOT Analysis
- 12.1.2 Bauerfeind
- 12.1.2.1. Company Overview
- 12.1.2.2. Products
- 12.1.2.3. Company Financials
- 12.1.2.4. SWOT Analysis
- 12.1.3 DJO Finance
- 12.1.3.1. Company Overview
- 12.1.3.2. Products
- 12.1.3.3. Company Financials
- 12.1.3.4. SWOT Analysis
- 12.1.4 BSN Medical
- 12.1.4.1. Company Overview
- 12.1.4.2. Products
- 12.1.4.3. Company Financials
- 12.1.4.4. SWOT Analysis
- 12.1.5 Össur Hf
- 12.1.5.1. Company Overview
- 12.1.5.2. Products
- 12.1.5.3. Company Financials
- 12.1.5.4. SWOT Analysis
- 12.1.6 DeRoyal Industries
- 12.1.6.1. Company Overview
- 12.1.6.2. Products
- 12.1.6.3. Company Financials
- 12.1.6.4. SWOT Analysis
- 12.1.1 3M
- 12.2. Market Entropy
- 12.2.1 Company's Key Areas Served
- 12.2.2 Recent Developments
- 12.3. Company Market Share Analysis 2025
- 12.3.1 Top 5 Companies Market Share Analysis
- 12.3.2 Top 3 Companies Market Share Analysis
- 12.4. List of Potential Customers
- 13. Research Methodology
List of Figures
- Figure 1: Global OTC Braces & Supports Revenue Breakdown (undefined, %) by Region 2025 & 2033
- Figure 2: Global OTC Braces & Supports Volume Breakdown (K, %) by Region 2025 & 2033
- Figure 3: North America OTC Braces & Supports Revenue (undefined), by Application 2025 & 2033
- Figure 4: North America OTC Braces & Supports Volume (K), by Application 2025 & 2033
- Figure 5: North America OTC Braces & Supports Revenue Share (%), by Application 2025 & 2033
- Figure 6: North America OTC Braces & Supports Volume Share (%), by Application 2025 & 2033
- Figure 7: North America OTC Braces & Supports Revenue (undefined), by Types 2025 & 2033
- Figure 8: North America OTC Braces & Supports Volume (K), by Types 2025 & 2033
- Figure 9: North America OTC Braces & Supports Revenue Share (%), by Types 2025 & 2033
- Figure 10: North America OTC Braces & Supports Volume Share (%), by Types 2025 & 2033
- Figure 11: North America OTC Braces & Supports Revenue (undefined), by Country 2025 & 2033
- Figure 12: North America OTC Braces & Supports Volume (K), by Country 2025 & 2033
- Figure 13: North America OTC Braces & Supports Revenue Share (%), by Country 2025 & 2033
- Figure 14: North America OTC Braces & Supports Volume Share (%), by Country 2025 & 2033
- Figure 15: South America OTC Braces & Supports Revenue (undefined), by Application 2025 & 2033
- Figure 16: South America OTC Braces & Supports Volume (K), by Application 2025 & 2033
- Figure 17: South America OTC Braces & Supports Revenue Share (%), by Application 2025 & 2033
- Figure 18: South America OTC Braces & Supports Volume Share (%), by Application 2025 & 2033
- Figure 19: South America OTC Braces & Supports Revenue (undefined), by Types 2025 & 2033
- Figure 20: South America OTC Braces & Supports Volume (K), by Types 2025 & 2033
- Figure 21: South America OTC Braces & Supports Revenue Share (%), by Types 2025 & 2033
- Figure 22: South America OTC Braces & Supports Volume Share (%), by Types 2025 & 2033
- Figure 23: South America OTC Braces & Supports Revenue (undefined), by Country 2025 & 2033
- Figure 24: South America OTC Braces & Supports Volume (K), by Country 2025 & 2033
- Figure 25: South America OTC Braces & Supports Revenue Share (%), by Country 2025 & 2033
- Figure 26: South America OTC Braces & Supports Volume Share (%), by Country 2025 & 2033
- Figure 27: Europe OTC Braces & Supports Revenue (undefined), by Application 2025 & 2033
- Figure 28: Europe OTC Braces & Supports Volume (K), by Application 2025 & 2033
- Figure 29: Europe OTC Braces & Supports Revenue Share (%), by Application 2025 & 2033
- Figure 30: Europe OTC Braces & Supports Volume Share (%), by Application 2025 & 2033
- Figure 31: Europe OTC Braces & Supports Revenue (undefined), by Types 2025 & 2033
- Figure 32: Europe OTC Braces & Supports Volume (K), by Types 2025 & 2033
- Figure 33: Europe OTC Braces & Supports Revenue Share (%), by Types 2025 & 2033
- Figure 34: Europe OTC Braces & Supports Volume Share (%), by Types 2025 & 2033
- Figure 35: Europe OTC Braces & Supports Revenue (undefined), by Country 2025 & 2033
- Figure 36: Europe OTC Braces & Supports Volume (K), by Country 2025 & 2033
- Figure 37: Europe OTC Braces & Supports Revenue Share (%), by Country 2025 & 2033
- Figure 38: Europe OTC Braces & Supports Volume Share (%), by Country 2025 & 2033
- Figure 39: Middle East & Africa OTC Braces & Supports Revenue (undefined), by Application 2025 & 2033
- Figure 40: Middle East & Africa OTC Braces & Supports Volume (K), by Application 2025 & 2033
- Figure 41: Middle East & Africa OTC Braces & Supports Revenue Share (%), by Application 2025 & 2033
- Figure 42: Middle East & Africa OTC Braces & Supports Volume Share (%), by Application 2025 & 2033
- Figure 43: Middle East & Africa OTC Braces & Supports Revenue (undefined), by Types 2025 & 2033
- Figure 44: Middle East & Africa OTC Braces & Supports Volume (K), by Types 2025 & 2033
- Figure 45: Middle East & Africa OTC Braces & Supports Revenue Share (%), by Types 2025 & 2033
- Figure 46: Middle East & Africa OTC Braces & Supports Volume Share (%), by Types 2025 & 2033
- Figure 47: Middle East & Africa OTC Braces & Supports Revenue (undefined), by Country 2025 & 2033
- Figure 48: Middle East & Africa OTC Braces & Supports Volume (K), by Country 2025 & 2033
- Figure 49: Middle East & Africa OTC Braces & Supports Revenue Share (%), by Country 2025 & 2033
- Figure 50: Middle East & Africa OTC Braces & Supports Volume Share (%), by Country 2025 & 2033
- Figure 51: Asia Pacific OTC Braces & Supports Revenue (undefined), by Application 2025 & 2033
- Figure 52: Asia Pacific OTC Braces & Supports Volume (K), by Application 2025 & 2033
- Figure 53: Asia Pacific OTC Braces & Supports Revenue Share (%), by Application 2025 & 2033
- Figure 54: Asia Pacific OTC Braces & Supports Volume Share (%), by Application 2025 & 2033
- Figure 55: Asia Pacific OTC Braces & Supports Revenue (undefined), by Types 2025 & 2033
- Figure 56: Asia Pacific OTC Braces & Supports Volume (K), by Types 2025 & 2033
- Figure 57: Asia Pacific OTC Braces & Supports Revenue Share (%), by Types 2025 & 2033
- Figure 58: Asia Pacific OTC Braces & Supports Volume Share (%), by Types 2025 & 2033
- Figure 59: Asia Pacific OTC Braces & Supports Revenue (undefined), by Country 2025 & 2033
- Figure 60: Asia Pacific OTC Braces & Supports Volume (K), by Country 2025 & 2033
- Figure 61: Asia Pacific OTC Braces & Supports Revenue Share (%), by Country 2025 & 2033
- Figure 62: Asia Pacific OTC Braces & Supports Volume Share (%), by Country 2025 & 2033
List of Tables
- Table 1: Global OTC Braces & Supports Revenue undefined Forecast, by Application 2020 & 2033
- Table 2: Global OTC Braces & Supports Volume K Forecast, by Application 2020 & 2033
- Table 3: Global OTC Braces & Supports Revenue undefined Forecast, by Types 2020 & 2033
- Table 4: Global OTC Braces & Supports Volume K Forecast, by Types 2020 & 2033
- Table 5: Global OTC Braces & Supports Revenue undefined Forecast, by Region 2020 & 2033
- Table 6: Global OTC Braces & Supports Volume K Forecast, by Region 2020 & 2033
- Table 7: Global OTC Braces & Supports Revenue undefined Forecast, by Application 2020 & 2033
- Table 8: Global OTC Braces & Supports Volume K Forecast, by Application 2020 & 2033
- Table 9: Global OTC Braces & Supports Revenue undefined Forecast, by Types 2020 & 2033
- Table 10: Global OTC Braces & Supports Volume K Forecast, by Types 2020 & 2033
- Table 11: Global OTC Braces & Supports Revenue undefined Forecast, by Country 2020 & 2033
- Table 12: Global OTC Braces & Supports Volume K Forecast, by Country 2020 & 2033
- Table 13: United States OTC Braces & Supports Revenue (undefined) Forecast, by Application 2020 & 2033
- Table 14: United States OTC Braces & Supports Volume (K) Forecast, by Application 2020 & 2033
- Table 15: Canada OTC Braces & Supports Revenue (undefined) Forecast, by Application 2020 & 2033
- Table 16: Canada OTC Braces & Supports Volume (K) Forecast, by Application 2020 & 2033
- Table 17: Mexico OTC Braces & Supports Revenue (undefined) Forecast, by Application 2020 & 2033
- Table 18: Mexico OTC Braces & Supports Volume (K) Forecast, by Application 2020 & 2033
- Table 19: Global OTC Braces & Supports Revenue undefined Forecast, by Application 2020 & 2033
- Table 20: Global OTC Braces & Supports Volume K Forecast, by Application 2020 & 2033
- Table 21: Global OTC Braces & Supports Revenue undefined Forecast, by Types 2020 & 2033
- Table 22: Global OTC Braces & Supports Volume K Forecast, by Types 2020 & 2033
- Table 23: Global OTC Braces & Supports Revenue undefined Forecast, by Country 2020 & 2033
- Table 24: Global OTC Braces & Supports Volume K Forecast, by Country 2020 & 2033
- Table 25: Brazil OTC Braces & Supports Revenue (undefined) Forecast, by Application 2020 & 2033
- Table 26: Brazil OTC Braces & Supports Volume (K) Forecast, by Application 2020 & 2033
- Table 27: Argentina OTC Braces & Supports Revenue (undefined) Forecast, by Application 2020 & 2033
- Table 28: Argentina OTC Braces & Supports Volume (K) Forecast, by Application 2020 & 2033
- Table 29: Rest of South America OTC Braces & Supports Revenue (undefined) Forecast, by Application 2020 & 2033
- Table 30: Rest of South America OTC Braces & Supports Volume (K) Forecast, by Application 2020 & 2033
- Table 31: Global OTC Braces & Supports Revenue undefined Forecast, by Application 2020 & 2033
- Table 32: Global OTC Braces & Supports Volume K Forecast, by Application 2020 & 2033
- Table 33: Global OTC Braces & Supports Revenue undefined Forecast, by Types 2020 & 2033
- Table 34: Global OTC Braces & Supports Volume K Forecast, by Types 2020 & 2033
- Table 35: Global OTC Braces & Supports Revenue undefined Forecast, by Country 2020 & 2033
- Table 36: Global OTC Braces & Supports Volume K Forecast, by Country 2020 & 2033
- Table 37: United Kingdom OTC Braces & Supports Revenue (undefined) Forecast, by Application 2020 & 2033
- Table 38: United Kingdom OTC Braces & Supports Volume (K) Forecast, by Application 2020 & 2033
- Table 39: Germany OTC Braces & Supports Revenue (undefined) Forecast, by Application 2020 & 2033
- Table 40: Germany OTC Braces & Supports Volume (K) Forecast, by Application 2020 & 2033
- Table 41: France OTC Braces & Supports Revenue (undefined) Forecast, by Application 2020 & 2033
- Table 42: France OTC Braces & Supports Volume (K) Forecast, by Application 2020 & 2033
- Table 43: Italy OTC Braces & Supports Revenue (undefined) Forecast, by Application 2020 & 2033
- Table 44: Italy OTC Braces & Supports Volume (K) Forecast, by Application 2020 & 2033
- Table 45: Spain OTC Braces & Supports Revenue (undefined) Forecast, by Application 2020 & 2033
- Table 46: Spain OTC Braces & Supports Volume (K) Forecast, by Application 2020 & 2033
- Table 47: Russia OTC Braces & Supports Revenue (undefined) Forecast, by Application 2020 & 2033
- Table 48: Russia OTC Braces & Supports Volume (K) Forecast, by Application 2020 & 2033
- Table 49: Benelux OTC Braces & Supports Revenue (undefined) Forecast, by Application 2020 & 2033
- Table 50: Benelux OTC Braces & Supports Volume (K) Forecast, by Application 2020 & 2033
- Table 51: Nordics OTC Braces & Supports Revenue (undefined) Forecast, by Application 2020 & 2033
- Table 52: Nordics OTC Braces & Supports Volume (K) Forecast, by Application 2020 & 2033
- Table 53: Rest of Europe OTC Braces & Supports Revenue (undefined) Forecast, by Application 2020 & 2033
- Table 54: Rest of Europe OTC Braces & Supports Volume (K) Forecast, by Application 2020 & 2033
- Table 55: Global OTC Braces & Supports Revenue undefined Forecast, by Application 2020 & 2033
- Table 56: Global OTC Braces & Supports Volume K Forecast, by Application 2020 & 2033
- Table 57: Global OTC Braces & Supports Revenue undefined Forecast, by Types 2020 & 2033
- Table 58: Global OTC Braces & Supports Volume K Forecast, by Types 2020 & 2033
- Table 59: Global OTC Braces & Supports Revenue undefined Forecast, by Country 2020 & 2033
- Table 60: Global OTC Braces & Supports Volume K Forecast, by Country 2020 & 2033
- Table 61: Turkey OTC Braces & Supports Revenue (undefined) Forecast, by Application 2020 & 2033
- Table 62: Turkey OTC Braces & Supports Volume (K) Forecast, by Application 2020 & 2033
- Table 63: Israel OTC Braces & Supports Revenue (undefined) Forecast, by Application 2020 & 2033
- Table 64: Israel OTC Braces & Supports Volume (K) Forecast, by Application 2020 & 2033
- Table 65: GCC OTC Braces & Supports Revenue (undefined) Forecast, by Application 2020 & 2033
- Table 66: GCC OTC Braces & Supports Volume (K) Forecast, by Application 2020 & 2033
- Table 67: North Africa OTC Braces & Supports Revenue (undefined) Forecast, by Application 2020 & 2033
- Table 68: North Africa OTC Braces & Supports Volume (K) Forecast, by Application 2020 & 2033
- Table 69: South Africa OTC Braces & Supports Revenue (undefined) Forecast, by Application 2020 & 2033
- Table 70: South Africa OTC Braces & Supports Volume (K) Forecast, by Application 2020 & 2033
- Table 71: Rest of Middle East & Africa OTC Braces & Supports Revenue (undefined) Forecast, by Application 2020 & 2033
- Table 72: Rest of Middle East & Africa OTC Braces & Supports Volume (K) Forecast, by Application 2020 & 2033
- Table 73: Global OTC Braces & Supports Revenue undefined Forecast, by Application 2020 & 2033
- Table 74: Global OTC Braces & Supports Volume K Forecast, by Application 2020 & 2033
- Table 75: Global OTC Braces & Supports Revenue undefined Forecast, by Types 2020 & 2033
- Table 76: Global OTC Braces & Supports Volume K Forecast, by Types 2020 & 2033
- Table 77: Global OTC Braces & Supports Revenue undefined Forecast, by Country 2020 & 2033
- Table 78: Global OTC Braces & Supports Volume K Forecast, by Country 2020 & 2033
- Table 79: China OTC Braces & Supports Revenue (undefined) Forecast, by Application 2020 & 2033
- Table 80: China OTC Braces & Supports Volume (K) Forecast, by Application 2020 & 2033
- Table 81: India OTC Braces & Supports Revenue (undefined) Forecast, by Application 2020 & 2033
- Table 82: India OTC Braces & Supports Volume (K) Forecast, by Application 2020 & 2033
- Table 83: Japan OTC Braces & Supports Revenue (undefined) Forecast, by Application 2020 & 2033
- Table 84: Japan OTC Braces & Supports Volume (K) Forecast, by Application 2020 & 2033
- Table 85: South Korea OTC Braces & Supports Revenue (undefined) Forecast, by Application 2020 & 2033
- Table 86: South Korea OTC Braces & Supports Volume (K) Forecast, by Application 2020 & 2033
- Table 87: ASEAN OTC Braces & Supports Revenue (undefined) Forecast, by Application 2020 & 2033
- Table 88: ASEAN OTC Braces & Supports Volume (K) Forecast, by Application 2020 & 2033
- Table 89: Oceania OTC Braces & Supports Revenue (undefined) Forecast, by Application 2020 & 2033
- Table 90: Oceania OTC Braces & Supports Volume (K) Forecast, by Application 2020 & 2033
- Table 91: Rest of Asia Pacific OTC Braces & Supports Revenue (undefined) Forecast, by Application 2020 & 2033
- Table 92: Rest of Asia Pacific OTC Braces & Supports Volume (K) Forecast, by Application 2020 & 2033
Frequently Asked Questions
1. What is the projected Compound Annual Growth Rate (CAGR) of the OTC Braces & Supports?
The projected CAGR is approximately 6.6%.
2. Which companies are prominent players in the OTC Braces & Supports?
Key companies in the market include 3M, Bauerfeind, DJO Finance, BSN Medical, Össur Hf, DeRoyal Industries.
3. What are the main segments of the OTC Braces & Supports?
The market segments include Application, Types.
4. Can you provide details about the market size?
The market size is estimated to be USD XXX N/A as of 2022.
5. What are some drivers contributing to market growth?
N/A
6. What are the notable trends driving market growth?
N/A
7. Are there any restraints impacting market growth?
N/A
8. Can you provide examples of recent developments in the market?
N/A
9. What pricing options are available for accessing the report?
Pricing options include single-user, multi-user, and enterprise licenses priced at USD 3950.00, USD 5925.00, and USD 7900.00 respectively.
10. Is the market size provided in terms of value or volume?
The market size is provided in terms of value, measured in N/A and volume, measured in K.
11. Are there any specific market keywords associated with the report?
Yes, the market keyword associated with the report is "OTC Braces & Supports," which aids in identifying and referencing the specific market segment covered.
12. How do I determine which pricing option suits my needs best?
The pricing options vary based on user requirements and access needs. Individual users may opt for single-user licenses, while businesses requiring broader access may choose multi-user or enterprise licenses for cost-effective access to the report.
13. Are there any additional resources or data provided in the OTC Braces & Supports report?
While the report offers comprehensive insights, it's advisable to review the specific contents or supplementary materials provided to ascertain if additional resources or data are available.
14. How can I stay updated on further developments or reports in the OTC Braces & Supports?
To stay informed about further developments, trends, and reports in the OTC Braces & Supports, consider subscribing to industry newsletters, following relevant companies and organizations, or regularly checking reputable industry news sources and publications.
Methodology
Step 1 - Identification of Relevant Samples Size from Population Database


Step 2 - Approaches for Defining Global Market Size (Value, Volume* & Price*)

Note*: In applicable scenarios
Step 3 - Data Sources
Primary Research
- Web Analytics
- Survey Reports
- Research Institute
- Latest Research Reports
- Opinion Leaders
Secondary Research
- Annual Reports
- White Paper
- Latest Press Release
- Industry Association
- Paid Database
- Investor Presentations

Step 4 - Data Triangulation
Involves using different sources of information in order to increase the validity of a study
These sources are likely to be stakeholders in a program - participants, other researchers, program staff, other community members, and so on.
Then we put all data in single framework & apply various statistical tools to find out the dynamic on the market.
During the analysis stage, feedback from the stakeholder groups would be compared to determine areas of agreement as well as areas of divergence