
Key Insights
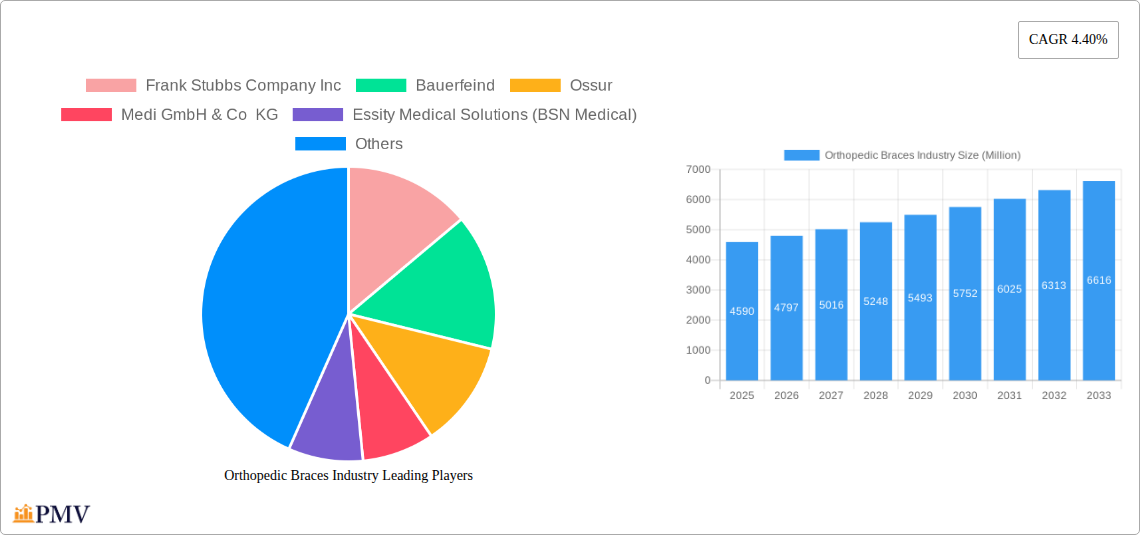
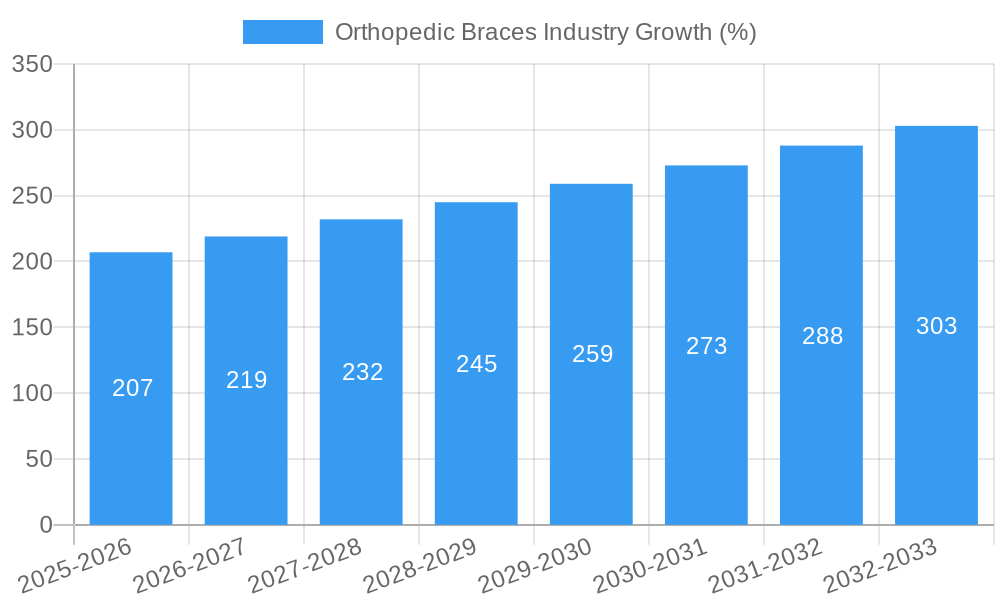
The global orthopedic braces market, valued at $4.59 billion in 2025, is projected to experience robust growth, driven by factors such as the rising prevalence of chronic conditions like osteoarthritis and osteoporosis, an aging global population necessitating increased mobility support, and advancements in brace technology leading to improved comfort and functionality. The market's compound annual growth rate (CAGR) of 4.40% from 2025 to 2033 indicates a significant expansion opportunity. Key segments driving growth include lower extremity braces and supports, followed by knee and spinal braces, with strong demand from hospitals and orthopedic centers. The increasing preference for minimally invasive surgical procedures and a subsequent rise in post-operative rehabilitation needs also contributes significantly to the market's upward trajectory. Technological advancements, such as the integration of smart sensors and materials, are further enhancing brace effectiveness and patient compliance, thereby fueling market expansion. Geographic distribution shows strong performance in North America and Europe, driven by robust healthcare infrastructure and high disposable incomes, with significant growth potential in Asia-Pacific due to rising healthcare expenditure and increasing awareness.
Competition within the orthopedic braces market is intense, with major players including established brands like Ossur, Zimmer Biomet, and 3M, alongside regional manufacturers. These companies are engaged in strategic initiatives such as product innovation, mergers and acquisitions, and geographic expansion to consolidate their market share. However, factors like high product costs, reimbursement challenges, and the potential for adverse events can act as restraints. Future market growth will depend on the successful navigation of these challenges, alongside further advancements in brace design, materials science, and cost-effective manufacturing processes to increase accessibility and affordability, particularly in developing regions. The development of more personalized and customized braces, tailored to individual patient needs and preferences, presents a significant future growth opportunity within this dynamic market.
Orthopedic Braces Industry Market Report: 2019-2033
This comprehensive report provides a detailed analysis of the global orthopedic braces market, offering invaluable insights for industry stakeholders, investors, and researchers. Covering the period from 2019 to 2033, with a base year of 2025 and a forecast period of 2025-2033, this report offers a thorough understanding of market dynamics, competitive landscape, and future growth potential. The market is projected to reach xx Million by 2033, exhibiting a CAGR of xx% during the forecast period.
Orthopedic Braces Industry Market Structure & Competitive Dynamics
The global orthopedic braces market is moderately concentrated, with several key players holding significant market share. The industry witnesses continuous innovation, driven by advancements in materials science, manufacturing techniques, and biomechanics. Stringent regulatory frameworks govern product safety and efficacy, impacting market entry and product development. The market experiences competition from alternative therapies and substitute products, including physiotherapy and surgery. End-user trends, such as increasing demand for minimally invasive procedures and personalized treatment plans, shape market demand. Significant mergers and acquisitions (M&A) activities further reshape the competitive landscape. For example, the acquisition of LimaCorporate S.p.A. by Enovis Corporation in September 2023 demonstrates a significant consolidation trend. The estimated value of this deal is xx Million.
- Market Concentration: Moderate, with top 5 players holding approximately xx% market share.
- Innovation Ecosystems: Strong, driven by research and development in materials science and biomechanics.
- Regulatory Frameworks: Stringent, focusing on product safety and efficacy.
- M&A Activity: Significant, with deals impacting market consolidation and product portfolios.
Orthopedic Braces Industry Industry Trends & Insights
The orthopedic braces market is experiencing robust growth fueled by several factors. The aging global population, coupled with rising incidence of musculoskeletal disorders like osteoarthritis and osteoporosis, significantly drives demand. Technological advancements, including the development of lightweight, comfortable, and functional braces, enhance patient compliance and market appeal. Consumer preferences are shifting towards personalized, customized braces offering superior comfort and efficacy. The competitive landscape is characterized by continuous innovation, strategic partnerships, and M&A activity. The market penetration of technologically advanced braces is steadily increasing, with xx% market penetration expected by 2033. This growth is projected to continue at a CAGR of xx% during the forecast period.
Dominant Markets & Segments in Orthopedic Braces Industry
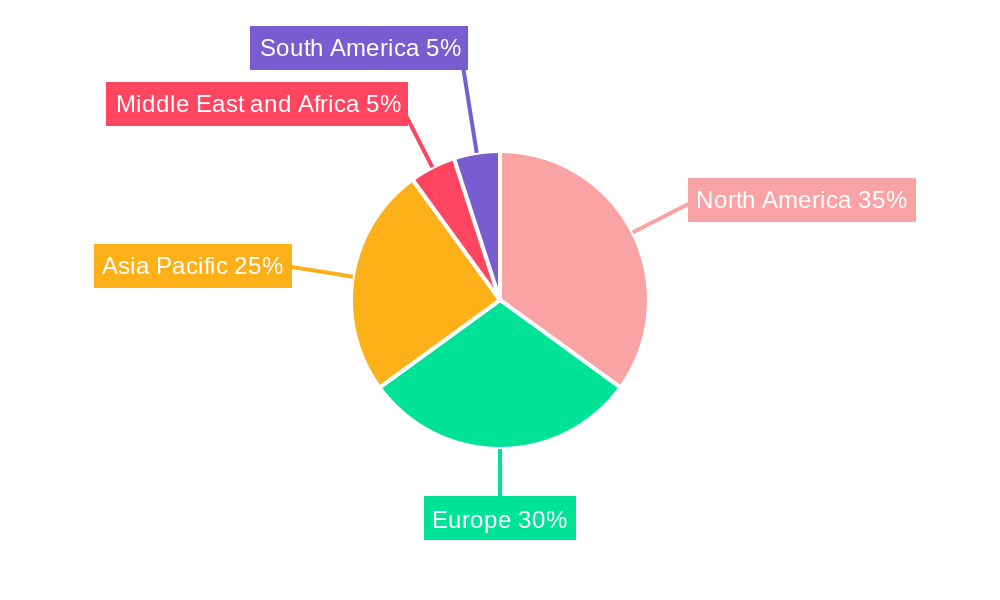
The North American region currently dominates the orthopedic braces market, driven by factors such as high healthcare expenditure, advanced medical infrastructure, and a large aging population. Within product segments, lower extremity braces and supports command the largest market share, followed by spinal and upper extremity braces. Hospitals and orthopedic centers constitute the primary end-users, representing a substantial portion of the market.
- Key Drivers for North America:
- High healthcare expenditure.
- Advanced medical infrastructure.
- Large aging population.
- High prevalence of musculoskeletal disorders.
- Dominant Product Segment: Lower Extremity Braces and Supports, due to high incidence of conditions like osteoarthritis and sports injuries.
- Dominant End-User: Hospitals and Orthopedic Centers, due to high volume of procedures and specialized care.
Orthopedic Braces Industry Product Innovations
Recent product innovations focus on enhancing comfort, functionality, and patient compliance. Lightweight materials, advanced designs incorporating biomechanics principles, and personalized fitting options are key trends. Smart braces integrating sensors and data analytics are emerging, promising improved treatment outcomes and remote patient monitoring capabilities. These innovations offer significant competitive advantages by catering to the increasing demand for effective and patient-friendly solutions.
Report Segmentation & Scope
This report segments the orthopedic braces market across various parameters:
- Product Type: Lower Extremity Braces and Supports (projected market size xx Million by 2033), Knee Braces and Supports (projected market size xx Million by 2033), Spinal Braces and Supports (projected market size xx Million by 2033), Upper Extremity Braces and Supports (projected market size xx Million by 2033). Each segment displays varying growth rates and competitive dynamics.
- End User: Hospitals (projected market size xx Million by 2033), Orthopedic Centers (projected market size xx Million by 2033), Other End Users (projected market size xx Million by 2033). Market share distribution varies across these segments, driven by factors such as treatment patterns and healthcare infrastructure.
Key Drivers of Orthopedic Braces Industry Growth
Several factors fuel the growth of the orthopedic braces market:
- Rising Prevalence of Musculoskeletal Disorders: The aging population and increased incidence of conditions like osteoarthritis and sports injuries drive demand.
- Technological Advancements: Innovations in materials and design lead to improved brace comfort, functionality, and efficacy.
- Increased Healthcare Expenditure: Higher healthcare spending globally increases access to advanced medical devices.
Challenges in the Orthopedic Braces Industry Sector
The orthopedic braces industry faces challenges including:
- Stringent Regulatory Approvals: The process of obtaining regulatory clearances can be time-consuming and costly.
- Supply Chain Disruptions: Global supply chain vulnerabilities can impact manufacturing and product availability.
- Intense Competition: The market is competitive, requiring manufacturers to differentiate their products and offer value-added services.
Leading Players in the Orthopedic Braces Industry Market
- Frank Stubbs Company Inc
- Bauerfeind
- Ossur
- Medi GmbH & Co KG
- Essity Medical Solutions (BSN Medical)
- DeRoyal Industries Inc
- 3M
- DJO LLC (Enovis)
- Bird & Cronin LLC
- Becker Orthopedic
- ALCARE Co Ltd
- Ottobock SE & Co KGaA
- Zimmer Biomet
Key Developments in Orthopedic Braces Industry Sector
- September 2023: Enovis Corporation acquired LimaCorporate S.p.A., expanding its orthopedic device portfolio.
- October 2023: OrthoPediatrics Corp. launched the DF2 Brace for pediatric musculoskeletal injuries, expanding into the non-surgical market.
Strategic Orthopedic Braces Industry Market Outlook
The orthopedic braces market presents significant growth potential, driven by technological advancements, increasing prevalence of musculoskeletal disorders, and rising healthcare expenditure. Strategic opportunities lie in developing innovative products, expanding into emerging markets, and forging strategic partnerships. Focusing on personalized solutions and leveraging digital technologies for improved patient care will be crucial for success in this dynamic market.
Orthopedic Braces Industry Segmentation
-
1. Product
-
1.1. Lower Extremity Braces and Supports
- 1.1.1. Ankle and Foot
- 1.1.2. Hip
- 1.1.3. Knee
- 1.2. Spinal Braces and Supports
-
1.3. Upper Extremity Braces and Supports
- 1.3.1. Elbow
- 1.3.2. Hand and Wrist
- 1.3.3. Others
-
1.1. Lower Extremity Braces and Supports
-
2. End User
- 2.1. Hospitals
- 2.2. Orthopedic Centers
- 2.3. Other End Users
Orthopedic Braces Industry Segmentation By Geography
-
1. North America
- 1.1. United States
- 1.2. Canada
- 1.3. Mexico
-
2. Europe
- 2.1. Germany
- 2.2. United Kingdom
- 2.3. France
- 2.4. Italy
- 2.5. Spain
- 2.6. Rest of Europe
-
3. Asia Pacific
- 3.1. China
- 3.2. Japan
- 3.3. India
- 3.4. Australia
- 3.5. South Korea
- 3.6. Rest of Asia Pacific
-
4. Middle East and Africa
- 4.1. GCC
- 4.2. South Africa
- 4.3. Rest of Middle East and Africa
-
5. South America
- 5.1. Brazil
- 5.2. Argentina
- 5.3. Rest of South America
Orthopedic Braces Industry REPORT HIGHLIGHTS
| Aspects | Details |
|---|---|
| Study Period | 2019-2033 |
| Base Year | 2024 |
| Estimated Year | 2025 |
| Forecast Period | 2025-2033 |
| Historical Period | 2019-2024 |
| Growth Rate | CAGR of 4.40% from 2019-2033 |
| Segmentation |
|
Table of Contents
- 1. Introduction
- 1.1. Research Scope
- 1.2. Market Segmentation
- 1.3. Research Methodology
- 1.4. Definitions and Assumptions
- 2. Executive Summary
- 2.1. Introduction
- 3. Market Dynamics
- 3.1. Introduction
- 3.2. Market Drivers
- 3.2.1. Rise in Bone Fracture Cases; Rise in Musculoskeletal Disorders; Growing Number of Road Accidents and Sport-related Injuries
- 3.3. Market Restrains
- 3.3.1. Negligence Toward Minor Injuries; Lack of Awareness Regarding the New Orthopedic Braces and Supports
- 3.4. Market Trends
- 3.4.1. Spinal Braces and Supports Segment is Expected to Witness Significant Growth Over the Forecast Period
- 4. Market Factor Analysis
- 4.1. Porters Five Forces
- 4.2. Supply/Value Chain
- 4.3. PESTEL analysis
- 4.4. Market Entropy
- 4.5. Patent/Trademark Analysis
- 5. Global Orthopedic Braces Industry Analysis, Insights and Forecast, 2019-2031
- 5.1. Market Analysis, Insights and Forecast - by Product
- 5.1.1. Lower Extremity Braces and Supports
- 5.1.1.1. Ankle and Foot
- 5.1.1.2. Hip
- 5.1.1.3. Knee
- 5.1.2. Spinal Braces and Supports
- 5.1.3. Upper Extremity Braces and Supports
- 5.1.3.1. Elbow
- 5.1.3.2. Hand and Wrist
- 5.1.3.3. Others
- 5.1.1. Lower Extremity Braces and Supports
- 5.2. Market Analysis, Insights and Forecast - by End User
- 5.2.1. Hospitals
- 5.2.2. Orthopedic Centers
- 5.2.3. Other End Users
- 5.3. Market Analysis, Insights and Forecast - by Region
- 5.3.1. North America
- 5.3.2. Europe
- 5.3.3. Asia Pacific
- 5.3.4. Middle East and Africa
- 5.3.5. South America
- 5.1. Market Analysis, Insights and Forecast - by Product
- 6. North America Orthopedic Braces Industry Analysis, Insights and Forecast, 2019-2031
- 6.1. Market Analysis, Insights and Forecast - by Product
- 6.1.1. Lower Extremity Braces and Supports
- 6.1.1.1. Ankle and Foot
- 6.1.1.2. Hip
- 6.1.1.3. Knee
- 6.1.2. Spinal Braces and Supports
- 6.1.3. Upper Extremity Braces and Supports
- 6.1.3.1. Elbow
- 6.1.3.2. Hand and Wrist
- 6.1.3.3. Others
- 6.1.1. Lower Extremity Braces and Supports
- 6.2. Market Analysis, Insights and Forecast - by End User
- 6.2.1. Hospitals
- 6.2.2. Orthopedic Centers
- 6.2.3. Other End Users
- 6.1. Market Analysis, Insights and Forecast - by Product
- 7. Europe Orthopedic Braces Industry Analysis, Insights and Forecast, 2019-2031
- 7.1. Market Analysis, Insights and Forecast - by Product
- 7.1.1. Lower Extremity Braces and Supports
- 7.1.1.1. Ankle and Foot
- 7.1.1.2. Hip
- 7.1.1.3. Knee
- 7.1.2. Spinal Braces and Supports
- 7.1.3. Upper Extremity Braces and Supports
- 7.1.3.1. Elbow
- 7.1.3.2. Hand and Wrist
- 7.1.3.3. Others
- 7.1.1. Lower Extremity Braces and Supports
- 7.2. Market Analysis, Insights and Forecast - by End User
- 7.2.1. Hospitals
- 7.2.2. Orthopedic Centers
- 7.2.3. Other End Users
- 7.1. Market Analysis, Insights and Forecast - by Product
- 8. Asia Pacific Orthopedic Braces Industry Analysis, Insights and Forecast, 2019-2031
- 8.1. Market Analysis, Insights and Forecast - by Product
- 8.1.1. Lower Extremity Braces and Supports
- 8.1.1.1. Ankle and Foot
- 8.1.1.2. Hip
- 8.1.1.3. Knee
- 8.1.2. Spinal Braces and Supports
- 8.1.3. Upper Extremity Braces and Supports
- 8.1.3.1. Elbow
- 8.1.3.2. Hand and Wrist
- 8.1.3.3. Others
- 8.1.1. Lower Extremity Braces and Supports
- 8.2. Market Analysis, Insights and Forecast - by End User
- 8.2.1. Hospitals
- 8.2.2. Orthopedic Centers
- 8.2.3. Other End Users
- 8.1. Market Analysis, Insights and Forecast - by Product
- 9. Middle East and Africa Orthopedic Braces Industry Analysis, Insights and Forecast, 2019-2031
- 9.1. Market Analysis, Insights and Forecast - by Product
- 9.1.1. Lower Extremity Braces and Supports
- 9.1.1.1. Ankle and Foot
- 9.1.1.2. Hip
- 9.1.1.3. Knee
- 9.1.2. Spinal Braces and Supports
- 9.1.3. Upper Extremity Braces and Supports
- 9.1.3.1. Elbow
- 9.1.3.2. Hand and Wrist
- 9.1.3.3. Others
- 9.1.1. Lower Extremity Braces and Supports
- 9.2. Market Analysis, Insights and Forecast - by End User
- 9.2.1. Hospitals
- 9.2.2. Orthopedic Centers
- 9.2.3. Other End Users
- 9.1. Market Analysis, Insights and Forecast - by Product
- 10. South America Orthopedic Braces Industry Analysis, Insights and Forecast, 2019-2031
- 10.1. Market Analysis, Insights and Forecast - by Product
- 10.1.1. Lower Extremity Braces and Supports
- 10.1.1.1. Ankle and Foot
- 10.1.1.2. Hip
- 10.1.1.3. Knee
- 10.1.2. Spinal Braces and Supports
- 10.1.3. Upper Extremity Braces and Supports
- 10.1.3.1. Elbow
- 10.1.3.2. Hand and Wrist
- 10.1.3.3. Others
- 10.1.1. Lower Extremity Braces and Supports
- 10.2. Market Analysis, Insights and Forecast - by End User
- 10.2.1. Hospitals
- 10.2.2. Orthopedic Centers
- 10.2.3. Other End Users
- 10.1. Market Analysis, Insights and Forecast - by Product
- 11. North America Orthopedic Braces Industry Analysis, Insights and Forecast, 2019-2031
- 11.1. Market Analysis, Insights and Forecast - By Country/Sub-region
- 11.1.1 United States
- 11.1.2 Canada
- 11.1.3 Mexico
- 12. Europe Orthopedic Braces Industry Analysis, Insights and Forecast, 2019-2031
- 12.1. Market Analysis, Insights and Forecast - By Country/Sub-region
- 12.1.1 Germany
- 12.1.2 United Kingdom
- 12.1.3 France
- 12.1.4 Italy
- 12.1.5 Spain
- 12.1.6 Rest of Europe
- 13. Asia Pacific Orthopedic Braces Industry Analysis, Insights and Forecast, 2019-2031
- 13.1. Market Analysis, Insights and Forecast - By Country/Sub-region
- 13.1.1 China
- 13.1.2 Japan
- 13.1.3 India
- 13.1.4 Australia
- 13.1.5 South Korea
- 13.1.6 Rest of Asia Pacific
- 14. Middle East and Africa Orthopedic Braces Industry Analysis, Insights and Forecast, 2019-2031
- 14.1. Market Analysis, Insights and Forecast - By Country/Sub-region
- 14.1.1 GCC
- 14.1.2 South Africa
- 14.1.3 Rest of Middle East and Africa
- 15. South America Orthopedic Braces Industry Analysis, Insights and Forecast, 2019-2031
- 15.1. Market Analysis, Insights and Forecast - By Country/Sub-region
- 15.1.1 Brazil
- 15.1.2 Argentina
- 15.1.3 Rest of South America
- 16. Competitive Analysis
- 16.1. Global Market Share Analysis 2024
- 16.2. Company Profiles
- 16.2.1 Frank Stubbs Company Inc
- 16.2.1.1. Overview
- 16.2.1.2. Products
- 16.2.1.3. SWOT Analysis
- 16.2.1.4. Recent Developments
- 16.2.1.5. Financials (Based on Availability)
- 16.2.2 Bauerfeind
- 16.2.2.1. Overview
- 16.2.2.2. Products
- 16.2.2.3. SWOT Analysis
- 16.2.2.4. Recent Developments
- 16.2.2.5. Financials (Based on Availability)
- 16.2.3 Ossur
- 16.2.3.1. Overview
- 16.2.3.2. Products
- 16.2.3.3. SWOT Analysis
- 16.2.3.4. Recent Developments
- 16.2.3.5. Financials (Based on Availability)
- 16.2.4 Medi GmbH & Co KG
- 16.2.4.1. Overview
- 16.2.4.2. Products
- 16.2.4.3. SWOT Analysis
- 16.2.4.4. Recent Developments
- 16.2.4.5. Financials (Based on Availability)
- 16.2.5 Essity Medical Solutions (BSN Medical)
- 16.2.5.1. Overview
- 16.2.5.2. Products
- 16.2.5.3. SWOT Analysis
- 16.2.5.4. Recent Developments
- 16.2.5.5. Financials (Based on Availability)
- 16.2.6 DeRoyal Industries Inc
- 16.2.6.1. Overview
- 16.2.6.2. Products
- 16.2.6.3. SWOT Analysis
- 16.2.6.4. Recent Developments
- 16.2.6.5. Financials (Based on Availability)
- 16.2.7 3M
- 16.2.7.1. Overview
- 16.2.7.2. Products
- 16.2.7.3. SWOT Analysis
- 16.2.7.4. Recent Developments
- 16.2.7.5. Financials (Based on Availability)
- 16.2.8 DJO LLC (Enovis)
- 16.2.8.1. Overview
- 16.2.8.2. Products
- 16.2.8.3. SWOT Analysis
- 16.2.8.4. Recent Developments
- 16.2.8.5. Financials (Based on Availability)
- 16.2.9 Bird & Cronin LLC
- 16.2.9.1. Overview
- 16.2.9.2. Products
- 16.2.9.3. SWOT Analysis
- 16.2.9.4. Recent Developments
- 16.2.9.5. Financials (Based on Availability)
- 16.2.10 Becker Orthopedic
- 16.2.10.1. Overview
- 16.2.10.2. Products
- 16.2.10.3. SWOT Analysis
- 16.2.10.4. Recent Developments
- 16.2.10.5. Financials (Based on Availability)
- 16.2.11 ALCARE Co Ltd
- 16.2.11.1. Overview
- 16.2.11.2. Products
- 16.2.11.3. SWOT Analysis
- 16.2.11.4. Recent Developments
- 16.2.11.5. Financials (Based on Availability)
- 16.2.12 Ottobock SE & Co KGaA
- 16.2.12.1. Overview
- 16.2.12.2. Products
- 16.2.12.3. SWOT Analysis
- 16.2.12.4. Recent Developments
- 16.2.12.5. Financials (Based on Availability)
- 16.2.13 Zimmer Biomet
- 16.2.13.1. Overview
- 16.2.13.2. Products
- 16.2.13.3. SWOT Analysis
- 16.2.13.4. Recent Developments
- 16.2.13.5. Financials (Based on Availability)
- 16.2.1 Frank Stubbs Company Inc
List of Figures
- Figure 1: Global Orthopedic Braces Industry Revenue Breakdown (Million, %) by Region 2024 & 2032
- Figure 2: North America Orthopedic Braces Industry Revenue (Million), by Country 2024 & 2032
- Figure 3: North America Orthopedic Braces Industry Revenue Share (%), by Country 2024 & 2032
- Figure 4: Europe Orthopedic Braces Industry Revenue (Million), by Country 2024 & 2032
- Figure 5: Europe Orthopedic Braces Industry Revenue Share (%), by Country 2024 & 2032
- Figure 6: Asia Pacific Orthopedic Braces Industry Revenue (Million), by Country 2024 & 2032
- Figure 7: Asia Pacific Orthopedic Braces Industry Revenue Share (%), by Country 2024 & 2032
- Figure 8: Middle East and Africa Orthopedic Braces Industry Revenue (Million), by Country 2024 & 2032
- Figure 9: Middle East and Africa Orthopedic Braces Industry Revenue Share (%), by Country 2024 & 2032
- Figure 10: South America Orthopedic Braces Industry Revenue (Million), by Country 2024 & 2032
- Figure 11: South America Orthopedic Braces Industry Revenue Share (%), by Country 2024 & 2032
- Figure 12: North America Orthopedic Braces Industry Revenue (Million), by Product 2024 & 2032
- Figure 13: North America Orthopedic Braces Industry Revenue Share (%), by Product 2024 & 2032
- Figure 14: North America Orthopedic Braces Industry Revenue (Million), by End User 2024 & 2032
- Figure 15: North America Orthopedic Braces Industry Revenue Share (%), by End User 2024 & 2032
- Figure 16: North America Orthopedic Braces Industry Revenue (Million), by Country 2024 & 2032
- Figure 17: North America Orthopedic Braces Industry Revenue Share (%), by Country 2024 & 2032
- Figure 18: Europe Orthopedic Braces Industry Revenue (Million), by Product 2024 & 2032
- Figure 19: Europe Orthopedic Braces Industry Revenue Share (%), by Product 2024 & 2032
- Figure 20: Europe Orthopedic Braces Industry Revenue (Million), by End User 2024 & 2032
- Figure 21: Europe Orthopedic Braces Industry Revenue Share (%), by End User 2024 & 2032
- Figure 22: Europe Orthopedic Braces Industry Revenue (Million), by Country 2024 & 2032
- Figure 23: Europe Orthopedic Braces Industry Revenue Share (%), by Country 2024 & 2032
- Figure 24: Asia Pacific Orthopedic Braces Industry Revenue (Million), by Product 2024 & 2032
- Figure 25: Asia Pacific Orthopedic Braces Industry Revenue Share (%), by Product 2024 & 2032
- Figure 26: Asia Pacific Orthopedic Braces Industry Revenue (Million), by End User 2024 & 2032
- Figure 27: Asia Pacific Orthopedic Braces Industry Revenue Share (%), by End User 2024 & 2032
- Figure 28: Asia Pacific Orthopedic Braces Industry Revenue (Million), by Country 2024 & 2032
- Figure 29: Asia Pacific Orthopedic Braces Industry Revenue Share (%), by Country 2024 & 2032
- Figure 30: Middle East and Africa Orthopedic Braces Industry Revenue (Million), by Product 2024 & 2032
- Figure 31: Middle East and Africa Orthopedic Braces Industry Revenue Share (%), by Product 2024 & 2032
- Figure 32: Middle East and Africa Orthopedic Braces Industry Revenue (Million), by End User 2024 & 2032
- Figure 33: Middle East and Africa Orthopedic Braces Industry Revenue Share (%), by End User 2024 & 2032
- Figure 34: Middle East and Africa Orthopedic Braces Industry Revenue (Million), by Country 2024 & 2032
- Figure 35: Middle East and Africa Orthopedic Braces Industry Revenue Share (%), by Country 2024 & 2032
- Figure 36: South America Orthopedic Braces Industry Revenue (Million), by Product 2024 & 2032
- Figure 37: South America Orthopedic Braces Industry Revenue Share (%), by Product 2024 & 2032
- Figure 38: South America Orthopedic Braces Industry Revenue (Million), by End User 2024 & 2032
- Figure 39: South America Orthopedic Braces Industry Revenue Share (%), by End User 2024 & 2032
- Figure 40: South America Orthopedic Braces Industry Revenue (Million), by Country 2024 & 2032
- Figure 41: South America Orthopedic Braces Industry Revenue Share (%), by Country 2024 & 2032
List of Tables
- Table 1: Global Orthopedic Braces Industry Revenue Million Forecast, by Region 2019 & 2032
- Table 2: Global Orthopedic Braces Industry Revenue Million Forecast, by Product 2019 & 2032
- Table 3: Global Orthopedic Braces Industry Revenue Million Forecast, by End User 2019 & 2032
- Table 4: Global Orthopedic Braces Industry Revenue Million Forecast, by Region 2019 & 2032
- Table 5: Global Orthopedic Braces Industry Revenue Million Forecast, by Country 2019 & 2032
- Table 6: United States Orthopedic Braces Industry Revenue (Million) Forecast, by Application 2019 & 2032
- Table 7: Canada Orthopedic Braces Industry Revenue (Million) Forecast, by Application 2019 & 2032
- Table 8: Mexico Orthopedic Braces Industry Revenue (Million) Forecast, by Application 2019 & 2032
- Table 9: Global Orthopedic Braces Industry Revenue Million Forecast, by Country 2019 & 2032
- Table 10: Germany Orthopedic Braces Industry Revenue (Million) Forecast, by Application 2019 & 2032
- Table 11: United Kingdom Orthopedic Braces Industry Revenue (Million) Forecast, by Application 2019 & 2032
- Table 12: France Orthopedic Braces Industry Revenue (Million) Forecast, by Application 2019 & 2032
- Table 13: Italy Orthopedic Braces Industry Revenue (Million) Forecast, by Application 2019 & 2032
- Table 14: Spain Orthopedic Braces Industry Revenue (Million) Forecast, by Application 2019 & 2032
- Table 15: Rest of Europe Orthopedic Braces Industry Revenue (Million) Forecast, by Application 2019 & 2032
- Table 16: Global Orthopedic Braces Industry Revenue Million Forecast, by Country 2019 & 2032
- Table 17: China Orthopedic Braces Industry Revenue (Million) Forecast, by Application 2019 & 2032
- Table 18: Japan Orthopedic Braces Industry Revenue (Million) Forecast, by Application 2019 & 2032
- Table 19: India Orthopedic Braces Industry Revenue (Million) Forecast, by Application 2019 & 2032
- Table 20: Australia Orthopedic Braces Industry Revenue (Million) Forecast, by Application 2019 & 2032
- Table 21: South Korea Orthopedic Braces Industry Revenue (Million) Forecast, by Application 2019 & 2032
- Table 22: Rest of Asia Pacific Orthopedic Braces Industry Revenue (Million) Forecast, by Application 2019 & 2032
- Table 23: Global Orthopedic Braces Industry Revenue Million Forecast, by Country 2019 & 2032
- Table 24: GCC Orthopedic Braces Industry Revenue (Million) Forecast, by Application 2019 & 2032
- Table 25: South Africa Orthopedic Braces Industry Revenue (Million) Forecast, by Application 2019 & 2032
- Table 26: Rest of Middle East and Africa Orthopedic Braces Industry Revenue (Million) Forecast, by Application 2019 & 2032
- Table 27: Global Orthopedic Braces Industry Revenue Million Forecast, by Country 2019 & 2032
- Table 28: Brazil Orthopedic Braces Industry Revenue (Million) Forecast, by Application 2019 & 2032
- Table 29: Argentina Orthopedic Braces Industry Revenue (Million) Forecast, by Application 2019 & 2032
- Table 30: Rest of South America Orthopedic Braces Industry Revenue (Million) Forecast, by Application 2019 & 2032
- Table 31: Global Orthopedic Braces Industry Revenue Million Forecast, by Product 2019 & 2032
- Table 32: Global Orthopedic Braces Industry Revenue Million Forecast, by End User 2019 & 2032
- Table 33: Global Orthopedic Braces Industry Revenue Million Forecast, by Country 2019 & 2032
- Table 34: United States Orthopedic Braces Industry Revenue (Million) Forecast, by Application 2019 & 2032
- Table 35: Canada Orthopedic Braces Industry Revenue (Million) Forecast, by Application 2019 & 2032
- Table 36: Mexico Orthopedic Braces Industry Revenue (Million) Forecast, by Application 2019 & 2032
- Table 37: Global Orthopedic Braces Industry Revenue Million Forecast, by Product 2019 & 2032
- Table 38: Global Orthopedic Braces Industry Revenue Million Forecast, by End User 2019 & 2032
- Table 39: Global Orthopedic Braces Industry Revenue Million Forecast, by Country 2019 & 2032
- Table 40: Germany Orthopedic Braces Industry Revenue (Million) Forecast, by Application 2019 & 2032
- Table 41: United Kingdom Orthopedic Braces Industry Revenue (Million) Forecast, by Application 2019 & 2032
- Table 42: France Orthopedic Braces Industry Revenue (Million) Forecast, by Application 2019 & 2032
- Table 43: Italy Orthopedic Braces Industry Revenue (Million) Forecast, by Application 2019 & 2032
- Table 44: Spain Orthopedic Braces Industry Revenue (Million) Forecast, by Application 2019 & 2032
- Table 45: Rest of Europe Orthopedic Braces Industry Revenue (Million) Forecast, by Application 2019 & 2032
- Table 46: Global Orthopedic Braces Industry Revenue Million Forecast, by Product 2019 & 2032
- Table 47: Global Orthopedic Braces Industry Revenue Million Forecast, by End User 2019 & 2032
- Table 48: Global Orthopedic Braces Industry Revenue Million Forecast, by Country 2019 & 2032
- Table 49: China Orthopedic Braces Industry Revenue (Million) Forecast, by Application 2019 & 2032
- Table 50: Japan Orthopedic Braces Industry Revenue (Million) Forecast, by Application 2019 & 2032
- Table 51: India Orthopedic Braces Industry Revenue (Million) Forecast, by Application 2019 & 2032
- Table 52: Australia Orthopedic Braces Industry Revenue (Million) Forecast, by Application 2019 & 2032
- Table 53: South Korea Orthopedic Braces Industry Revenue (Million) Forecast, by Application 2019 & 2032
- Table 54: Rest of Asia Pacific Orthopedic Braces Industry Revenue (Million) Forecast, by Application 2019 & 2032
- Table 55: Global Orthopedic Braces Industry Revenue Million Forecast, by Product 2019 & 2032
- Table 56: Global Orthopedic Braces Industry Revenue Million Forecast, by End User 2019 & 2032
- Table 57: Global Orthopedic Braces Industry Revenue Million Forecast, by Country 2019 & 2032
- Table 58: GCC Orthopedic Braces Industry Revenue (Million) Forecast, by Application 2019 & 2032
- Table 59: South Africa Orthopedic Braces Industry Revenue (Million) Forecast, by Application 2019 & 2032
- Table 60: Rest of Middle East and Africa Orthopedic Braces Industry Revenue (Million) Forecast, by Application 2019 & 2032
- Table 61: Global Orthopedic Braces Industry Revenue Million Forecast, by Product 2019 & 2032
- Table 62: Global Orthopedic Braces Industry Revenue Million Forecast, by End User 2019 & 2032
- Table 63: Global Orthopedic Braces Industry Revenue Million Forecast, by Country 2019 & 2032
- Table 64: Brazil Orthopedic Braces Industry Revenue (Million) Forecast, by Application 2019 & 2032
- Table 65: Argentina Orthopedic Braces Industry Revenue (Million) Forecast, by Application 2019 & 2032
- Table 66: Rest of South America Orthopedic Braces Industry Revenue (Million) Forecast, by Application 2019 & 2032
Frequently Asked Questions
1. What is the projected Compound Annual Growth Rate (CAGR) of the Orthopedic Braces Industry?
The projected CAGR is approximately 4.40%.
2. Which companies are prominent players in the Orthopedic Braces Industry?
Key companies in the market include Frank Stubbs Company Inc, Bauerfeind, Ossur, Medi GmbH & Co KG, Essity Medical Solutions (BSN Medical), DeRoyal Industries Inc, 3M, DJO LLC (Enovis), Bird & Cronin LLC, Becker Orthopedic, ALCARE Co Ltd, Ottobock SE & Co KGaA, Zimmer Biomet.
3. What are the main segments of the Orthopedic Braces Industry?
The market segments include Product, End User.
4. Can you provide details about the market size?
The market size is estimated to be USD 4.59 Million as of 2022.
5. What are some drivers contributing to market growth?
Rise in Bone Fracture Cases; Rise in Musculoskeletal Disorders; Growing Number of Road Accidents and Sport-related Injuries.
6. What are the notable trends driving market growth?
Spinal Braces and Supports Segment is Expected to Witness Significant Growth Over the Forecast Period.
7. Are there any restraints impacting market growth?
Negligence Toward Minor Injuries; Lack of Awareness Regarding the New Orthopedic Braces and Supports.
8. Can you provide examples of recent developments in the market?
October 2023: OrthoPediatrics Corp. announced the limited release of the DF2 Brace as part of its expansion in the non-surgical business for treating kids with musculoskeletal injuries.
9. What pricing options are available for accessing the report?
Pricing options include single-user, multi-user, and enterprise licenses priced at USD 4750, USD 5250, and USD 8750 respectively.
10. Is the market size provided in terms of value or volume?
The market size is provided in terms of value, measured in Million.
11. Are there any specific market keywords associated with the report?
Yes, the market keyword associated with the report is "Orthopedic Braces Industry," which aids in identifying and referencing the specific market segment covered.
12. How do I determine which pricing option suits my needs best?
The pricing options vary based on user requirements and access needs. Individual users may opt for single-user licenses, while businesses requiring broader access may choose multi-user or enterprise licenses for cost-effective access to the report.
13. Are there any additional resources or data provided in the Orthopedic Braces Industry report?
While the report offers comprehensive insights, it's advisable to review the specific contents or supplementary materials provided to ascertain if additional resources or data are available.
14. How can I stay updated on further developments or reports in the Orthopedic Braces Industry?
To stay informed about further developments, trends, and reports in the Orthopedic Braces Industry, consider subscribing to industry newsletters, following relevant companies and organizations, or regularly checking reputable industry news sources and publications.
Methodology
Step 1 - Identification of Relevant Samples Size from Population Database


Step 2 - Approaches for Defining Global Market Size (Value, Volume* & Price*)

Note*: In applicable scenarios
Step 3 - Data Sources
Primary Research
- Web Analytics
- Survey Reports
- Research Institute
- Latest Research Reports
- Opinion Leaders
Secondary Research
- Annual Reports
- White Paper
- Latest Press Release
- Industry Association
- Paid Database
- Investor Presentations

Step 4 - Data Triangulation
Involves using different sources of information in order to increase the validity of a study
These sources are likely to be stakeholders in a program - participants, other researchers, program staff, other community members, and so on.
Then we put all data in single framework & apply various statistical tools to find out the dynamic on the market.
During the analysis stage, feedback from the stakeholder groups would be compared to determine areas of agreement as well as areas of divergence


