
Key Insights
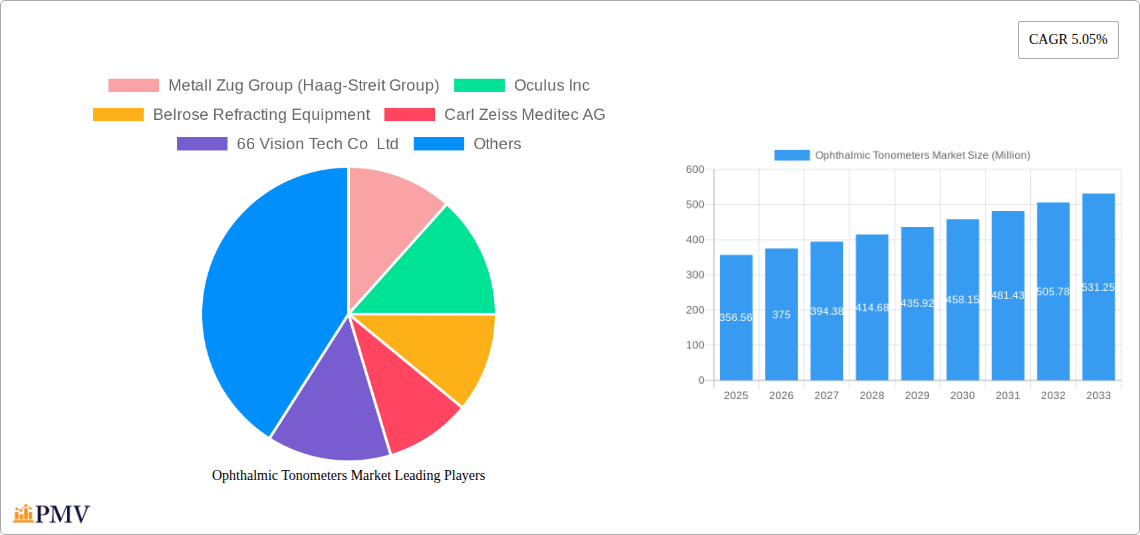
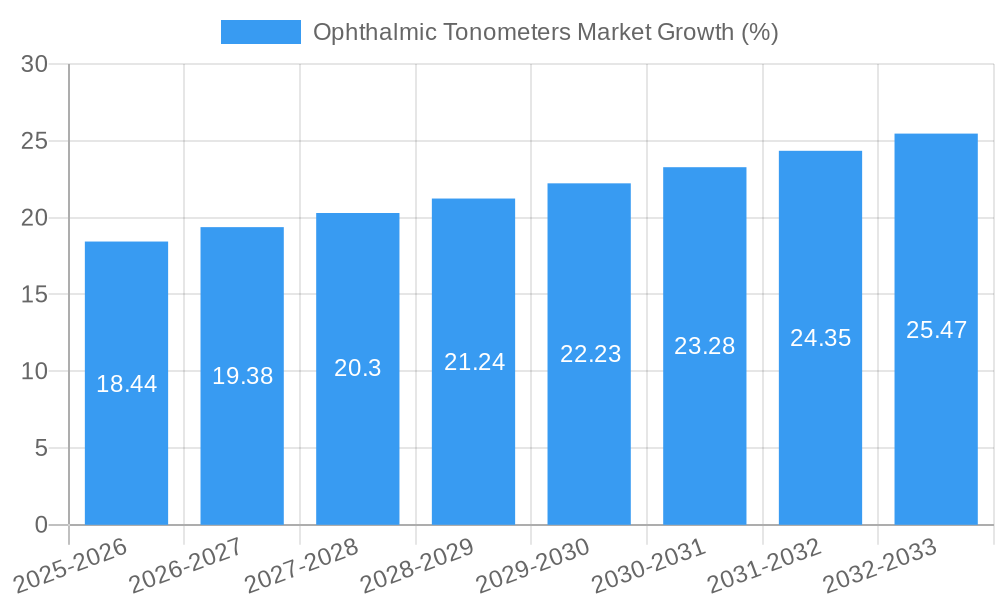
The global ophthalmic tonometers market, valued at $356.56 million in 2025, is projected to experience robust growth, driven by a rising prevalence of glaucoma and other eye diseases requiring regular intraocular pressure (IOP) monitoring. The market's Compound Annual Growth Rate (CAGR) of 5.05% from 2025 to 2033 indicates a steady expansion fueled by technological advancements, increasing geriatric populations susceptible to eye conditions, and growing awareness about preventative eye care. The adoption of non-contact tonometry, particularly applanation and rebound tonometry, is gaining traction due to its ease of use, reduced risk of infection, and improved patient comfort. Furthermore, the shift towards handheld and portable devices is enhancing accessibility in various settings, including clinics and home-based monitoring. Market segmentation reveals a significant share held by hospitals and ophthalmic centers, though the increasing penetration of portable devices is anticipated to boost growth in the home healthcare sector. Competitive dynamics are characterized by established players like Haag-Streit Group and Topcon Corporation, alongside emerging companies offering innovative technologies. Geographic expansion, especially in developing economies experiencing rising healthcare expenditure and improved infrastructure, presents significant opportunities. Challenges include the high cost of advanced tonometry equipment and the need for skilled professionals for accurate IOP measurements.
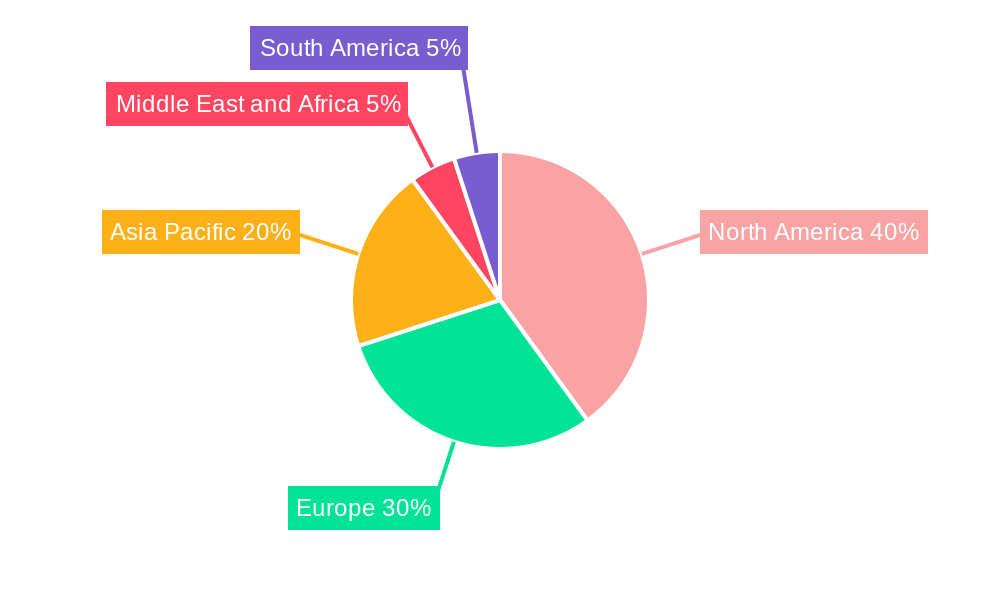
The North American region currently dominates the market, driven by high healthcare expenditure and technological advancements. However, Asia Pacific is expected to witness substantial growth over the forecast period, propelled by rising disposable incomes, increased healthcare awareness, and a rapidly expanding elderly population. Europe will maintain a steady growth trajectory, driven by government initiatives focused on improving ophthalmic care. While the market faces challenges from reimbursement policies and the competitive landscape, the long-term outlook remains positive, owing to the rising prevalence of age-related eye diseases and the continuous development of more accurate and user-friendly tonometry devices. This underscores the importance of strategic partnerships, technological innovations, and geographic expansion for companies operating in this sector.
This comprehensive report provides an in-depth analysis of the Ophthalmic Tonometers Market, offering valuable insights for industry stakeholders, investors, and researchers. Covering the period from 2019 to 2033, with 2025 as the base year, this report projects market trends, competitive dynamics, and growth opportunities within this vital segment of the ophthalmic devices industry. The market is expected to reach xx Million by 2033, exhibiting a CAGR of xx% during the forecast period (2025-2033).
Ophthalmic Tonometers Market Structure & Competitive Dynamics
This section analyzes the competitive landscape of the ophthalmic tonometers market, focusing on market concentration, innovation ecosystems, regulatory frameworks, product substitutes, end-user trends, and M&A activities. The market exhibits a moderately concentrated structure with key players holding significant market share. For example, Haag-Streit Group (Metall Zug Group) and Carl Zeiss Meditec AG hold a combined xx% market share, as of 2024. The market is characterized by ongoing innovation, with companies continually developing new technologies to improve accuracy, portability, and ease of use. Regulatory frameworks vary across geographies, impacting market entry and product approvals. Existing product substitutes include indirect ophthalmoscopy for assessing eye pressure, though this is not as precise as tonometry. End-user trends indicate a growing demand for non-contact tonometers due to improved patient comfort and reduced risk of infection. M&A activity has been relatively low in recent years, with deal values averaging xx Million per transaction over the historical period (2019-2024). This low level of M&A activity reflects the consolidated nature of the market.
- Market Concentration: Moderately concentrated, with key players holding significant market share.
- Innovation Ecosystems: Strong focus on technological advancements and product improvements.
- Regulatory Frameworks: Vary across regions, impacting market entry and product approvals.
- Product Substitutes: Limited substitutes with less accuracy than tonometry.
- End-User Trends: Increased preference for non-contact technologies.
- M&A Activity: Relatively low, with average deal values of xx Million.
Ophthalmic Tonometers Market Industry Trends & Insights
The ophthalmic tonometers market is driven by several factors, including the rising prevalence of glaucoma and other eye diseases, increasing demand for advanced diagnostic tools, and technological advancements in tonometry techniques. The market is witnessing significant growth, fueled by an aging global population and improving healthcare infrastructure, especially in developing economies. Technological disruptions, such as the introduction of non-contact and rebound tonometry technologies, are transforming the market by enhancing accuracy, efficiency, and patient comfort. Consumer preferences are increasingly shifting towards portable and user-friendly devices. Competitive dynamics are shaping market strategies, with leading players focusing on innovation, strategic partnerships, and acquisitions to maintain market leadership. The market is projected to grow at a CAGR of xx% during the forecast period (2025-2033), driven by these factors. Market penetration of non-contact tonometers is increasing steadily, reaching an estimated xx% in 2024.
Dominant Markets & Segments in Ophthalmic Tonometers Market
The North American region currently dominates the ophthalmic tonometers market due to higher healthcare expenditure, advanced healthcare infrastructure, and a high prevalence of eye diseases. Within this region, the United States holds the largest market share. Other significant markets include Western Europe and Asia-Pacific, driven by factors such as increasing disposable income, rising healthcare awareness, and government initiatives to improve eye care infrastructure.
- By Type: The direct ophthalmic tonometer segment holds a larger market share compared to the indirect segment.
- By Technology: Applanation tonometry remains the dominant technology, but rebound tonometry is gaining traction.
- By Portability: Handheld tonometers are experiencing higher growth due to increased portability and convenience.
- By End User: Hospitals and ophthalmic centers account for the majority of the market demand.
Key Drivers for Dominance:
- North America: High healthcare expenditure, advanced healthcare infrastructure, high prevalence of eye diseases.
- Western Europe: Well-developed healthcare systems, high awareness of eye health.
- Asia-Pacific: Rising disposable income, improving healthcare infrastructure, government initiatives.
Ophthalmic Tonometers Market Product Innovations
Recent years have witnessed significant innovations in ophthalmic tonometers, primarily focusing on enhancing accuracy, portability, and ease of use. The introduction of non-contact and rebound tonometry technologies has revolutionized the market, improving patient comfort and reducing the need for topical anesthetics. Manufacturers are also integrating advanced features like automated readings, data management systems, and connectivity capabilities into their devices. These innovations are driving market growth and improving diagnostic outcomes for patients.
Report Segmentation & Scope
This report segments the ophthalmic tonometers market by type (direct, indirect), technology (applanation, indentation, rebound, other), portability (desktop, handheld), and end-user (hospitals, ophthalmic centers). Each segment's market size, growth projections, and competitive dynamics are analyzed in detail. For instance, the rebound tonometry segment is expected to witness significant growth due to its non-invasive nature and the avoidance of anesthetic use. The handheld segment is also projected to experience high growth due to its convenience.
Key Drivers of Ophthalmic Tonometers Market Growth
Several factors fuel the growth of the ophthalmic tonometers market. The rising prevalence of glaucoma and other eye diseases globally necessitates advanced diagnostic tools like tonometers. Technological advancements, such as the development of non-contact and rebound tonometers, improve accuracy, convenience, and patient experience. Increased healthcare spending and improvements in healthcare infrastructure, particularly in developing countries, are also driving market growth. Finally, favorable regulatory environments in many regions are facilitating market expansion.
Challenges in the Ophthalmic Tonometers Market Sector
Despite its growth potential, the ophthalmic tonometers market faces challenges. High costs associated with advanced tonometers and lack of awareness in developing countries limit market penetration. Furthermore, stringent regulatory requirements in many countries may hinder the launch of new products and increase costs for manufacturers. Finally, intense competition among established players necessitates continuous innovation and differentiation to remain competitive.
Leading Players in the Ophthalmic Tonometers Market Market
- Metall Zug Group (Haag-Streit Group)
- Oculus Inc
- Belrose Refracting Equipment
- Carl Zeiss Meditec AG
- 66 Vision Tech Co Ltd
- Kowa American Corporation
- Revenio Group PLC (iCare Finland OY)
- Topcon Corporation
- Nidek Co Ltd
- Canon Medical Systems Corporation
- Rexxam Co Ltd
- Tomey Corporation
- AMETEK Inc (Reichert Technologies)
- Halma plc (Keeler Ltd)
Key Developments in Ophthalmic Tonometers Market Sector
- May 2023: Reichert Technologies launched the Tono-Vera Tonometer with ActiView Positioning System, a rebound tonometer eliminating the need for topical anesthetic. This launch signifies a significant advancement in patient comfort and ease of use.
- November 2022: NIDEK CO., LTD launched the NT-1p Non-Contact Tono/Pachymeter, an automated device for non-contact tonometry and pachymetry, enhancing efficiency and reliability.
Strategic Ophthalmic Tonometers Market Outlook
The future of the ophthalmic tonometers market appears promising, driven by technological advancements, growing healthcare expenditure, and the increasing prevalence of eye diseases. Strategic opportunities lie in the development and adoption of innovative technologies, such as artificial intelligence (AI)-powered diagnostic tools and integration with electronic health records (EHR) systems. Expanding into emerging markets with unmet needs will also provide significant growth opportunities. Companies that focus on innovation, strategic partnerships, and effective marketing strategies are expected to thrive in this dynamic market.
Ophthalmic Tonometers Market Segmentation
-
1. Technology
- 1.1. Applanation Tonometry
- 1.2. Indentation Tonometry
- 1.3. Rebound Tonometry
- 1.4. Other Technologies
-
2. Portability Type
- 2.1. Desktop
- 2.2. Handheld
-
3. End User
- 3.1. Hospitals
- 3.2. Ophthalmic Centers
-
4. Type
- 4.1. Direct
- 4.2. Indirect
Ophthalmic Tonometers Market Segmentation By Geography
-
1. North America
- 1.1. United States
- 1.2. Canada
- 1.3. Mexico
-
2. Europe
- 2.1. Germany
- 2.2. United Kingdom
- 2.3. France
- 2.4. Italy
- 2.5. Spain
- 2.6. Rest of Europe
-
3. Asia Pacific
- 3.1. China
- 3.2. Japan
- 3.3. India
- 3.4. Australia
- 3.5. South Korea
- 3.6. Rest of Asia Pacific
-
4. Middle East and Africa
- 4.1. GCC
- 4.2. South Africa
- 4.3. Rest of Middle East and Africa
-
5. South America
- 5.1. Brazil
- 5.2. Argentina
- 5.3. Rest of South America
Ophthalmic Tonometers Market REPORT HIGHLIGHTS
| Aspects | Details |
|---|---|
| Study Period | 2019-2033 |
| Base Year | 2024 |
| Estimated Year | 2025 |
| Forecast Period | 2025-2033 |
| Historical Period | 2019-2024 |
| Growth Rate | CAGR of 5.05% from 2019-2033 |
| Segmentation |
|
Table of Contents
- 1. Introduction
- 1.1. Research Scope
- 1.2. Market Segmentation
- 1.3. Research Methodology
- 1.4. Definitions and Assumptions
- 2. Executive Summary
- 2.1. Introduction
- 3. Market Dynamics
- 3.1. Introduction
- 3.2. Market Drivers
- 3.2.1. Increasing Incidence of Glaucoma; Increasing Geriatric and Diabetic Populations; Increasing Number of Eye Checkup Camps and Glaucoma Awareness Programs
- 3.3. Market Restrains
- 3.3.1. Risk of Infection with Contact Tonometers and Lack of Accuracy in Non-contact Tonometers
- 3.4. Market Trends
- 3.4.1. Applanation Tonometry Segment is Expected to Hold a Significant Share in the Market Over the Forecast Period
- 4. Market Factor Analysis
- 4.1. Porters Five Forces
- 4.2. Supply/Value Chain
- 4.3. PESTEL analysis
- 4.4. Market Entropy
- 4.5. Patent/Trademark Analysis
- 5. Global Ophthalmic Tonometers Market Analysis, Insights and Forecast, 2019-2031
- 5.1. Market Analysis, Insights and Forecast - by Technology
- 5.1.1. Applanation Tonometry
- 5.1.2. Indentation Tonometry
- 5.1.3. Rebound Tonometry
- 5.1.4. Other Technologies
- 5.2. Market Analysis, Insights and Forecast - by Portability Type
- 5.2.1. Desktop
- 5.2.2. Handheld
- 5.3. Market Analysis, Insights and Forecast - by End User
- 5.3.1. Hospitals
- 5.3.2. Ophthalmic Centers
- 5.4. Market Analysis, Insights and Forecast - by Type
- 5.4.1. Direct
- 5.4.2. Indirect
- 5.5. Market Analysis, Insights and Forecast - by Region
- 5.5.1. North America
- 5.5.2. Europe
- 5.5.3. Asia Pacific
- 5.5.4. Middle East and Africa
- 5.5.5. South America
- 5.1. Market Analysis, Insights and Forecast - by Technology
- 6. North America Ophthalmic Tonometers Market Analysis, Insights and Forecast, 2019-2031
- 6.1. Market Analysis, Insights and Forecast - by Technology
- 6.1.1. Applanation Tonometry
- 6.1.2. Indentation Tonometry
- 6.1.3. Rebound Tonometry
- 6.1.4. Other Technologies
- 6.2. Market Analysis, Insights and Forecast - by Portability Type
- 6.2.1. Desktop
- 6.2.2. Handheld
- 6.3. Market Analysis, Insights and Forecast - by End User
- 6.3.1. Hospitals
- 6.3.2. Ophthalmic Centers
- 6.4. Market Analysis, Insights and Forecast - by Type
- 6.4.1. Direct
- 6.4.2. Indirect
- 6.1. Market Analysis, Insights and Forecast - by Technology
- 7. Europe Ophthalmic Tonometers Market Analysis, Insights and Forecast, 2019-2031
- 7.1. Market Analysis, Insights and Forecast - by Technology
- 7.1.1. Applanation Tonometry
- 7.1.2. Indentation Tonometry
- 7.1.3. Rebound Tonometry
- 7.1.4. Other Technologies
- 7.2. Market Analysis, Insights and Forecast - by Portability Type
- 7.2.1. Desktop
- 7.2.2. Handheld
- 7.3. Market Analysis, Insights and Forecast - by End User
- 7.3.1. Hospitals
- 7.3.2. Ophthalmic Centers
- 7.4. Market Analysis, Insights and Forecast - by Type
- 7.4.1. Direct
- 7.4.2. Indirect
- 7.1. Market Analysis, Insights and Forecast - by Technology
- 8. Asia Pacific Ophthalmic Tonometers Market Analysis, Insights and Forecast, 2019-2031
- 8.1. Market Analysis, Insights and Forecast - by Technology
- 8.1.1. Applanation Tonometry
- 8.1.2. Indentation Tonometry
- 8.1.3. Rebound Tonometry
- 8.1.4. Other Technologies
- 8.2. Market Analysis, Insights and Forecast - by Portability Type
- 8.2.1. Desktop
- 8.2.2. Handheld
- 8.3. Market Analysis, Insights and Forecast - by End User
- 8.3.1. Hospitals
- 8.3.2. Ophthalmic Centers
- 8.4. Market Analysis, Insights and Forecast - by Type
- 8.4.1. Direct
- 8.4.2. Indirect
- 8.1. Market Analysis, Insights and Forecast - by Technology
- 9. Middle East and Africa Ophthalmic Tonometers Market Analysis, Insights and Forecast, 2019-2031
- 9.1. Market Analysis, Insights and Forecast - by Technology
- 9.1.1. Applanation Tonometry
- 9.1.2. Indentation Tonometry
- 9.1.3. Rebound Tonometry
- 9.1.4. Other Technologies
- 9.2. Market Analysis, Insights and Forecast - by Portability Type
- 9.2.1. Desktop
- 9.2.2. Handheld
- 9.3. Market Analysis, Insights and Forecast - by End User
- 9.3.1. Hospitals
- 9.3.2. Ophthalmic Centers
- 9.4. Market Analysis, Insights and Forecast - by Type
- 9.4.1. Direct
- 9.4.2. Indirect
- 9.1. Market Analysis, Insights and Forecast - by Technology
- 10. South America Ophthalmic Tonometers Market Analysis, Insights and Forecast, 2019-2031
- 10.1. Market Analysis, Insights and Forecast - by Technology
- 10.1.1. Applanation Tonometry
- 10.1.2. Indentation Tonometry
- 10.1.3. Rebound Tonometry
- 10.1.4. Other Technologies
- 10.2. Market Analysis, Insights and Forecast - by Portability Type
- 10.2.1. Desktop
- 10.2.2. Handheld
- 10.3. Market Analysis, Insights and Forecast - by End User
- 10.3.1. Hospitals
- 10.3.2. Ophthalmic Centers
- 10.4. Market Analysis, Insights and Forecast - by Type
- 10.4.1. Direct
- 10.4.2. Indirect
- 10.1. Market Analysis, Insights and Forecast - by Technology
- 11. North America Ophthalmic Tonometers Market Analysis, Insights and Forecast, 2019-2031
- 11.1. Market Analysis, Insights and Forecast - By Country/Sub-region
- 11.1.1 United States
- 11.1.2 Canada
- 11.1.3 Mexico
- 12. Europe Ophthalmic Tonometers Market Analysis, Insights and Forecast, 2019-2031
- 12.1. Market Analysis, Insights and Forecast - By Country/Sub-region
- 12.1.1 Germany
- 12.1.2 United Kingdom
- 12.1.3 France
- 12.1.4 Italy
- 12.1.5 Spain
- 12.1.6 Rest of Europe
- 13. Asia Pacific Ophthalmic Tonometers Market Analysis, Insights and Forecast, 2019-2031
- 13.1. Market Analysis, Insights and Forecast - By Country/Sub-region
- 13.1.1 China
- 13.1.2 Japan
- 13.1.3 India
- 13.1.4 Australia
- 13.1.5 South Korea
- 13.1.6 Rest of Asia Pacific
- 14. Middle East and Africa Ophthalmic Tonometers Market Analysis, Insights and Forecast, 2019-2031
- 14.1. Market Analysis, Insights and Forecast - By Country/Sub-region
- 14.1.1 GCC
- 14.1.2 South Africa
- 14.1.3 Rest of Middle East and Africa
- 15. South America Ophthalmic Tonometers Market Analysis, Insights and Forecast, 2019-2031
- 15.1. Market Analysis, Insights and Forecast - By Country/Sub-region
- 15.1.1 Brazil
- 15.1.2 Argentina
- 15.1.3 Rest of South America
- 16. Competitive Analysis
- 16.1. Global Market Share Analysis 2024
- 16.2. Company Profiles
- 16.2.1 Metall Zug Group (Haag-Streit Group)
- 16.2.1.1. Overview
- 16.2.1.2. Products
- 16.2.1.3. SWOT Analysis
- 16.2.1.4. Recent Developments
- 16.2.1.5. Financials (Based on Availability)
- 16.2.2 Oculus Inc
- 16.2.2.1. Overview
- 16.2.2.2. Products
- 16.2.2.3. SWOT Analysis
- 16.2.2.4. Recent Developments
- 16.2.2.5. Financials (Based on Availability)
- 16.2.3 Belrose Refracting Equipment
- 16.2.3.1. Overview
- 16.2.3.2. Products
- 16.2.3.3. SWOT Analysis
- 16.2.3.4. Recent Developments
- 16.2.3.5. Financials (Based on Availability)
- 16.2.4 Carl Zeiss Meditec AG
- 16.2.4.1. Overview
- 16.2.4.2. Products
- 16.2.4.3. SWOT Analysis
- 16.2.4.4. Recent Developments
- 16.2.4.5. Financials (Based on Availability)
- 16.2.5 66 Vision Tech Co Ltd
- 16.2.5.1. Overview
- 16.2.5.2. Products
- 16.2.5.3. SWOT Analysis
- 16.2.5.4. Recent Developments
- 16.2.5.5. Financials (Based on Availability)
- 16.2.6 Kowa American Corporation
- 16.2.6.1. Overview
- 16.2.6.2. Products
- 16.2.6.3. SWOT Analysis
- 16.2.6.4. Recent Developments
- 16.2.6.5. Financials (Based on Availability)
- 16.2.7 Revenio Group PLC (iCare Finland OY)
- 16.2.7.1. Overview
- 16.2.7.2. Products
- 16.2.7.3. SWOT Analysis
- 16.2.7.4. Recent Developments
- 16.2.7.5. Financials (Based on Availability)
- 16.2.8 Topcon Corporation*List Not Exhaustive
- 16.2.8.1. Overview
- 16.2.8.2. Products
- 16.2.8.3. SWOT Analysis
- 16.2.8.4. Recent Developments
- 16.2.8.5. Financials (Based on Availability)
- 16.2.9 Nidek Co Ltd
- 16.2.9.1. Overview
- 16.2.9.2. Products
- 16.2.9.3. SWOT Analysis
- 16.2.9.4. Recent Developments
- 16.2.9.5. Financials (Based on Availability)
- 16.2.10 Canon Medical Systems Corporation
- 16.2.10.1. Overview
- 16.2.10.2. Products
- 16.2.10.3. SWOT Analysis
- 16.2.10.4. Recent Developments
- 16.2.10.5. Financials (Based on Availability)
- 16.2.11 Rexxam Co Ltd
- 16.2.11.1. Overview
- 16.2.11.2. Products
- 16.2.11.3. SWOT Analysis
- 16.2.11.4. Recent Developments
- 16.2.11.5. Financials (Based on Availability)
- 16.2.12 Tomey Corporation
- 16.2.12.1. Overview
- 16.2.12.2. Products
- 16.2.12.3. SWOT Analysis
- 16.2.12.4. Recent Developments
- 16.2.12.5. Financials (Based on Availability)
- 16.2.13 AMETEK Inc (Reichert Technologies)
- 16.2.13.1. Overview
- 16.2.13.2. Products
- 16.2.13.3. SWOT Analysis
- 16.2.13.4. Recent Developments
- 16.2.13.5. Financials (Based on Availability)
- 16.2.14 Halma plc (Keeler Ltd )
- 16.2.14.1. Overview
- 16.2.14.2. Products
- 16.2.14.3. SWOT Analysis
- 16.2.14.4. Recent Developments
- 16.2.14.5. Financials (Based on Availability)
- 16.2.1 Metall Zug Group (Haag-Streit Group)
List of Figures
- Figure 1: Global Ophthalmic Tonometers Market Revenue Breakdown (Million, %) by Region 2024 & 2032
- Figure 2: North America Ophthalmic Tonometers Market Revenue (Million), by Country 2024 & 2032
- Figure 3: North America Ophthalmic Tonometers Market Revenue Share (%), by Country 2024 & 2032
- Figure 4: Europe Ophthalmic Tonometers Market Revenue (Million), by Country 2024 & 2032
- Figure 5: Europe Ophthalmic Tonometers Market Revenue Share (%), by Country 2024 & 2032
- Figure 6: Asia Pacific Ophthalmic Tonometers Market Revenue (Million), by Country 2024 & 2032
- Figure 7: Asia Pacific Ophthalmic Tonometers Market Revenue Share (%), by Country 2024 & 2032
- Figure 8: Middle East and Africa Ophthalmic Tonometers Market Revenue (Million), by Country 2024 & 2032
- Figure 9: Middle East and Africa Ophthalmic Tonometers Market Revenue Share (%), by Country 2024 & 2032
- Figure 10: South America Ophthalmic Tonometers Market Revenue (Million), by Country 2024 & 2032
- Figure 11: South America Ophthalmic Tonometers Market Revenue Share (%), by Country 2024 & 2032
- Figure 12: North America Ophthalmic Tonometers Market Revenue (Million), by Technology 2024 & 2032
- Figure 13: North America Ophthalmic Tonometers Market Revenue Share (%), by Technology 2024 & 2032
- Figure 14: North America Ophthalmic Tonometers Market Revenue (Million), by Portability Type 2024 & 2032
- Figure 15: North America Ophthalmic Tonometers Market Revenue Share (%), by Portability Type 2024 & 2032
- Figure 16: North America Ophthalmic Tonometers Market Revenue (Million), by End User 2024 & 2032
- Figure 17: North America Ophthalmic Tonometers Market Revenue Share (%), by End User 2024 & 2032
- Figure 18: North America Ophthalmic Tonometers Market Revenue (Million), by Type 2024 & 2032
- Figure 19: North America Ophthalmic Tonometers Market Revenue Share (%), by Type 2024 & 2032
- Figure 20: North America Ophthalmic Tonometers Market Revenue (Million), by Country 2024 & 2032
- Figure 21: North America Ophthalmic Tonometers Market Revenue Share (%), by Country 2024 & 2032
- Figure 22: Europe Ophthalmic Tonometers Market Revenue (Million), by Technology 2024 & 2032
- Figure 23: Europe Ophthalmic Tonometers Market Revenue Share (%), by Technology 2024 & 2032
- Figure 24: Europe Ophthalmic Tonometers Market Revenue (Million), by Portability Type 2024 & 2032
- Figure 25: Europe Ophthalmic Tonometers Market Revenue Share (%), by Portability Type 2024 & 2032
- Figure 26: Europe Ophthalmic Tonometers Market Revenue (Million), by End User 2024 & 2032
- Figure 27: Europe Ophthalmic Tonometers Market Revenue Share (%), by End User 2024 & 2032
- Figure 28: Europe Ophthalmic Tonometers Market Revenue (Million), by Type 2024 & 2032
- Figure 29: Europe Ophthalmic Tonometers Market Revenue Share (%), by Type 2024 & 2032
- Figure 30: Europe Ophthalmic Tonometers Market Revenue (Million), by Country 2024 & 2032
- Figure 31: Europe Ophthalmic Tonometers Market Revenue Share (%), by Country 2024 & 2032
- Figure 32: Asia Pacific Ophthalmic Tonometers Market Revenue (Million), by Technology 2024 & 2032
- Figure 33: Asia Pacific Ophthalmic Tonometers Market Revenue Share (%), by Technology 2024 & 2032
- Figure 34: Asia Pacific Ophthalmic Tonometers Market Revenue (Million), by Portability Type 2024 & 2032
- Figure 35: Asia Pacific Ophthalmic Tonometers Market Revenue Share (%), by Portability Type 2024 & 2032
- Figure 36: Asia Pacific Ophthalmic Tonometers Market Revenue (Million), by End User 2024 & 2032
- Figure 37: Asia Pacific Ophthalmic Tonometers Market Revenue Share (%), by End User 2024 & 2032
- Figure 38: Asia Pacific Ophthalmic Tonometers Market Revenue (Million), by Type 2024 & 2032
- Figure 39: Asia Pacific Ophthalmic Tonometers Market Revenue Share (%), by Type 2024 & 2032
- Figure 40: Asia Pacific Ophthalmic Tonometers Market Revenue (Million), by Country 2024 & 2032
- Figure 41: Asia Pacific Ophthalmic Tonometers Market Revenue Share (%), by Country 2024 & 2032
- Figure 42: Middle East and Africa Ophthalmic Tonometers Market Revenue (Million), by Technology 2024 & 2032
- Figure 43: Middle East and Africa Ophthalmic Tonometers Market Revenue Share (%), by Technology 2024 & 2032
- Figure 44: Middle East and Africa Ophthalmic Tonometers Market Revenue (Million), by Portability Type 2024 & 2032
- Figure 45: Middle East and Africa Ophthalmic Tonometers Market Revenue Share (%), by Portability Type 2024 & 2032
- Figure 46: Middle East and Africa Ophthalmic Tonometers Market Revenue (Million), by End User 2024 & 2032
- Figure 47: Middle East and Africa Ophthalmic Tonometers Market Revenue Share (%), by End User 2024 & 2032
- Figure 48: Middle East and Africa Ophthalmic Tonometers Market Revenue (Million), by Type 2024 & 2032
- Figure 49: Middle East and Africa Ophthalmic Tonometers Market Revenue Share (%), by Type 2024 & 2032
- Figure 50: Middle East and Africa Ophthalmic Tonometers Market Revenue (Million), by Country 2024 & 2032
- Figure 51: Middle East and Africa Ophthalmic Tonometers Market Revenue Share (%), by Country 2024 & 2032
- Figure 52: South America Ophthalmic Tonometers Market Revenue (Million), by Technology 2024 & 2032
- Figure 53: South America Ophthalmic Tonometers Market Revenue Share (%), by Technology 2024 & 2032
- Figure 54: South America Ophthalmic Tonometers Market Revenue (Million), by Portability Type 2024 & 2032
- Figure 55: South America Ophthalmic Tonometers Market Revenue Share (%), by Portability Type 2024 & 2032
- Figure 56: South America Ophthalmic Tonometers Market Revenue (Million), by End User 2024 & 2032
- Figure 57: South America Ophthalmic Tonometers Market Revenue Share (%), by End User 2024 & 2032
- Figure 58: South America Ophthalmic Tonometers Market Revenue (Million), by Type 2024 & 2032
- Figure 59: South America Ophthalmic Tonometers Market Revenue Share (%), by Type 2024 & 2032
- Figure 60: South America Ophthalmic Tonometers Market Revenue (Million), by Country 2024 & 2032
- Figure 61: South America Ophthalmic Tonometers Market Revenue Share (%), by Country 2024 & 2032
List of Tables
- Table 1: Global Ophthalmic Tonometers Market Revenue Million Forecast, by Region 2019 & 2032
- Table 2: Global Ophthalmic Tonometers Market Revenue Million Forecast, by Technology 2019 & 2032
- Table 3: Global Ophthalmic Tonometers Market Revenue Million Forecast, by Portability Type 2019 & 2032
- Table 4: Global Ophthalmic Tonometers Market Revenue Million Forecast, by End User 2019 & 2032
- Table 5: Global Ophthalmic Tonometers Market Revenue Million Forecast, by Type 2019 & 2032
- Table 6: Global Ophthalmic Tonometers Market Revenue Million Forecast, by Region 2019 & 2032
- Table 7: Global Ophthalmic Tonometers Market Revenue Million Forecast, by Country 2019 & 2032
- Table 8: United States Ophthalmic Tonometers Market Revenue (Million) Forecast, by Application 2019 & 2032
- Table 9: Canada Ophthalmic Tonometers Market Revenue (Million) Forecast, by Application 2019 & 2032
- Table 10: Mexico Ophthalmic Tonometers Market Revenue (Million) Forecast, by Application 2019 & 2032
- Table 11: Global Ophthalmic Tonometers Market Revenue Million Forecast, by Country 2019 & 2032
- Table 12: Germany Ophthalmic Tonometers Market Revenue (Million) Forecast, by Application 2019 & 2032
- Table 13: United Kingdom Ophthalmic Tonometers Market Revenue (Million) Forecast, by Application 2019 & 2032
- Table 14: France Ophthalmic Tonometers Market Revenue (Million) Forecast, by Application 2019 & 2032
- Table 15: Italy Ophthalmic Tonometers Market Revenue (Million) Forecast, by Application 2019 & 2032
- Table 16: Spain Ophthalmic Tonometers Market Revenue (Million) Forecast, by Application 2019 & 2032
- Table 17: Rest of Europe Ophthalmic Tonometers Market Revenue (Million) Forecast, by Application 2019 & 2032
- Table 18: Global Ophthalmic Tonometers Market Revenue Million Forecast, by Country 2019 & 2032
- Table 19: China Ophthalmic Tonometers Market Revenue (Million) Forecast, by Application 2019 & 2032
- Table 20: Japan Ophthalmic Tonometers Market Revenue (Million) Forecast, by Application 2019 & 2032
- Table 21: India Ophthalmic Tonometers Market Revenue (Million) Forecast, by Application 2019 & 2032
- Table 22: Australia Ophthalmic Tonometers Market Revenue (Million) Forecast, by Application 2019 & 2032
- Table 23: South Korea Ophthalmic Tonometers Market Revenue (Million) Forecast, by Application 2019 & 2032
- Table 24: Rest of Asia Pacific Ophthalmic Tonometers Market Revenue (Million) Forecast, by Application 2019 & 2032
- Table 25: Global Ophthalmic Tonometers Market Revenue Million Forecast, by Country 2019 & 2032
- Table 26: GCC Ophthalmic Tonometers Market Revenue (Million) Forecast, by Application 2019 & 2032
- Table 27: South Africa Ophthalmic Tonometers Market Revenue (Million) Forecast, by Application 2019 & 2032
- Table 28: Rest of Middle East and Africa Ophthalmic Tonometers Market Revenue (Million) Forecast, by Application 2019 & 2032
- Table 29: Global Ophthalmic Tonometers Market Revenue Million Forecast, by Country 2019 & 2032
- Table 30: Brazil Ophthalmic Tonometers Market Revenue (Million) Forecast, by Application 2019 & 2032
- Table 31: Argentina Ophthalmic Tonometers Market Revenue (Million) Forecast, by Application 2019 & 2032
- Table 32: Rest of South America Ophthalmic Tonometers Market Revenue (Million) Forecast, by Application 2019 & 2032
- Table 33: Global Ophthalmic Tonometers Market Revenue Million Forecast, by Technology 2019 & 2032
- Table 34: Global Ophthalmic Tonometers Market Revenue Million Forecast, by Portability Type 2019 & 2032
- Table 35: Global Ophthalmic Tonometers Market Revenue Million Forecast, by End User 2019 & 2032
- Table 36: Global Ophthalmic Tonometers Market Revenue Million Forecast, by Type 2019 & 2032
- Table 37: Global Ophthalmic Tonometers Market Revenue Million Forecast, by Country 2019 & 2032
- Table 38: United States Ophthalmic Tonometers Market Revenue (Million) Forecast, by Application 2019 & 2032
- Table 39: Canada Ophthalmic Tonometers Market Revenue (Million) Forecast, by Application 2019 & 2032
- Table 40: Mexico Ophthalmic Tonometers Market Revenue (Million) Forecast, by Application 2019 & 2032
- Table 41: Global Ophthalmic Tonometers Market Revenue Million Forecast, by Technology 2019 & 2032
- Table 42: Global Ophthalmic Tonometers Market Revenue Million Forecast, by Portability Type 2019 & 2032
- Table 43: Global Ophthalmic Tonometers Market Revenue Million Forecast, by End User 2019 & 2032
- Table 44: Global Ophthalmic Tonometers Market Revenue Million Forecast, by Type 2019 & 2032
- Table 45: Global Ophthalmic Tonometers Market Revenue Million Forecast, by Country 2019 & 2032
- Table 46: Germany Ophthalmic Tonometers Market Revenue (Million) Forecast, by Application 2019 & 2032
- Table 47: United Kingdom Ophthalmic Tonometers Market Revenue (Million) Forecast, by Application 2019 & 2032
- Table 48: France Ophthalmic Tonometers Market Revenue (Million) Forecast, by Application 2019 & 2032
- Table 49: Italy Ophthalmic Tonometers Market Revenue (Million) Forecast, by Application 2019 & 2032
- Table 50: Spain Ophthalmic Tonometers Market Revenue (Million) Forecast, by Application 2019 & 2032
- Table 51: Rest of Europe Ophthalmic Tonometers Market Revenue (Million) Forecast, by Application 2019 & 2032
- Table 52: Global Ophthalmic Tonometers Market Revenue Million Forecast, by Technology 2019 & 2032
- Table 53: Global Ophthalmic Tonometers Market Revenue Million Forecast, by Portability Type 2019 & 2032
- Table 54: Global Ophthalmic Tonometers Market Revenue Million Forecast, by End User 2019 & 2032
- Table 55: Global Ophthalmic Tonometers Market Revenue Million Forecast, by Type 2019 & 2032
- Table 56: Global Ophthalmic Tonometers Market Revenue Million Forecast, by Country 2019 & 2032
- Table 57: China Ophthalmic Tonometers Market Revenue (Million) Forecast, by Application 2019 & 2032
- Table 58: Japan Ophthalmic Tonometers Market Revenue (Million) Forecast, by Application 2019 & 2032
- Table 59: India Ophthalmic Tonometers Market Revenue (Million) Forecast, by Application 2019 & 2032
- Table 60: Australia Ophthalmic Tonometers Market Revenue (Million) Forecast, by Application 2019 & 2032
- Table 61: South Korea Ophthalmic Tonometers Market Revenue (Million) Forecast, by Application 2019 & 2032
- Table 62: Rest of Asia Pacific Ophthalmic Tonometers Market Revenue (Million) Forecast, by Application 2019 & 2032
- Table 63: Global Ophthalmic Tonometers Market Revenue Million Forecast, by Technology 2019 & 2032
- Table 64: Global Ophthalmic Tonometers Market Revenue Million Forecast, by Portability Type 2019 & 2032
- Table 65: Global Ophthalmic Tonometers Market Revenue Million Forecast, by End User 2019 & 2032
- Table 66: Global Ophthalmic Tonometers Market Revenue Million Forecast, by Type 2019 & 2032
- Table 67: Global Ophthalmic Tonometers Market Revenue Million Forecast, by Country 2019 & 2032
- Table 68: GCC Ophthalmic Tonometers Market Revenue (Million) Forecast, by Application 2019 & 2032
- Table 69: South Africa Ophthalmic Tonometers Market Revenue (Million) Forecast, by Application 2019 & 2032
- Table 70: Rest of Middle East and Africa Ophthalmic Tonometers Market Revenue (Million) Forecast, by Application 2019 & 2032
- Table 71: Global Ophthalmic Tonometers Market Revenue Million Forecast, by Technology 2019 & 2032
- Table 72: Global Ophthalmic Tonometers Market Revenue Million Forecast, by Portability Type 2019 & 2032
- Table 73: Global Ophthalmic Tonometers Market Revenue Million Forecast, by End User 2019 & 2032
- Table 74: Global Ophthalmic Tonometers Market Revenue Million Forecast, by Type 2019 & 2032
- Table 75: Global Ophthalmic Tonometers Market Revenue Million Forecast, by Country 2019 & 2032
- Table 76: Brazil Ophthalmic Tonometers Market Revenue (Million) Forecast, by Application 2019 & 2032
- Table 77: Argentina Ophthalmic Tonometers Market Revenue (Million) Forecast, by Application 2019 & 2032
- Table 78: Rest of South America Ophthalmic Tonometers Market Revenue (Million) Forecast, by Application 2019 & 2032
Frequently Asked Questions
1. What is the projected Compound Annual Growth Rate (CAGR) of the Ophthalmic Tonometers Market?
The projected CAGR is approximately 5.05%.
2. Which companies are prominent players in the Ophthalmic Tonometers Market?
Key companies in the market include Metall Zug Group (Haag-Streit Group), Oculus Inc, Belrose Refracting Equipment, Carl Zeiss Meditec AG, 66 Vision Tech Co Ltd, Kowa American Corporation, Revenio Group PLC (iCare Finland OY), Topcon Corporation*List Not Exhaustive, Nidek Co Ltd, Canon Medical Systems Corporation, Rexxam Co Ltd, Tomey Corporation, AMETEK Inc (Reichert Technologies), Halma plc (Keeler Ltd ).
3. What are the main segments of the Ophthalmic Tonometers Market?
The market segments include Technology, Portability Type, End User, Type.
4. Can you provide details about the market size?
The market size is estimated to be USD 356.56 Million as of 2022.
5. What are some drivers contributing to market growth?
Increasing Incidence of Glaucoma; Increasing Geriatric and Diabetic Populations; Increasing Number of Eye Checkup Camps and Glaucoma Awareness Programs.
6. What are the notable trends driving market growth?
Applanation Tonometry Segment is Expected to Hold a Significant Share in the Market Over the Forecast Period.
7. Are there any restraints impacting market growth?
Risk of Infection with Contact Tonometers and Lack of Accuracy in Non-contact Tonometers.
8. Can you provide examples of recent developments in the market?
May 2023: Reichert Technologies launched the Tono-Vera Tonometer with ActiView Positioning System. Tono-Vera utilizes rebound tonometer technology, which eliminates the need for topical anesthetic.
9. What pricing options are available for accessing the report?
Pricing options include single-user, multi-user, and enterprise licenses priced at USD 4750, USD 5250, and USD 8750 respectively.
10. Is the market size provided in terms of value or volume?
The market size is provided in terms of value, measured in Million.
11. Are there any specific market keywords associated with the report?
Yes, the market keyword associated with the report is "Ophthalmic Tonometers Market," which aids in identifying and referencing the specific market segment covered.
12. How do I determine which pricing option suits my needs best?
The pricing options vary based on user requirements and access needs. Individual users may opt for single-user licenses, while businesses requiring broader access may choose multi-user or enterprise licenses for cost-effective access to the report.
13. Are there any additional resources or data provided in the Ophthalmic Tonometers Market report?
While the report offers comprehensive insights, it's advisable to review the specific contents or supplementary materials provided to ascertain if additional resources or data are available.
14. How can I stay updated on further developments or reports in the Ophthalmic Tonometers Market?
To stay informed about further developments, trends, and reports in the Ophthalmic Tonometers Market, consider subscribing to industry newsletters, following relevant companies and organizations, or regularly checking reputable industry news sources and publications.
Methodology
Step 1 - Identification of Relevant Samples Size from Population Database


Step 2 - Approaches for Defining Global Market Size (Value, Volume* & Price*)

Note*: In applicable scenarios
Step 3 - Data Sources
Primary Research
- Web Analytics
- Survey Reports
- Research Institute
- Latest Research Reports
- Opinion Leaders
Secondary Research
- Annual Reports
- White Paper
- Latest Press Release
- Industry Association
- Paid Database
- Investor Presentations

Step 4 - Data Triangulation
Involves using different sources of information in order to increase the validity of a study
These sources are likely to be stakeholders in a program - participants, other researchers, program staff, other community members, and so on.
Then we put all data in single framework & apply various statistical tools to find out the dynamic on the market.
During the analysis stage, feedback from the stakeholder groups would be compared to determine areas of agreement as well as areas of divergence


