


Key Insights
The Normal Pressure Sintered Boron Carbide market is projected for substantial growth, anticipated to reach 260.6 million by 2025, with a Compound Annual Growth Rate (CAGR) of 3.8% from 2025. This expansion is driven by escalating demand for high-performance materials in defense, aerospace, and industrial manufacturing. Boron carbide's superior hardness, wear resistance, and low density make it essential for applications including abrasives, wear components, and ballistic protection. The increasing adoption of advanced ceramics for enhanced durability and efficiency also fuels market growth. Advancements in sintering technologies, such as normal pressure sintering, are improving product quality and cost-effectiveness, broadening market appeal.

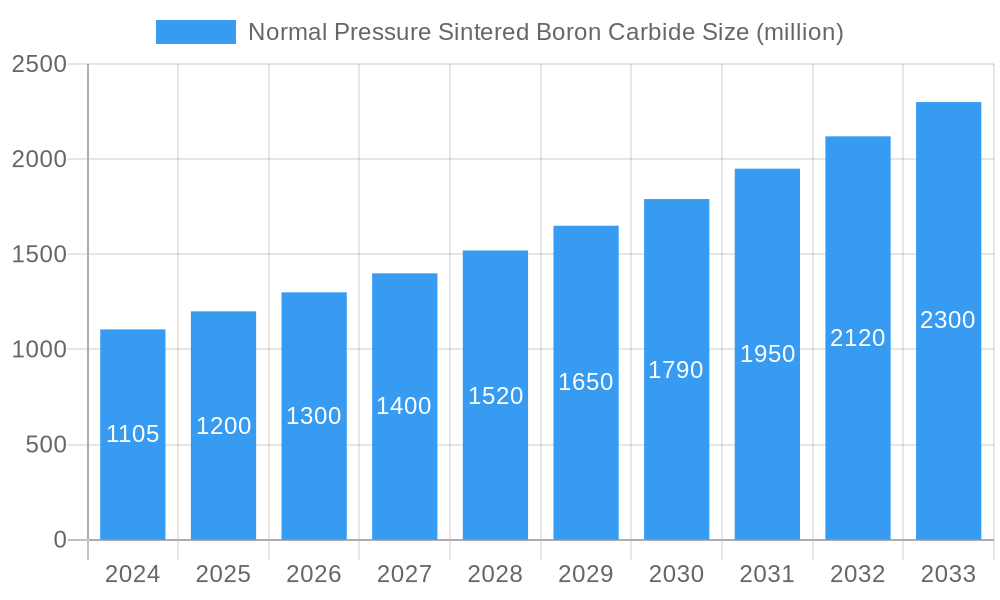
Normal Pressure Sintered Boron Carbide Market Size (In Million)

The market is shaped by technological progress and evolving application requirements. Key growth factors include increased global defense spending for advanced armor and the aerospace industry's demand for lighter, more robust components. The expanding use of boron carbide in specialized industrial applications like high-pressure seals, nozzles, and cutting tools, where extreme wear resistance is critical, presents significant opportunities. Potential restraints include raw material costs and specialized manufacturing processes, though ongoing R&D aims to optimize production and explore new applications. Leading companies are investing in research and expanding production to meet global demand.
Normal Pressure Sintered Boron Carbide Company Market Share
Market Research Report: Normal Pressure Sintered Boron Carbide - Size, Trends, and Forecast.
Normal Pressure Sintered Boron Carbide Market Structure & Competitive Dynamics
This comprehensive report delves into the intricate market structure of Normal Pressure Sintered Boron Carbide (NPSBC), offering a detailed analysis of market concentration and the innovation ecosystems driving advancement. We examine the influence of evolving regulatory frameworks, the constant threat of product substitutes, and the crucial end-user trends shaping demand. M&A activities are meticulously reviewed, including market share estimations and the valuation of key deals, providing insights into strategic consolidations and expansionary moves by major players like Mino Ceramic, Schunk, CoorsTek, Advanced Ceramic Materials, Edgetech Industries, Sintx, Saint-Gobain, Fiven, and Höganäs. Understanding these dynamics is paramount for stakeholders aiming to navigate the competitive landscape and capitalize on emerging opportunities within the advanced ceramics sector. The study encompasses the period from 2019 to 2033, with a base year of 2025, and provides a granular view of the market's competitive heartbeat.
Normal Pressure Sintered Boron Carbide Industry Trends & Insights
The Normal Pressure Sintered Boron Carbide industry is poised for significant expansion, driven by a confluence of technological advancements and increasing demand across diverse applications. Our extensive research, spanning the study period of 2019–2033 with a base year of 2025, forecasts a Compound Annual Growth Rate (CAGR) of xx% for the global NPSBC market. This robust growth is fueled by the material's exceptional hardness, high stiffness, and excellent thermal and chemical resistance, making it indispensable in high-performance sectors. Technological disruptions, such as advancements in sintering processes and enhanced material purity, are unlocking new application frontiers, leading to increased market penetration. Consumer preferences are increasingly leaning towards lightweight, durable, and high-strength materials, directly benefiting NPSBC adoption. Competitive dynamics are characterized by continuous innovation and strategic partnerships among key industry participants. The report provides deep dives into consumer preferences, shedding light on specific requirements that are driving product development. Market penetration is analyzed by key applications, highlighting the increasing reliance on NPSBC for its superior properties. The analysis of consumer preferences is critical for manufacturers seeking to align their product offerings with market demands, thereby maximizing their competitive advantage. The overall industry outlook is exceptionally positive, reflecting the material's growing importance in critical industrial applications.
Dominant Markets & Segments in Normal Pressure Sintered Boron Carbide
The Normal Pressure Sintered Boron Carbide market exhibits distinct regional dominance and segment leadership, crucial for strategic market entry and expansion. North America currently leads in market share, driven by robust defense spending, extensive industrial manufacturing, and significant investments in advanced materials research. Within North America, the United States plays a pivotal role, supported by favorable government policies, strong infrastructure development, and a high concentration of key end-users. In terms of applications, the Wear Parts segment is experiencing the most substantial growth, projected to reach an estimated market value of $XXX million by 2033. This surge is attributed to the increasing demand for components that can withstand extreme abrasion and erosion in mining, oil and gas, and heavy machinery industries. The Grinding Material segment follows closely, driven by the need for highly efficient and durable abrasive solutions in manufacturing and material processing.
Key drivers for segment dominance include:
- Wear Parts: Growing adoption in industries demanding extended component lifespan and reduced maintenance costs.
- Grinding Material: Advancements in precision engineering and the need for superior grinding efficiency.
- Plate Armour: Increasing defense budgets and the demand for lightweight, high-performance ballistic protection solutions.
- Others: Emerging applications in aerospace, electronics, and specialized industrial equipment.
In terms of product types, Boron Carbide Ceramic Precision Parts are gaining significant traction, valued for their exceptional dimensional stability and intricate design capabilities, essential for high-tech applications. The market for Boron Carbide Ceramic Blocks remains strong, serving foundational needs in various industrial processes. The economic policies favoring advanced manufacturing and the continuous push for technological innovation are further solidifying the dominance of these segments, creating substantial opportunities for market players.
Normal Pressure Sintered Boron Carbide Product Innovations
Product innovations in Normal Pressure Sintered Boron Carbide are primarily focused on enhancing material properties and expanding application ranges. Recent developments include improved sintering techniques that yield higher density and purity, leading to superior mechanical strength and wear resistance. These advancements are enabling the creation of more complex Boron Carbide Ceramic Precision Parts for critical applications in aerospace and semiconductor manufacturing. Furthermore, research is ongoing to develop novel composite materials incorporating boron carbide for specialized Plate Armour solutions, offering enhanced ballistic performance with reduced weight. These innovations are crucial for maintaining competitive advantage and capturing market share in a rapidly evolving industry.
Report Segmentation & Scope
This report meticulously segments the Normal Pressure Sintered Boron Carbide market by application and product type, providing granular insights into each niche. The market is analyzed across the following key application segments: Grinding Material, Wear Parts, Plate Armour, and Others. Each segment's projected market size, growth rate, and competitive dynamics are detailed. The report further breaks down the market by product types: Boron Carbide Ceramic Block and Boron Carbide Ceramic Precision Parts. Detailed growth projections and competitive landscapes are provided for each product type, offering stakeholders a clear understanding of specific market opportunities and challenges. The scope covers the historical period of 2019–2024 and the forecast period up to 2033, with a detailed analysis of the base year 2025.
Key Drivers of Normal Pressure Sintered Boron Carbide Growth
Several key factors are propelling the growth of the Normal Pressure Sintered Boron Carbide market. Technologically, advancements in sintering processes are yielding higher purity and improved mechanical properties, making NPSBC suitable for increasingly demanding applications. Economically, the global focus on high-performance materials in sectors like defense, automotive, and industrial manufacturing directly boosts demand. Regulatory factors, such as stringent quality standards for advanced materials in critical applications, also favor the adoption of well-characterized materials like NPSBC. For instance, the demand for lightweight yet extremely durable armor for military vehicles, driven by government procurement policies, is a significant growth accelerator.
Challenges in the Normal Pressure Sintered Boron Carbide Sector
Despite its impressive growth, the Normal Pressure Sintered Boron Carbide sector faces certain challenges. High production costs associated with specialized sintering processes and the need for precise quality control can be a barrier to entry for new players. Supply chain complexities for raw materials, particularly high-purity boron and carbon precursors, can also impact availability and pricing. Furthermore, intense competition from alternative advanced ceramic materials and even composite solutions necessitates continuous innovation and cost optimization to maintain market share. Stringent environmental regulations concerning material processing can also pose compliance challenges.
Leading Players in the Normal Pressure Sintered Boron Carbide Market
The Normal Pressure Sintered Boron Carbide market is characterized by the presence of several leading global manufacturers and suppliers, including:
- Mino Ceramic
- Schunk
- CoorsTek
- Advanced Ceramic Materials
- Edgetech Industries
- Sintx
- Saint-Gobain
- Fiven
- Höganäs
These companies are at the forefront of innovation and market development within the advanced ceramics industry.
Key Developments in Normal Pressure Sintered Boron Carbide Sector
- 2023: Mino Ceramic launches new grades of NPSBC with enhanced thermal shock resistance, expanding its use in high-temperature industrial applications.
- 2023: Schunk announces a significant investment in R&D to develop novel NPSBC composite materials for aerospace.
- 2024: CoorsTek acquires a smaller competitor, strengthening its market position in wear-resistant components.
- 2024: Advanced Ceramic Materials introduces a new line of precision-machined NPSBC parts for the semiconductor industry, demonstrating improved surface finish.
- 2024: Sintx reports successful trials of NPSBC in next-generation ballistic protection systems.
These developments highlight a dynamic market focused on technological advancement and strategic growth.
Strategic Normal Pressure Sintered Boron Carbide Market Outlook
The strategic outlook for the Normal Pressure Sintered Boron Carbide market remains exceptionally positive, driven by ongoing technological advancements and expanding application horizons. Growth accelerators include the increasing demand for lightweight, high-strength materials in defense and aerospace, the relentless need for durable wear parts in industrial sectors, and emerging applications in advanced manufacturing and energy. Strategic opportunities lie in the development of customized NPSBC solutions for niche markets and the optimization of production processes to enhance cost-effectiveness. Collaborations between material manufacturers and end-users will be crucial for driving innovation and market penetration in the coming years, solidifying NPSBC's position as a critical advanced material.
Normal Pressure Sintered Boron Carbide Segmentation
-
1. Application
- 1.1. Grinding Material
- 1.2. Wear Parts
- 1.3. Plate Armour
- 1.4. Others
-
2. Types
- 2.1. Boron Carbide Ceramic Block
- 2.2. Boron Carbide Ceramic Precision Parts
Normal Pressure Sintered Boron Carbide Segmentation By Geography
-
1. North America
- 1.1. United States
- 1.2. Canada
- 1.3. Mexico
-
2. South America
- 2.1. Brazil
- 2.2. Argentina
- 2.3. Rest of South America
-
3. Europe
- 3.1. United Kingdom
- 3.2. Germany
- 3.3. France
- 3.4. Italy
- 3.5. Spain
- 3.6. Russia
- 3.7. Benelux
- 3.8. Nordics
- 3.9. Rest of Europe
-
4. Middle East & Africa
- 4.1. Turkey
- 4.2. Israel
- 4.3. GCC
- 4.4. North Africa
- 4.5. South Africa
- 4.6. Rest of Middle East & Africa
-
5. Asia Pacific
- 5.1. China
- 5.2. India
- 5.3. Japan
- 5.4. South Korea
- 5.5. ASEAN
- 5.6. Oceania
- 5.7. Rest of Asia Pacific

Normal Pressure Sintered Boron Carbide Regional Market Share
Geographic Coverage of Normal Pressure Sintered Boron Carbide
Normal Pressure Sintered Boron Carbide REPORT HIGHLIGHTS
| Aspects | Details |
|---|---|
| Study Period | 2020-2034 |
| Base Year | 2025 |
| Estimated Year | 2026 |
| Forecast Period | 2026-2034 |
| Historical Period | 2020-2025 |
| Growth Rate | CAGR of 3.8% from 2020-2034 |
| Segmentation |
|
Table of Contents
- 1. Introduction
- 1.1. Research Scope
- 1.2. Market Segmentation
- 1.3. Research Methodology
- 1.4. Definitions and Assumptions
- 2. Executive Summary
- 2.1. Introduction
- 3. Market Dynamics
- 3.1. Introduction
- 3.2. Market Drivers
- 3.3. Market Restrains
- 3.4. Market Trends
- 4. Market Factor Analysis
- 4.1. Porters Five Forces
- 4.2. Supply/Value Chain
- 4.3. PESTEL analysis
- 4.4. Market Entropy
- 4.5. Patent/Trademark Analysis
- 5. Global Normal Pressure Sintered Boron Carbide Analysis, Insights and Forecast, 2020-2032
- 5.1. Market Analysis, Insights and Forecast - by Application
- 5.1.1. Grinding Material
- 5.1.2. Wear Parts
- 5.1.3. Plate Armour
- 5.1.4. Others
- 5.2. Market Analysis, Insights and Forecast - by Types
- 5.2.1. Boron Carbide Ceramic Block
- 5.2.2. Boron Carbide Ceramic Precision Parts
- 5.3. Market Analysis, Insights and Forecast - by Region
- 5.3.1. North America
- 5.3.2. South America
- 5.3.3. Europe
- 5.3.4. Middle East & Africa
- 5.3.5. Asia Pacific
- 5.1. Market Analysis, Insights and Forecast - by Application
- 6. North America Normal Pressure Sintered Boron Carbide Analysis, Insights and Forecast, 2020-2032
- 6.1. Market Analysis, Insights and Forecast - by Application
- 6.1.1. Grinding Material
- 6.1.2. Wear Parts
- 6.1.3. Plate Armour
- 6.1.4. Others
- 6.2. Market Analysis, Insights and Forecast - by Types
- 6.2.1. Boron Carbide Ceramic Block
- 6.2.2. Boron Carbide Ceramic Precision Parts
- 6.1. Market Analysis, Insights and Forecast - by Application
- 7. South America Normal Pressure Sintered Boron Carbide Analysis, Insights and Forecast, 2020-2032
- 7.1. Market Analysis, Insights and Forecast - by Application
- 7.1.1. Grinding Material
- 7.1.2. Wear Parts
- 7.1.3. Plate Armour
- 7.1.4. Others
- 7.2. Market Analysis, Insights and Forecast - by Types
- 7.2.1. Boron Carbide Ceramic Block
- 7.2.2. Boron Carbide Ceramic Precision Parts
- 7.1. Market Analysis, Insights and Forecast - by Application
- 8. Europe Normal Pressure Sintered Boron Carbide Analysis, Insights and Forecast, 2020-2032
- 8.1. Market Analysis, Insights and Forecast - by Application
- 8.1.1. Grinding Material
- 8.1.2. Wear Parts
- 8.1.3. Plate Armour
- 8.1.4. Others
- 8.2. Market Analysis, Insights and Forecast - by Types
- 8.2.1. Boron Carbide Ceramic Block
- 8.2.2. Boron Carbide Ceramic Precision Parts
- 8.1. Market Analysis, Insights and Forecast - by Application
- 9. Middle East & Africa Normal Pressure Sintered Boron Carbide Analysis, Insights and Forecast, 2020-2032
- 9.1. Market Analysis, Insights and Forecast - by Application
- 9.1.1. Grinding Material
- 9.1.2. Wear Parts
- 9.1.3. Plate Armour
- 9.1.4. Others
- 9.2. Market Analysis, Insights and Forecast - by Types
- 9.2.1. Boron Carbide Ceramic Block
- 9.2.2. Boron Carbide Ceramic Precision Parts
- 9.1. Market Analysis, Insights and Forecast - by Application
- 10. Asia Pacific Normal Pressure Sintered Boron Carbide Analysis, Insights and Forecast, 2020-2032
- 10.1. Market Analysis, Insights and Forecast - by Application
- 10.1.1. Grinding Material
- 10.1.2. Wear Parts
- 10.1.3. Plate Armour
- 10.1.4. Others
- 10.2. Market Analysis, Insights and Forecast - by Types
- 10.2.1. Boron Carbide Ceramic Block
- 10.2.2. Boron Carbide Ceramic Precision Parts
- 10.1. Market Analysis, Insights and Forecast - by Application
- 11. Competitive Analysis
- 11.1. Global Market Share Analysis 2025
- 11.2. Company Profiles
- 11.2.1 Mino Ceramic
- 11.2.1.1. Overview
- 11.2.1.2. Products
- 11.2.1.3. SWOT Analysis
- 11.2.1.4. Recent Developments
- 11.2.1.5. Financials (Based on Availability)
- 11.2.2 Schunk
- 11.2.2.1. Overview
- 11.2.2.2. Products
- 11.2.2.3. SWOT Analysis
- 11.2.2.4. Recent Developments
- 11.2.2.5. Financials (Based on Availability)
- 11.2.3 CoorsTek
- 11.2.3.1. Overview
- 11.2.3.2. Products
- 11.2.3.3. SWOT Analysis
- 11.2.3.4. Recent Developments
- 11.2.3.5. Financials (Based on Availability)
- 11.2.4 Advanced Ceramic Materials
- 11.2.4.1. Overview
- 11.2.4.2. Products
- 11.2.4.3. SWOT Analysis
- 11.2.4.4. Recent Developments
- 11.2.4.5. Financials (Based on Availability)
- 11.2.5 Edgetech Industries
- 11.2.5.1. Overview
- 11.2.5.2. Products
- 11.2.5.3. SWOT Analysis
- 11.2.5.4. Recent Developments
- 11.2.5.5. Financials (Based on Availability)
- 11.2.6 Sintx
- 11.2.6.1. Overview
- 11.2.6.2. Products
- 11.2.6.3. SWOT Analysis
- 11.2.6.4. Recent Developments
- 11.2.6.5. Financials (Based on Availability)
- 11.2.7 Saint-Gobain
- 11.2.7.1. Overview
- 11.2.7.2. Products
- 11.2.7.3. SWOT Analysis
- 11.2.7.4. Recent Developments
- 11.2.7.5. Financials (Based on Availability)
- 11.2.8 Fiven
- 11.2.8.1. Overview
- 11.2.8.2. Products
- 11.2.8.3. SWOT Analysis
- 11.2.8.4. Recent Developments
- 11.2.8.5. Financials (Based on Availability)
- 11.2.9 Höganäs
- 11.2.9.1. Overview
- 11.2.9.2. Products
- 11.2.9.3. SWOT Analysis
- 11.2.9.4. Recent Developments
- 11.2.9.5. Financials (Based on Availability)
- 11.2.1 Mino Ceramic
List of Figures
- Figure 1: Global Normal Pressure Sintered Boron Carbide Revenue Breakdown (million, %) by Region 2025 & 2033
- Figure 2: Global Normal Pressure Sintered Boron Carbide Volume Breakdown (K, %) by Region 2025 & 2033
- Figure 3: North America Normal Pressure Sintered Boron Carbide Revenue (million), by Application 2025 & 2033
- Figure 4: North America Normal Pressure Sintered Boron Carbide Volume (K), by Application 2025 & 2033
- Figure 5: North America Normal Pressure Sintered Boron Carbide Revenue Share (%), by Application 2025 & 2033
- Figure 6: North America Normal Pressure Sintered Boron Carbide Volume Share (%), by Application 2025 & 2033
- Figure 7: North America Normal Pressure Sintered Boron Carbide Revenue (million), by Types 2025 & 2033
- Figure 8: North America Normal Pressure Sintered Boron Carbide Volume (K), by Types 2025 & 2033
- Figure 9: North America Normal Pressure Sintered Boron Carbide Revenue Share (%), by Types 2025 & 2033
- Figure 10: North America Normal Pressure Sintered Boron Carbide Volume Share (%), by Types 2025 & 2033
- Figure 11: North America Normal Pressure Sintered Boron Carbide Revenue (million), by Country 2025 & 2033
- Figure 12: North America Normal Pressure Sintered Boron Carbide Volume (K), by Country 2025 & 2033
- Figure 13: North America Normal Pressure Sintered Boron Carbide Revenue Share (%), by Country 2025 & 2033
- Figure 14: North America Normal Pressure Sintered Boron Carbide Volume Share (%), by Country 2025 & 2033
- Figure 15: South America Normal Pressure Sintered Boron Carbide Revenue (million), by Application 2025 & 2033
- Figure 16: South America Normal Pressure Sintered Boron Carbide Volume (K), by Application 2025 & 2033
- Figure 17: South America Normal Pressure Sintered Boron Carbide Revenue Share (%), by Application 2025 & 2033
- Figure 18: South America Normal Pressure Sintered Boron Carbide Volume Share (%), by Application 2025 & 2033
- Figure 19: South America Normal Pressure Sintered Boron Carbide Revenue (million), by Types 2025 & 2033
- Figure 20: South America Normal Pressure Sintered Boron Carbide Volume (K), by Types 2025 & 2033
- Figure 21: South America Normal Pressure Sintered Boron Carbide Revenue Share (%), by Types 2025 & 2033
- Figure 22: South America Normal Pressure Sintered Boron Carbide Volume Share (%), by Types 2025 & 2033
- Figure 23: South America Normal Pressure Sintered Boron Carbide Revenue (million), by Country 2025 & 2033
- Figure 24: South America Normal Pressure Sintered Boron Carbide Volume (K), by Country 2025 & 2033
- Figure 25: South America Normal Pressure Sintered Boron Carbide Revenue Share (%), by Country 2025 & 2033
- Figure 26: South America Normal Pressure Sintered Boron Carbide Volume Share (%), by Country 2025 & 2033
- Figure 27: Europe Normal Pressure Sintered Boron Carbide Revenue (million), by Application 2025 & 2033
- Figure 28: Europe Normal Pressure Sintered Boron Carbide Volume (K), by Application 2025 & 2033
- Figure 29: Europe Normal Pressure Sintered Boron Carbide Revenue Share (%), by Application 2025 & 2033
- Figure 30: Europe Normal Pressure Sintered Boron Carbide Volume Share (%), by Application 2025 & 2033
- Figure 31: Europe Normal Pressure Sintered Boron Carbide Revenue (million), by Types 2025 & 2033
- Figure 32: Europe Normal Pressure Sintered Boron Carbide Volume (K), by Types 2025 & 2033
- Figure 33: Europe Normal Pressure Sintered Boron Carbide Revenue Share (%), by Types 2025 & 2033
- Figure 34: Europe Normal Pressure Sintered Boron Carbide Volume Share (%), by Types 2025 & 2033
- Figure 35: Europe Normal Pressure Sintered Boron Carbide Revenue (million), by Country 2025 & 2033
- Figure 36: Europe Normal Pressure Sintered Boron Carbide Volume (K), by Country 2025 & 2033
- Figure 37: Europe Normal Pressure Sintered Boron Carbide Revenue Share (%), by Country 2025 & 2033
- Figure 38: Europe Normal Pressure Sintered Boron Carbide Volume Share (%), by Country 2025 & 2033
- Figure 39: Middle East & Africa Normal Pressure Sintered Boron Carbide Revenue (million), by Application 2025 & 2033
- Figure 40: Middle East & Africa Normal Pressure Sintered Boron Carbide Volume (K), by Application 2025 & 2033
- Figure 41: Middle East & Africa Normal Pressure Sintered Boron Carbide Revenue Share (%), by Application 2025 & 2033
- Figure 42: Middle East & Africa Normal Pressure Sintered Boron Carbide Volume Share (%), by Application 2025 & 2033
- Figure 43: Middle East & Africa Normal Pressure Sintered Boron Carbide Revenue (million), by Types 2025 & 2033
- Figure 44: Middle East & Africa Normal Pressure Sintered Boron Carbide Volume (K), by Types 2025 & 2033
- Figure 45: Middle East & Africa Normal Pressure Sintered Boron Carbide Revenue Share (%), by Types 2025 & 2033
- Figure 46: Middle East & Africa Normal Pressure Sintered Boron Carbide Volume Share (%), by Types 2025 & 2033
- Figure 47: Middle East & Africa Normal Pressure Sintered Boron Carbide Revenue (million), by Country 2025 & 2033
- Figure 48: Middle East & Africa Normal Pressure Sintered Boron Carbide Volume (K), by Country 2025 & 2033
- Figure 49: Middle East & Africa Normal Pressure Sintered Boron Carbide Revenue Share (%), by Country 2025 & 2033
- Figure 50: Middle East & Africa Normal Pressure Sintered Boron Carbide Volume Share (%), by Country 2025 & 2033
- Figure 51: Asia Pacific Normal Pressure Sintered Boron Carbide Revenue (million), by Application 2025 & 2033
- Figure 52: Asia Pacific Normal Pressure Sintered Boron Carbide Volume (K), by Application 2025 & 2033
- Figure 53: Asia Pacific Normal Pressure Sintered Boron Carbide Revenue Share (%), by Application 2025 & 2033
- Figure 54: Asia Pacific Normal Pressure Sintered Boron Carbide Volume Share (%), by Application 2025 & 2033
- Figure 55: Asia Pacific Normal Pressure Sintered Boron Carbide Revenue (million), by Types 2025 & 2033
- Figure 56: Asia Pacific Normal Pressure Sintered Boron Carbide Volume (K), by Types 2025 & 2033
- Figure 57: Asia Pacific Normal Pressure Sintered Boron Carbide Revenue Share (%), by Types 2025 & 2033
- Figure 58: Asia Pacific Normal Pressure Sintered Boron Carbide Volume Share (%), by Types 2025 & 2033
- Figure 59: Asia Pacific Normal Pressure Sintered Boron Carbide Revenue (million), by Country 2025 & 2033
- Figure 60: Asia Pacific Normal Pressure Sintered Boron Carbide Volume (K), by Country 2025 & 2033
- Figure 61: Asia Pacific Normal Pressure Sintered Boron Carbide Revenue Share (%), by Country 2025 & 2033
- Figure 62: Asia Pacific Normal Pressure Sintered Boron Carbide Volume Share (%), by Country 2025 & 2033
List of Tables
- Table 1: Global Normal Pressure Sintered Boron Carbide Revenue million Forecast, by Application 2020 & 2033
- Table 2: Global Normal Pressure Sintered Boron Carbide Volume K Forecast, by Application 2020 & 2033
- Table 3: Global Normal Pressure Sintered Boron Carbide Revenue million Forecast, by Types 2020 & 2033
- Table 4: Global Normal Pressure Sintered Boron Carbide Volume K Forecast, by Types 2020 & 2033
- Table 5: Global Normal Pressure Sintered Boron Carbide Revenue million Forecast, by Region 2020 & 2033
- Table 6: Global Normal Pressure Sintered Boron Carbide Volume K Forecast, by Region 2020 & 2033
- Table 7: Global Normal Pressure Sintered Boron Carbide Revenue million Forecast, by Application 2020 & 2033
- Table 8: Global Normal Pressure Sintered Boron Carbide Volume K Forecast, by Application 2020 & 2033
- Table 9: Global Normal Pressure Sintered Boron Carbide Revenue million Forecast, by Types 2020 & 2033
- Table 10: Global Normal Pressure Sintered Boron Carbide Volume K Forecast, by Types 2020 & 2033
- Table 11: Global Normal Pressure Sintered Boron Carbide Revenue million Forecast, by Country 2020 & 2033
- Table 12: Global Normal Pressure Sintered Boron Carbide Volume K Forecast, by Country 2020 & 2033
- Table 13: United States Normal Pressure Sintered Boron Carbide Revenue (million) Forecast, by Application 2020 & 2033
- Table 14: United States Normal Pressure Sintered Boron Carbide Volume (K) Forecast, by Application 2020 & 2033
- Table 15: Canada Normal Pressure Sintered Boron Carbide Revenue (million) Forecast, by Application 2020 & 2033
- Table 16: Canada Normal Pressure Sintered Boron Carbide Volume (K) Forecast, by Application 2020 & 2033
- Table 17: Mexico Normal Pressure Sintered Boron Carbide Revenue (million) Forecast, by Application 2020 & 2033
- Table 18: Mexico Normal Pressure Sintered Boron Carbide Volume (K) Forecast, by Application 2020 & 2033
- Table 19: Global Normal Pressure Sintered Boron Carbide Revenue million Forecast, by Application 2020 & 2033
- Table 20: Global Normal Pressure Sintered Boron Carbide Volume K Forecast, by Application 2020 & 2033
- Table 21: Global Normal Pressure Sintered Boron Carbide Revenue million Forecast, by Types 2020 & 2033
- Table 22: Global Normal Pressure Sintered Boron Carbide Volume K Forecast, by Types 2020 & 2033
- Table 23: Global Normal Pressure Sintered Boron Carbide Revenue million Forecast, by Country 2020 & 2033
- Table 24: Global Normal Pressure Sintered Boron Carbide Volume K Forecast, by Country 2020 & 2033
- Table 25: Brazil Normal Pressure Sintered Boron Carbide Revenue (million) Forecast, by Application 2020 & 2033
- Table 26: Brazil Normal Pressure Sintered Boron Carbide Volume (K) Forecast, by Application 2020 & 2033
- Table 27: Argentina Normal Pressure Sintered Boron Carbide Revenue (million) Forecast, by Application 2020 & 2033
- Table 28: Argentina Normal Pressure Sintered Boron Carbide Volume (K) Forecast, by Application 2020 & 2033
- Table 29: Rest of South America Normal Pressure Sintered Boron Carbide Revenue (million) Forecast, by Application 2020 & 2033
- Table 30: Rest of South America Normal Pressure Sintered Boron Carbide Volume (K) Forecast, by Application 2020 & 2033
- Table 31: Global Normal Pressure Sintered Boron Carbide Revenue million Forecast, by Application 2020 & 2033
- Table 32: Global Normal Pressure Sintered Boron Carbide Volume K Forecast, by Application 2020 & 2033
- Table 33: Global Normal Pressure Sintered Boron Carbide Revenue million Forecast, by Types 2020 & 2033
- Table 34: Global Normal Pressure Sintered Boron Carbide Volume K Forecast, by Types 2020 & 2033
- Table 35: Global Normal Pressure Sintered Boron Carbide Revenue million Forecast, by Country 2020 & 2033
- Table 36: Global Normal Pressure Sintered Boron Carbide Volume K Forecast, by Country 2020 & 2033
- Table 37: United Kingdom Normal Pressure Sintered Boron Carbide Revenue (million) Forecast, by Application 2020 & 2033
- Table 38: United Kingdom Normal Pressure Sintered Boron Carbide Volume (K) Forecast, by Application 2020 & 2033
- Table 39: Germany Normal Pressure Sintered Boron Carbide Revenue (million) Forecast, by Application 2020 & 2033
- Table 40: Germany Normal Pressure Sintered Boron Carbide Volume (K) Forecast, by Application 2020 & 2033
- Table 41: France Normal Pressure Sintered Boron Carbide Revenue (million) Forecast, by Application 2020 & 2033
- Table 42: France Normal Pressure Sintered Boron Carbide Volume (K) Forecast, by Application 2020 & 2033
- Table 43: Italy Normal Pressure Sintered Boron Carbide Revenue (million) Forecast, by Application 2020 & 2033
- Table 44: Italy Normal Pressure Sintered Boron Carbide Volume (K) Forecast, by Application 2020 & 2033
- Table 45: Spain Normal Pressure Sintered Boron Carbide Revenue (million) Forecast, by Application 2020 & 2033
- Table 46: Spain Normal Pressure Sintered Boron Carbide Volume (K) Forecast, by Application 2020 & 2033
- Table 47: Russia Normal Pressure Sintered Boron Carbide Revenue (million) Forecast, by Application 2020 & 2033
- Table 48: Russia Normal Pressure Sintered Boron Carbide Volume (K) Forecast, by Application 2020 & 2033
- Table 49: Benelux Normal Pressure Sintered Boron Carbide Revenue (million) Forecast, by Application 2020 & 2033
- Table 50: Benelux Normal Pressure Sintered Boron Carbide Volume (K) Forecast, by Application 2020 & 2033
- Table 51: Nordics Normal Pressure Sintered Boron Carbide Revenue (million) Forecast, by Application 2020 & 2033
- Table 52: Nordics Normal Pressure Sintered Boron Carbide Volume (K) Forecast, by Application 2020 & 2033
- Table 53: Rest of Europe Normal Pressure Sintered Boron Carbide Revenue (million) Forecast, by Application 2020 & 2033
- Table 54: Rest of Europe Normal Pressure Sintered Boron Carbide Volume (K) Forecast, by Application 2020 & 2033
- Table 55: Global Normal Pressure Sintered Boron Carbide Revenue million Forecast, by Application 2020 & 2033
- Table 56: Global Normal Pressure Sintered Boron Carbide Volume K Forecast, by Application 2020 & 2033
- Table 57: Global Normal Pressure Sintered Boron Carbide Revenue million Forecast, by Types 2020 & 2033
- Table 58: Global Normal Pressure Sintered Boron Carbide Volume K Forecast, by Types 2020 & 2033
- Table 59: Global Normal Pressure Sintered Boron Carbide Revenue million Forecast, by Country 2020 & 2033
- Table 60: Global Normal Pressure Sintered Boron Carbide Volume K Forecast, by Country 2020 & 2033
- Table 61: Turkey Normal Pressure Sintered Boron Carbide Revenue (million) Forecast, by Application 2020 & 2033
- Table 62: Turkey Normal Pressure Sintered Boron Carbide Volume (K) Forecast, by Application 2020 & 2033
- Table 63: Israel Normal Pressure Sintered Boron Carbide Revenue (million) Forecast, by Application 2020 & 2033
- Table 64: Israel Normal Pressure Sintered Boron Carbide Volume (K) Forecast, by Application 2020 & 2033
- Table 65: GCC Normal Pressure Sintered Boron Carbide Revenue (million) Forecast, by Application 2020 & 2033
- Table 66: GCC Normal Pressure Sintered Boron Carbide Volume (K) Forecast, by Application 2020 & 2033
- Table 67: North Africa Normal Pressure Sintered Boron Carbide Revenue (million) Forecast, by Application 2020 & 2033
- Table 68: North Africa Normal Pressure Sintered Boron Carbide Volume (K) Forecast, by Application 2020 & 2033
- Table 69: South Africa Normal Pressure Sintered Boron Carbide Revenue (million) Forecast, by Application 2020 & 2033
- Table 70: South Africa Normal Pressure Sintered Boron Carbide Volume (K) Forecast, by Application 2020 & 2033
- Table 71: Rest of Middle East & Africa Normal Pressure Sintered Boron Carbide Revenue (million) Forecast, by Application 2020 & 2033
- Table 72: Rest of Middle East & Africa Normal Pressure Sintered Boron Carbide Volume (K) Forecast, by Application 2020 & 2033
- Table 73: Global Normal Pressure Sintered Boron Carbide Revenue million Forecast, by Application 2020 & 2033
- Table 74: Global Normal Pressure Sintered Boron Carbide Volume K Forecast, by Application 2020 & 2033
- Table 75: Global Normal Pressure Sintered Boron Carbide Revenue million Forecast, by Types 2020 & 2033
- Table 76: Global Normal Pressure Sintered Boron Carbide Volume K Forecast, by Types 2020 & 2033
- Table 77: Global Normal Pressure Sintered Boron Carbide Revenue million Forecast, by Country 2020 & 2033
- Table 78: Global Normal Pressure Sintered Boron Carbide Volume K Forecast, by Country 2020 & 2033
- Table 79: China Normal Pressure Sintered Boron Carbide Revenue (million) Forecast, by Application 2020 & 2033
- Table 80: China Normal Pressure Sintered Boron Carbide Volume (K) Forecast, by Application 2020 & 2033
- Table 81: India Normal Pressure Sintered Boron Carbide Revenue (million) Forecast, by Application 2020 & 2033
- Table 82: India Normal Pressure Sintered Boron Carbide Volume (K) Forecast, by Application 2020 & 2033
- Table 83: Japan Normal Pressure Sintered Boron Carbide Revenue (million) Forecast, by Application 2020 & 2033
- Table 84: Japan Normal Pressure Sintered Boron Carbide Volume (K) Forecast, by Application 2020 & 2033
- Table 85: South Korea Normal Pressure Sintered Boron Carbide Revenue (million) Forecast, by Application 2020 & 2033
- Table 86: South Korea Normal Pressure Sintered Boron Carbide Volume (K) Forecast, by Application 2020 & 2033
- Table 87: ASEAN Normal Pressure Sintered Boron Carbide Revenue (million) Forecast, by Application 2020 & 2033
- Table 88: ASEAN Normal Pressure Sintered Boron Carbide Volume (K) Forecast, by Application 2020 & 2033
- Table 89: Oceania Normal Pressure Sintered Boron Carbide Revenue (million) Forecast, by Application 2020 & 2033
- Table 90: Oceania Normal Pressure Sintered Boron Carbide Volume (K) Forecast, by Application 2020 & 2033
- Table 91: Rest of Asia Pacific Normal Pressure Sintered Boron Carbide Revenue (million) Forecast, by Application 2020 & 2033
- Table 92: Rest of Asia Pacific Normal Pressure Sintered Boron Carbide Volume (K) Forecast, by Application 2020 & 2033
Frequently Asked Questions
1. What is the projected Compound Annual Growth Rate (CAGR) of the Normal Pressure Sintered Boron Carbide?
The projected CAGR is approximately 3.8%.
2. Which companies are prominent players in the Normal Pressure Sintered Boron Carbide?
Key companies in the market include Mino Ceramic, Schunk, CoorsTek, Advanced Ceramic Materials, Edgetech Industries, Sintx, Saint-Gobain, Fiven, Höganäs.
3. What are the main segments of the Normal Pressure Sintered Boron Carbide?
The market segments include Application, Types.
4. Can you provide details about the market size?
The market size is estimated to be USD 260.6 million as of 2022.
5. What are some drivers contributing to market growth?
N/A
6. What are the notable trends driving market growth?
N/A
7. Are there any restraints impacting market growth?
N/A
8. Can you provide examples of recent developments in the market?
N/A
9. What pricing options are available for accessing the report?
Pricing options include single-user, multi-user, and enterprise licenses priced at USD 4350.00, USD 6525.00, and USD 8700.00 respectively.
10. Is the market size provided in terms of value or volume?
The market size is provided in terms of value, measured in million and volume, measured in K.
11. Are there any specific market keywords associated with the report?
Yes, the market keyword associated with the report is "Normal Pressure Sintered Boron Carbide," which aids in identifying and referencing the specific market segment covered.
12. How do I determine which pricing option suits my needs best?
The pricing options vary based on user requirements and access needs. Individual users may opt for single-user licenses, while businesses requiring broader access may choose multi-user or enterprise licenses for cost-effective access to the report.
13. Are there any additional resources or data provided in the Normal Pressure Sintered Boron Carbide report?
While the report offers comprehensive insights, it's advisable to review the specific contents or supplementary materials provided to ascertain if additional resources or data are available.
14. How can I stay updated on further developments or reports in the Normal Pressure Sintered Boron Carbide?
To stay informed about further developments, trends, and reports in the Normal Pressure Sintered Boron Carbide, consider subscribing to industry newsletters, following relevant companies and organizations, or regularly checking reputable industry news sources and publications.
Methodology
Step 1 - Identification of Relevant Samples Size from Population Database


Step 2 - Approaches for Defining Global Market Size (Value, Volume* & Price*)

Note*: In applicable scenarios
Step 3 - Data Sources
Primary Research
- Web Analytics
- Survey Reports
- Research Institute
- Latest Research Reports
- Opinion Leaders
Secondary Research
- Annual Reports
- White Paper
- Latest Press Release
- Industry Association
- Paid Database
- Investor Presentations

Step 4 - Data Triangulation
Involves using different sources of information in order to increase the validity of a study
These sources are likely to be stakeholders in a program - participants, other researchers, program staff, other community members, and so on.
Then we put all data in single framework & apply various statistical tools to find out the dynamic on the market.
During the analysis stage, feedback from the stakeholder groups would be compared to determine areas of agreement as well as areas of divergence