

Key Insights
The Non-Alcoholic Steatohepatitis (NASH) Therapeutics and Diagnostics market is poised for significant expansion, driven by increasing global NASH prevalence, heightened disease awareness, and advancements in diagnostic and therapeutic technologies. The market, projected to reach $2.28 billion by 2025 with a CAGR of 21.85%, is expected to maintain this upward trajectory through the forecast period of 2025-2033. Key growth catalysts include the escalating obesity epidemic, rising type 2 diabetes incidence, and an aging global population, all contributing to elevated NASH risk factors. Market segmentation into therapeutics, focusing on disease modification and management, and diagnostics, enhancing early detection and monitoring, highlights a comprehensive strategy for addressing this complex liver condition. Leading companies such as Siemens Healthineers, GE Healthcare, and Novo Nordisk are actively investing in research, development, and market expansion, fostering dynamism and innovation.
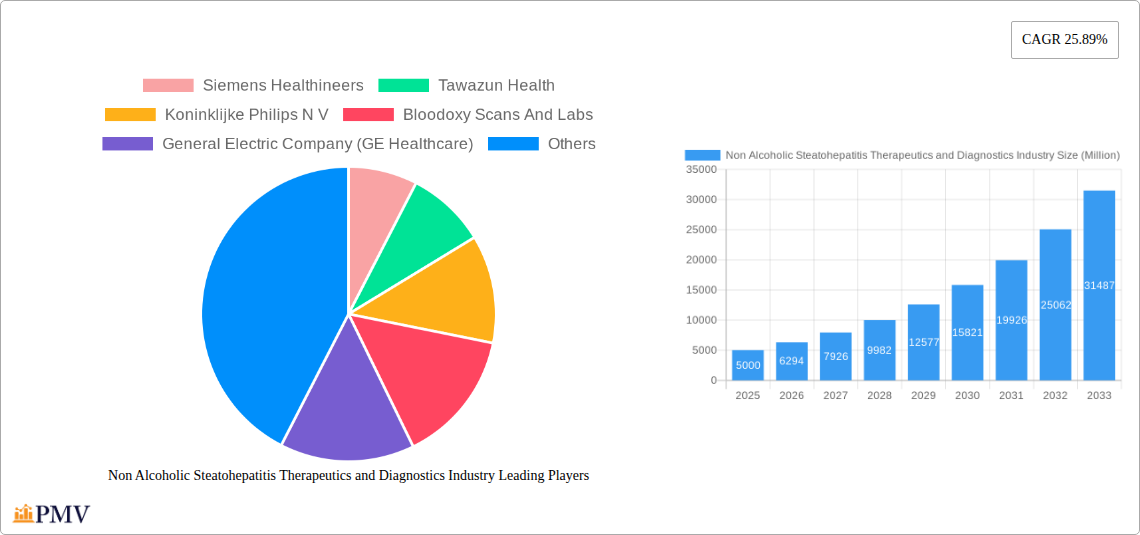
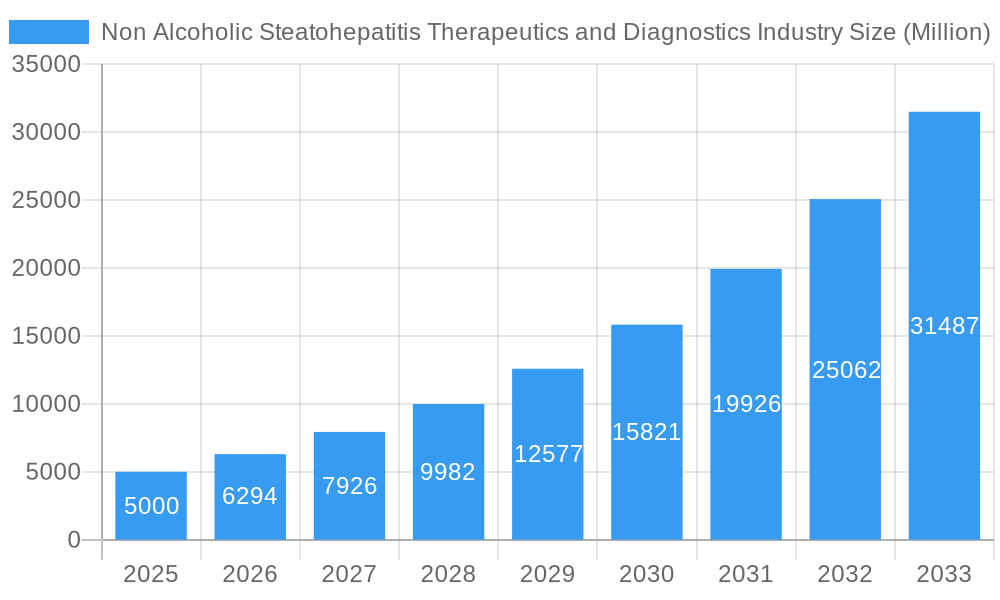
Non Alcoholic Steatohepatitis Therapeutics and Diagnostics Industry Market Size (In Billion)
Further market evolution is being shaped by trends such as the development of innovative therapies targeting diverse NASH pathogenesis pathways (e.g., fibrosis reduction, inflammation control), the increasing adoption of advanced imaging for precise disease characterization and staging (e.g., elastography, MRI), and the emergence of personalized medicine approaches leveraging patient-specific genetic and metabolic profiles. Nevertheless, challenges persist, including the high cost of diagnostic tests and novel therapeutics, complexities in NASH clinical trials affecting drug approval timelines, and limited availability of cost-effective diagnostic tools in certain regions, particularly in developing economies. Despite these constraints, substantial unmet medical needs, combined with ongoing research and technological breakthroughs, position the NASH market for robust long-term growth. Regional market dynamics are expected to show North America and Europe retaining dominant shares due to higher prevalence and advanced healthcare infrastructure, while the Asia Pacific region is anticipated to experience rapid growth driven by increasing prevalence and a burgeoning healthcare sector.
Non Alcoholic Steatohepatitis Therapeutics and Diagnostics Industry Company Market Share
Non Alcoholic Steatohepatitis (NASH) Therapeutics and Diagnostics Industry Market Report: 2019-2033
This comprehensive report provides a detailed analysis of the Non Alcoholic Steatohepatitis (NASH) Therapeutics and Diagnostics industry, offering actionable insights for stakeholders across the value chain. Covering the period 2019-2033, with a focus on 2025, this report examines market size, growth drivers, competitive dynamics, and future opportunities. The market is projected to reach xx Million by 2033, exhibiting a CAGR of xx% during the forecast period (2025-2033).
Non Alcoholic Steatohepatitis Therapeutics and Diagnostics Industry Market Structure & Competitive Dynamics
The NASH therapeutics and diagnostics market is characterized by a moderately concentrated landscape with several key players vying for market share. Market concentration is influenced by factors such as the regulatory environment, technological advancements, and the pace of new product approvals. The market exhibits a high degree of innovation, with companies continuously developing advanced diagnostic tools and therapeutic options. Regulatory frameworks, particularly in major markets like the US and EU, heavily influence market entry and product adoption. The presence of substitute therapies and diagnostic methods for liver diseases also impacts market competition. End-user preferences, driven by increasing awareness of NASH and the desire for early diagnosis and effective treatment, are driving market growth. Mergers and acquisitions (M&A) activity has been significant, with larger pharmaceutical companies acquiring smaller biotech firms with promising NASH pipelines. Deal values have ranged from xx Million to xx Million, reflecting the considerable investment in this sector.
- Market Concentration: Moderately concentrated, with top 5 players holding approximately xx% market share in 2024.
- Innovation Ecosystems: Strong collaborations between pharmaceutical companies, research institutions, and diagnostic companies are driving innovation.
- Regulatory Frameworks: Stringent regulatory approvals are a major hurdle for market entry, but also ensure product safety and efficacy.
- Product Substitutes: Existing treatments for liver diseases pose competition, although the specific treatment landscape for NASH is comparatively less developed.
- End-User Trends: Increased patient awareness and demand for effective therapies are key drivers.
- M&A Activity: Significant M&A activity observed with deal values exceeding xx Million in recent years.
Non Alcoholic Steatohepatitis Therapeutics and Diagnostics Industry Industry Trends & Insights
The NASH therapeutics and diagnostics market is experiencing robust growth fueled by several factors. The increasing prevalence of NASH, driven by rising obesity and type 2 diabetes rates, is a primary driver. Technological advancements in diagnostics, such as FibroScan and other non-invasive methods, are improving early detection rates, leading to earlier intervention. Consumer preferences are shifting towards non-invasive diagnostic techniques and more targeted therapies with fewer side effects. The competitive landscape remains dynamic, with ongoing R&D efforts resulting in the development of novel therapeutics and improved diagnostic tools. This leads to increased market penetration and a rising CAGR, predicted to reach xx% from 2025 to 2033. The market is also witnessing increased investment in research and development, driven by the significant unmet medical need and the potential for high returns. This has led to an increase in the number of clinical trials focusing on NASH therapeutics and diagnostics.
Dominant Markets & Segments in Non Alcoholic Steatohepatitis Therapeutics and Diagnostics Industry
The North American market currently holds the largest share of the NASH therapeutics and diagnostics market, driven by high prevalence rates, robust healthcare infrastructure, and significant investments in research and development. The United States specifically holds a dominant position within North America.
- Key Drivers in North America:
- High prevalence of obesity and type 2 diabetes.
- Advanced healthcare infrastructure.
- High level of healthcare expenditure.
- Stringent regulatory frameworks ensuring high quality therapeutics and diagnostics.
- Strong investment in research and development.
North America’s dominance is further solidified by the significant number of clinical trials underway, and the strong presence of major pharmaceutical companies with established NASH drug pipelines. The European market is also a significant contributor, although market penetration rates are slightly lower compared to the US. Within the product segments, the therapeutics segment currently holds a larger market share than diagnostics, driven by the rising demand for effective NASH treatments. However, the diagnostics segment is poised for substantial growth due to ongoing technological advancements.
Non Alcoholic Steatohepatitis Therapeutics and Diagnostics Industry Product Innovations
Recent years have witnessed significant advancements in NASH therapeutics and diagnostics. New non-invasive diagnostic methods, such as advanced imaging techniques and blood-based biomarkers, are enhancing early detection and personalized treatment strategies. In the therapeutics space, several novel drug candidates targeting various disease mechanisms are under development, offering the potential for improved treatment outcomes. These innovations leverage cutting-edge technologies like advanced imaging, molecular diagnostics, and targeted drug delivery, making them highly competitive. Market fit is driven by the urgent need for effective NASH therapies and the increasing recognition of the disease's burden.
Report Segmentation & Scope
The report segments the NASH therapeutics and diagnostics market by product type: Therapeutics and Diagnostics.
Therapeutics: This segment encompasses various drug classes, including antifibrotics, anti-inflammatory agents, and other novel therapeutic approaches. Market size is projected to reach xx Million by 2033, with a CAGR of xx%. Competitive dynamics are intense, with many companies developing new therapies.
Diagnostics: This segment includes non-invasive imaging techniques (e.g., FibroScan), blood tests, and other diagnostic tools. Market size is estimated to reach xx Million by 2033, showing a CAGR of xx%. Growth is driven by the need for early and accurate diagnosis of NASH.
Key Drivers of Non Alcoholic Steatohepatitis Therapeutics and Diagnostics Industry Growth
Several factors contribute to the growth of the NASH therapeutics and diagnostics market. The rising prevalence of NASH, linked to lifestyle changes and metabolic disorders, is a major driver. Technological advancements in diagnostic tools enable earlier disease detection. Increased investment in R&D leading to development of novel therapeutics and improved diagnostic methods. Growing awareness among healthcare professionals and patients are also propelling growth. Favorable regulatory policies supporting innovation are further fueling market expansion.
Challenges in the Non Alcoholic Steatohepatitis Therapeutics and Diagnostics Industry Sector
The NASH therapeutics and diagnostics market faces several challenges. The high cost of developing and manufacturing new therapies is a significant barrier. Regulatory hurdles for new drug approvals can slow down market entry. The complexity of NASH pathogenesis presents challenges in developing truly effective therapies. Competition amongst numerous companies developing NASH treatments adds pressure on profitability. Supply chain disruptions can affect access to raw materials and manufacturing capacity, impacting market stability.
Leading Players in the Non Alcoholic Steatohepatitis Therapeutics and Diagnostics Industry Market
- Siemens Healthineers
- Tawazun Health
- Koninklijke Philips N V
- Bloodoxy Scans And Labs
- General Electric Company (GE Healthcare)
- Novo Nordisk A/S
- Intercept Pharmaceuticals Inc
- Aimil Ltd
- Takeda Pharmaceutical Company Limited
- Genfit SA
- Gilead Sciences Inc
Key Developments in Non Alcoholic Steatohepatitis Therapeutics and Diagnostics Industry Sector
- June 2022: Echosens and Novo Nordisk A/S collaborate to advance early NASH diagnosis and increase disease awareness.
- May 2022: Pfizer Inc. receives FDA Fast Track designation for its investigational NASH combination therapy (ervogastat and clesacostat).
Strategic Non Alcoholic Steatohepatitis Therapeutics and Diagnostics Industry Market Outlook
The future of the NASH therapeutics and diagnostics market is bright, with significant growth potential. Continued innovation in diagnostics and therapeutics will drive market expansion. Increased collaborations between pharmaceutical companies, research institutions and diagnostic companies are expected to bring improved solutions. Growing public and private investments in R&D will contribute to the development of more effective and affordable therapies. The global NASH therapeutics and diagnostics market is poised for sustained growth over the forecast period driven by these factors.
Non Alcoholic Steatohepatitis Therapeutics and Diagnostics Industry Segmentation
-
1. Product
- 1.1. Therapeutics
-
1.2. Diagnostics
- 1.2.1. Imaging Techniques
- 1.2.2. Diagnostic Tests
- 1.2.3. Biopsy
Non Alcoholic Steatohepatitis Therapeutics and Diagnostics Industry Segmentation By Geography
-
1. North America
- 1.1. United States
- 1.2. Canada
- 1.3. Mexico
-
2. Europe
- 2.1. Germany
- 2.2. United Kingdom
- 2.3. France
- 2.4. Italy
- 2.5. Spain
- 2.6. Rest of Europe
-
3. Asia Pacific
- 3.1. China
- 3.2. Japan
- 3.3. India
- 3.4. Australia
- 3.5. South Korea
- 3.6. Rest of Asia Pacific
-
4. Middle East and Africa
- 4.1. GCC
- 4.2. South Africa
- 4.3. Rest of Middle East and Africa
-
5. South America
- 5.1. Brazil
- 5.2. Argentina
- 5.3. Rest of South America
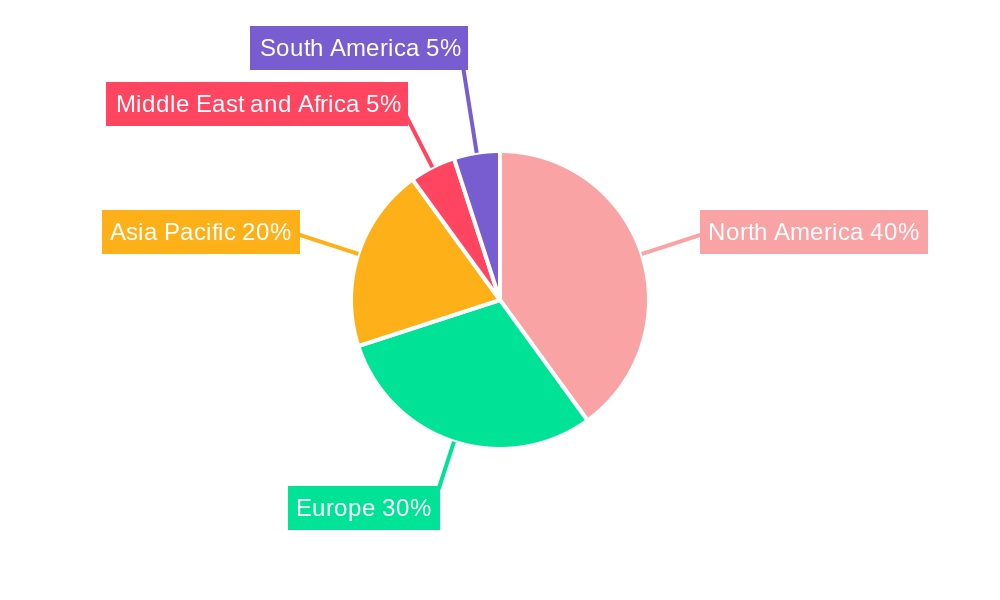
Non Alcoholic Steatohepatitis Therapeutics and Diagnostics Industry Regional Market Share
Geographic Coverage of Non Alcoholic Steatohepatitis Therapeutics and Diagnostics Industry
Non Alcoholic Steatohepatitis Therapeutics and Diagnostics Industry REPORT HIGHLIGHTS
| Aspects | Details |
|---|---|
| Study Period | 2020-2034 |
| Base Year | 2025 |
| Estimated Year | 2026 |
| Forecast Period | 2026-2034 |
| Historical Period | 2020-2025 |
| Growth Rate | CAGR of 21.85% from 2020-2034 |
| Segmentation |
|
Table of Contents
- 1. Introduction
- 1.1. Research Scope
- 1.2. Market Segmentation
- 1.3. Research Objective
- 1.4. Definitions and Assumptions
- 2. Executive Summary
- 2.1. Market Snapshot
- 3. Market Dynamics
- 3.1. Market Drivers
- 3.2. Market Restrains
- 3.3. Market Trends
- 3.4. Market Opportunities
- 4. Market Factor Analysis
- 4.1. Porters Five Forces
- 4.1.1. Bargaining Power of Suppliers
- 4.1.2. Bargaining Power of Buyers
- 4.1.3. Threat of New Entrants
- 4.1.4. Threat of Substitutes
- 4.1.5. Competitive Rivalry
- 4.2. PESTEL analysis
- 4.3. BCG Analysis
- 4.3.1. Stars (High Growth, High Market Share)
- 4.3.2. Cash Cows (Low Growth, High Market Share)
- 4.3.3. Question Mark (High Growth, Low Market Share)
- 4.3.4. Dogs (Low Growth, Low Market Share)
- 4.4. Ansoff Matrix Analysis
- 4.5. Supply Chain Analysis
- 4.6. Regulatory Landscape
- 4.7. Current Market Potential and Opportunity Assessment (TAM–SAM–SOM Framework)
- 4.8. PMV Analyst Note
- 4.1. Porters Five Forces
- 5. Market Analysis, Insights and Forecast 2021-2033
- 5.1. Market Analysis, Insights and Forecast - by Product
- 5.1.1. Therapeutics
- 5.1.2. Diagnostics
- 5.1.2.1. Imaging Techniques
- 5.1.2.2. Diagnostic Tests
- 5.1.2.3. Biopsy
- 5.2. Market Analysis, Insights and Forecast - by Region
- 5.2.1. North America
- 5.2.2. Europe
- 5.2.3. Asia Pacific
- 5.2.4. Middle East and Africa
- 5.2.5. South America
- 5.1. Market Analysis, Insights and Forecast - by Product
- 6. Global Non Alcoholic Steatohepatitis Therapeutics and Diagnostics Industry Analysis, Insights and Forecast, 2021-2033
- 6.1. Market Analysis, Insights and Forecast - by Product
- 6.1.1. Therapeutics
- 6.1.2. Diagnostics
- 6.1.2.1. Imaging Techniques
- 6.1.2.2. Diagnostic Tests
- 6.1.2.3. Biopsy
- 6.1. Market Analysis, Insights and Forecast - by Product
- 7. North America Non Alcoholic Steatohepatitis Therapeutics and Diagnostics Industry Analysis, Insights and Forecast, 2020-2032
- 7.1. Market Analysis, Insights and Forecast - by Product
- 7.1.1. Therapeutics
- 7.1.2. Diagnostics
- 7.1.2.1. Imaging Techniques
- 7.1.2.2. Diagnostic Tests
- 7.1.2.3. Biopsy
- 7.1. Market Analysis, Insights and Forecast - by Product
- 8. Europe Non Alcoholic Steatohepatitis Therapeutics and Diagnostics Industry Analysis, Insights and Forecast, 2020-2032
- 8.1. Market Analysis, Insights and Forecast - by Product
- 8.1.1. Therapeutics
- 8.1.2. Diagnostics
- 8.1.2.1. Imaging Techniques
- 8.1.2.2. Diagnostic Tests
- 8.1.2.3. Biopsy
- 8.1. Market Analysis, Insights and Forecast - by Product
- 9. Asia Pacific Non Alcoholic Steatohepatitis Therapeutics and Diagnostics Industry Analysis, Insights and Forecast, 2020-2032
- 9.1. Market Analysis, Insights and Forecast - by Product
- 9.1.1. Therapeutics
- 9.1.2. Diagnostics
- 9.1.2.1. Imaging Techniques
- 9.1.2.2. Diagnostic Tests
- 9.1.2.3. Biopsy
- 9.1. Market Analysis, Insights and Forecast - by Product
- 10. Middle East and Africa Non Alcoholic Steatohepatitis Therapeutics and Diagnostics Industry Analysis, Insights and Forecast, 2020-2032
- 10.1. Market Analysis, Insights and Forecast - by Product
- 10.1.1. Therapeutics
- 10.1.2. Diagnostics
- 10.1.2.1. Imaging Techniques
- 10.1.2.2. Diagnostic Tests
- 10.1.2.3. Biopsy
- 10.1. Market Analysis, Insights and Forecast - by Product
- 11. South America Non Alcoholic Steatohepatitis Therapeutics and Diagnostics Industry Analysis, Insights and Forecast, 2020-2032
- 11.1. Market Analysis, Insights and Forecast - by Product
- 11.1.1. Therapeutics
- 11.1.2. Diagnostics
- 11.1.2.1. Imaging Techniques
- 11.1.2.2. Diagnostic Tests
- 11.1.2.3. Biopsy
- 11.1. Market Analysis, Insights and Forecast - by Product
- 12. Competitive Analysis
- 12.1. Company Profiles
- 12.1.1 Siemens Healthineers
- 12.1.1.1. Company Overview
- 12.1.1.2. Products
- 12.1.1.3. Company Financials
- 12.1.1.4. SWOT Analysis
- 12.1.2 Tawazun Health
- 12.1.2.1. Company Overview
- 12.1.2.2. Products
- 12.1.2.3. Company Financials
- 12.1.2.4. SWOT Analysis
- 12.1.3 Koninklijke Philips N V
- 12.1.3.1. Company Overview
- 12.1.3.2. Products
- 12.1.3.3. Company Financials
- 12.1.3.4. SWOT Analysis
- 12.1.4 Bloodoxy Scans And Labs
- 12.1.4.1. Company Overview
- 12.1.4.2. Products
- 12.1.4.3. Company Financials
- 12.1.4.4. SWOT Analysis
- 12.1.5 General Electric Company (GE Healthcare)
- 12.1.5.1. Company Overview
- 12.1.5.2. Products
- 12.1.5.3. Company Financials
- 12.1.5.4. SWOT Analysis
- 12.1.6 Novo Nordisk A/S
- 12.1.6.1. Company Overview
- 12.1.6.2. Products
- 12.1.6.3. Company Financials
- 12.1.6.4. SWOT Analysis
- 12.1.7 Intercept Pharmaceuticals Inc
- 12.1.7.1. Company Overview
- 12.1.7.2. Products
- 12.1.7.3. Company Financials
- 12.1.7.4. SWOT Analysis
- 12.1.8 Aimil Ltd
- 12.1.8.1. Company Overview
- 12.1.8.2. Products
- 12.1.8.3. Company Financials
- 12.1.8.4. SWOT Analysis
- 12.1.9 Takeda Pharmaceutical Company Limited*List Not Exhaustive
- 12.1.9.1. Company Overview
- 12.1.9.2. Products
- 12.1.9.3. Company Financials
- 12.1.9.4. SWOT Analysis
- 12.1.10 Genfit SA
- 12.1.10.1. Company Overview
- 12.1.10.2. Products
- 12.1.10.3. Company Financials
- 12.1.10.4. SWOT Analysis
- 12.1.11 Gilead Sciences Inc
- 12.1.11.1. Company Overview
- 12.1.11.2. Products
- 12.1.11.3. Company Financials
- 12.1.11.4. SWOT Analysis
- 12.1.1 Siemens Healthineers
- 12.2. Market Entropy
- 12.2.1 Company's Key Areas Served
- 12.2.2 Recent Developments
- 12.3. Company Market Share Analysis 2025
- 12.3.1 Top 5 Companies Market Share Analysis
- 12.3.2 Top 3 Companies Market Share Analysis
- 12.4. List of Potential Customers
- 13. Research Methodology
List of Figures
- Figure 1: Global Non Alcoholic Steatohepatitis Therapeutics and Diagnostics Industry Revenue Breakdown (billion, %) by Region 2025 & 2033
- Figure 2: North America Non Alcoholic Steatohepatitis Therapeutics and Diagnostics Industry Revenue (billion), by Product 2025 & 2033
- Figure 3: North America Non Alcoholic Steatohepatitis Therapeutics and Diagnostics Industry Revenue Share (%), by Product 2025 & 2033
- Figure 4: North America Non Alcoholic Steatohepatitis Therapeutics and Diagnostics Industry Revenue (billion), by Country 2025 & 2033
- Figure 5: North America Non Alcoholic Steatohepatitis Therapeutics and Diagnostics Industry Revenue Share (%), by Country 2025 & 2033
- Figure 6: Europe Non Alcoholic Steatohepatitis Therapeutics and Diagnostics Industry Revenue (billion), by Product 2025 & 2033
- Figure 7: Europe Non Alcoholic Steatohepatitis Therapeutics and Diagnostics Industry Revenue Share (%), by Product 2025 & 2033
- Figure 8: Europe Non Alcoholic Steatohepatitis Therapeutics and Diagnostics Industry Revenue (billion), by Country 2025 & 2033
- Figure 9: Europe Non Alcoholic Steatohepatitis Therapeutics and Diagnostics Industry Revenue Share (%), by Country 2025 & 2033
- Figure 10: Asia Pacific Non Alcoholic Steatohepatitis Therapeutics and Diagnostics Industry Revenue (billion), by Product 2025 & 2033
- Figure 11: Asia Pacific Non Alcoholic Steatohepatitis Therapeutics and Diagnostics Industry Revenue Share (%), by Product 2025 & 2033
- Figure 12: Asia Pacific Non Alcoholic Steatohepatitis Therapeutics and Diagnostics Industry Revenue (billion), by Country 2025 & 2033
- Figure 13: Asia Pacific Non Alcoholic Steatohepatitis Therapeutics and Diagnostics Industry Revenue Share (%), by Country 2025 & 2033
- Figure 14: Middle East and Africa Non Alcoholic Steatohepatitis Therapeutics and Diagnostics Industry Revenue (billion), by Product 2025 & 2033
- Figure 15: Middle East and Africa Non Alcoholic Steatohepatitis Therapeutics and Diagnostics Industry Revenue Share (%), by Product 2025 & 2033
- Figure 16: Middle East and Africa Non Alcoholic Steatohepatitis Therapeutics and Diagnostics Industry Revenue (billion), by Country 2025 & 2033
- Figure 17: Middle East and Africa Non Alcoholic Steatohepatitis Therapeutics and Diagnostics Industry Revenue Share (%), by Country 2025 & 2033
- Figure 18: South America Non Alcoholic Steatohepatitis Therapeutics and Diagnostics Industry Revenue (billion), by Product 2025 & 2033
- Figure 19: South America Non Alcoholic Steatohepatitis Therapeutics and Diagnostics Industry Revenue Share (%), by Product 2025 & 2033
- Figure 20: South America Non Alcoholic Steatohepatitis Therapeutics and Diagnostics Industry Revenue (billion), by Country 2025 & 2033
- Figure 21: South America Non Alcoholic Steatohepatitis Therapeutics and Diagnostics Industry Revenue Share (%), by Country 2025 & 2033
List of Tables
- Table 1: Global Non Alcoholic Steatohepatitis Therapeutics and Diagnostics Industry Revenue billion Forecast, by Product 2020 & 2033
- Table 2: Global Non Alcoholic Steatohepatitis Therapeutics and Diagnostics Industry Revenue billion Forecast, by Region 2020 & 2033
- Table 3: Global Non Alcoholic Steatohepatitis Therapeutics and Diagnostics Industry Revenue billion Forecast, by Product 2020 & 2033
- Table 4: Global Non Alcoholic Steatohepatitis Therapeutics and Diagnostics Industry Revenue billion Forecast, by Country 2020 & 2033
- Table 5: United States Non Alcoholic Steatohepatitis Therapeutics and Diagnostics Industry Revenue (billion) Forecast, by Application 2020 & 2033
- Table 6: Canada Non Alcoholic Steatohepatitis Therapeutics and Diagnostics Industry Revenue (billion) Forecast, by Application 2020 & 2033
- Table 7: Mexico Non Alcoholic Steatohepatitis Therapeutics and Diagnostics Industry Revenue (billion) Forecast, by Application 2020 & 2033
- Table 8: Global Non Alcoholic Steatohepatitis Therapeutics and Diagnostics Industry Revenue billion Forecast, by Product 2020 & 2033
- Table 9: Global Non Alcoholic Steatohepatitis Therapeutics and Diagnostics Industry Revenue billion Forecast, by Country 2020 & 2033
- Table 10: Germany Non Alcoholic Steatohepatitis Therapeutics and Diagnostics Industry Revenue (billion) Forecast, by Application 2020 & 2033
- Table 11: United Kingdom Non Alcoholic Steatohepatitis Therapeutics and Diagnostics Industry Revenue (billion) Forecast, by Application 2020 & 2033
- Table 12: France Non Alcoholic Steatohepatitis Therapeutics and Diagnostics Industry Revenue (billion) Forecast, by Application 2020 & 2033
- Table 13: Italy Non Alcoholic Steatohepatitis Therapeutics and Diagnostics Industry Revenue (billion) Forecast, by Application 2020 & 2033
- Table 14: Spain Non Alcoholic Steatohepatitis Therapeutics and Diagnostics Industry Revenue (billion) Forecast, by Application 2020 & 2033
- Table 15: Rest of Europe Non Alcoholic Steatohepatitis Therapeutics and Diagnostics Industry Revenue (billion) Forecast, by Application 2020 & 2033
- Table 16: Global Non Alcoholic Steatohepatitis Therapeutics and Diagnostics Industry Revenue billion Forecast, by Product 2020 & 2033
- Table 17: Global Non Alcoholic Steatohepatitis Therapeutics and Diagnostics Industry Revenue billion Forecast, by Country 2020 & 2033
- Table 18: China Non Alcoholic Steatohepatitis Therapeutics and Diagnostics Industry Revenue (billion) Forecast, by Application 2020 & 2033
- Table 19: Japan Non Alcoholic Steatohepatitis Therapeutics and Diagnostics Industry Revenue (billion) Forecast, by Application 2020 & 2033
- Table 20: India Non Alcoholic Steatohepatitis Therapeutics and Diagnostics Industry Revenue (billion) Forecast, by Application 2020 & 2033
- Table 21: Australia Non Alcoholic Steatohepatitis Therapeutics and Diagnostics Industry Revenue (billion) Forecast, by Application 2020 & 2033
- Table 22: South Korea Non Alcoholic Steatohepatitis Therapeutics and Diagnostics Industry Revenue (billion) Forecast, by Application 2020 & 2033
- Table 23: Rest of Asia Pacific Non Alcoholic Steatohepatitis Therapeutics and Diagnostics Industry Revenue (billion) Forecast, by Application 2020 & 2033
- Table 24: Global Non Alcoholic Steatohepatitis Therapeutics and Diagnostics Industry Revenue billion Forecast, by Product 2020 & 2033
- Table 25: Global Non Alcoholic Steatohepatitis Therapeutics and Diagnostics Industry Revenue billion Forecast, by Country 2020 & 2033
- Table 26: GCC Non Alcoholic Steatohepatitis Therapeutics and Diagnostics Industry Revenue (billion) Forecast, by Application 2020 & 2033
- Table 27: South Africa Non Alcoholic Steatohepatitis Therapeutics and Diagnostics Industry Revenue (billion) Forecast, by Application 2020 & 2033
- Table 28: Rest of Middle East and Africa Non Alcoholic Steatohepatitis Therapeutics and Diagnostics Industry Revenue (billion) Forecast, by Application 2020 & 2033
- Table 29: Global Non Alcoholic Steatohepatitis Therapeutics and Diagnostics Industry Revenue billion Forecast, by Product 2020 & 2033
- Table 30: Global Non Alcoholic Steatohepatitis Therapeutics and Diagnostics Industry Revenue billion Forecast, by Country 2020 & 2033
- Table 31: Brazil Non Alcoholic Steatohepatitis Therapeutics and Diagnostics Industry Revenue (billion) Forecast, by Application 2020 & 2033
- Table 32: Argentina Non Alcoholic Steatohepatitis Therapeutics and Diagnostics Industry Revenue (billion) Forecast, by Application 2020 & 2033
- Table 33: Rest of South America Non Alcoholic Steatohepatitis Therapeutics and Diagnostics Industry Revenue (billion) Forecast, by Application 2020 & 2033
Frequently Asked Questions
1. What is the projected Compound Annual Growth Rate (CAGR) of the Non Alcoholic Steatohepatitis Therapeutics and Diagnostics Industry?
The projected CAGR is approximately 21.85%.
2. Which companies are prominent players in the Non Alcoholic Steatohepatitis Therapeutics and Diagnostics Industry?
Key companies in the market include Siemens Healthineers, Tawazun Health, Koninklijke Philips N V, Bloodoxy Scans And Labs, General Electric Company (GE Healthcare), Novo Nordisk A/S, Intercept Pharmaceuticals Inc, Aimil Ltd, Takeda Pharmaceutical Company Limited*List Not Exhaustive, Genfit SA, Gilead Sciences Inc.
3. What are the main segments of the Non Alcoholic Steatohepatitis Therapeutics and Diagnostics Industry?
The market segments include Product.
4. Can you provide details about the market size?
The market size is estimated to be USD 2.28 billion as of 2022.
5. What are some drivers contributing to market growth?
Increase in NASH-Affected Population; Rising Global Prevalence of Diabetic and Obese Populations; Increasing Awareness About NAFLD/NASH.
6. What are the notable trends driving market growth?
Diagnostic Tests is Projected to Have Notable Market Growth Over the Forecast Period.
7. Are there any restraints impacting market growth?
Lack of Effective Diagnostics for Non-alcoholic Fatty Liver Disease (NAFLD); Slow Advancements in the Therapeutic Field.
8. Can you provide examples of recent developments in the market?
In June 2022, Echosens, and Novo Nordisk A/S, announced a collaboration to advance the early diagnosis of non-alcoholic steatohepatitis (NASH) and increase awareness of the disease among patients, healthcare providers, and other stakeholders.
9. What pricing options are available for accessing the report?
Pricing options include single-user, multi-user, and enterprise licenses priced at USD 4750, USD 5250, and USD 8750 respectively.
10. Is the market size provided in terms of value or volume?
The market size is provided in terms of value, measured in billion.
11. Are there any specific market keywords associated with the report?
Yes, the market keyword associated with the report is "Non Alcoholic Steatohepatitis Therapeutics and Diagnostics Industry," which aids in identifying and referencing the specific market segment covered.
12. How do I determine which pricing option suits my needs best?
The pricing options vary based on user requirements and access needs. Individual users may opt for single-user licenses, while businesses requiring broader access may choose multi-user or enterprise licenses for cost-effective access to the report.
13. Are there any additional resources or data provided in the Non Alcoholic Steatohepatitis Therapeutics and Diagnostics Industry report?
While the report offers comprehensive insights, it's advisable to review the specific contents or supplementary materials provided to ascertain if additional resources or data are available.
14. How can I stay updated on further developments or reports in the Non Alcoholic Steatohepatitis Therapeutics and Diagnostics Industry?
To stay informed about further developments, trends, and reports in the Non Alcoholic Steatohepatitis Therapeutics and Diagnostics Industry, consider subscribing to industry newsletters, following relevant companies and organizations, or regularly checking reputable industry news sources and publications.
Methodology
Step 1 - Identification of Relevant Samples Size from Population Database


Step 2 - Approaches for Defining Global Market Size (Value, Volume* & Price*)

Note*: In applicable scenarios
Step 3 - Data Sources
Primary Research
- Web Analytics
- Survey Reports
- Research Institute
- Latest Research Reports
- Opinion Leaders
Secondary Research
- Annual Reports
- White Paper
- Latest Press Release
- Industry Association
- Paid Database
- Investor Presentations

Step 4 - Data Triangulation
Involves using different sources of information in order to increase the validity of a study
These sources are likely to be stakeholders in a program - participants, other researchers, program staff, other community members, and so on.
Then we put all data in single framework & apply various statistical tools to find out the dynamic on the market.
During the analysis stage, feedback from the stakeholder groups would be compared to determine areas of agreement as well as areas of divergence