
Key Insights
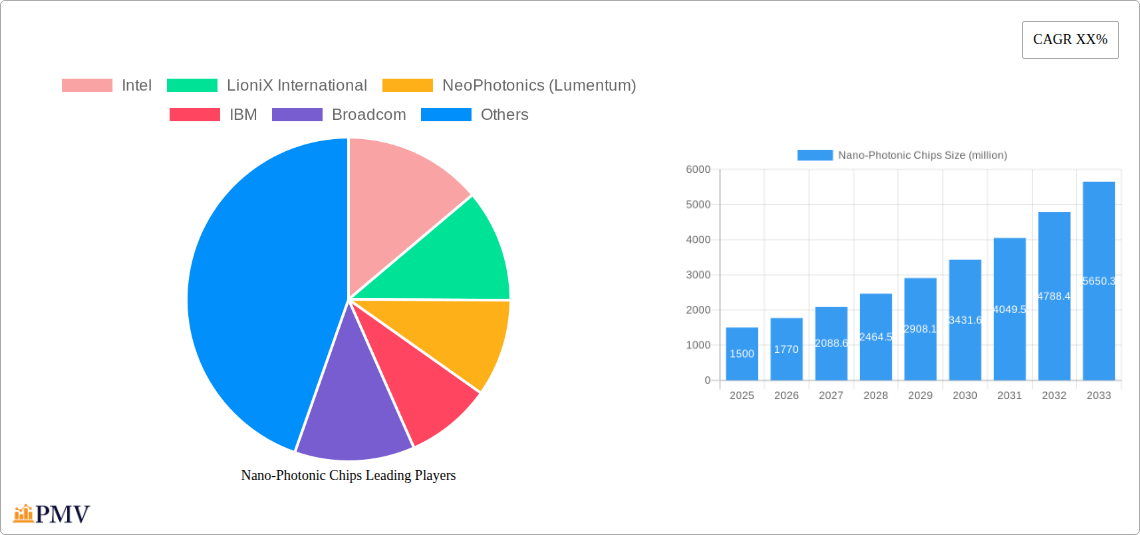
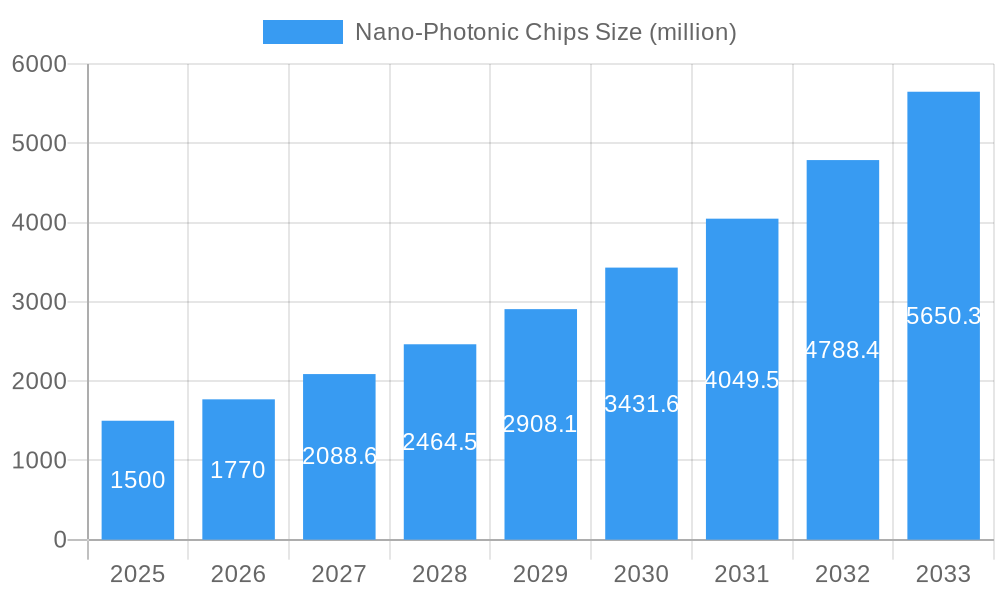
The global Nano-Photonic Chips market is poised for substantial growth, estimated at a market size of $1,500 million in 2025, with a projected Compound Annual Growth Rate (CAGR) of 18% through 2033. This expansion is primarily fueled by the increasing demand for high-speed data transmission and processing, driven by advancements in telecommunications, data centers, and the burgeoning field of artificial intelligence. The integration of photonic technologies into smaller, more efficient chips is enabling breakthroughs in areas such as somatosensory interaction and secure communications, where the speed and bandwidth advantages of photonics are crucial. The smart driving sector is also a significant contributor, leveraging nano-photonic chips for advanced sensing and real-time data processing, enhancing vehicle safety and autonomous capabilities.
Nano-Photonic Chips Market Size (In Billion)

The market's trajectory is further bolstered by the ongoing miniaturization of electronic components and the pursuit of energy-efficient computing solutions. Emerging trends include the development of silicon photonics for cost-effective manufacturing and wider adoption. However, challenges such as the high cost of initial R&D and the need for specialized manufacturing processes may pose some restraint to rapid market penetration in certain segments. Key players like Intel, IBM, Broadcom, and Taiwan Semiconductor Manufacturing are at the forefront, investing heavily in research and development to overcome these hurdles and capitalize on the diverse applications of nano-photonic chips across various industries, particularly in high-growth regions like Asia Pacific and North America.
Nano-Photonic Chips Company Market Share
Nano-Photonic Chips Market: A Comprehensive Analysis and Strategic Outlook (2019-2033)
This in-depth report provides a granular analysis of the global Nano-Photonic Chips market, a rapidly evolving sector poised for significant growth driven by advancements in optical networking, artificial intelligence, and sensing technologies. Covering a study period from 2019 to 2033, with a base year of 2025 and a forecast period extending to 2033, this report offers critical insights into market structure, key trends, dominant segments, product innovations, growth drivers, challenges, leading players, and strategic outlook. Gain a competitive edge by understanding the intricate dynamics shaping the future of nano-photonic chip technology and its diverse applications.
Nano-Photonic Chips Market Structure & Competitive Dynamics
The nano-photonic chips market exhibits a dynamic and evolving competitive landscape, characterized by a blend of established semiconductor giants and specialized photonics innovators. Market concentration varies across different product segments and applications, with some areas dominated by a few key players, while others foster a more fragmented ecosystem. Intel, IBM, and Broadcom are significant players leveraging their extensive semiconductor manufacturing capabilities and integration expertise. Simultaneously, companies like LioniX International, NeoPhotonics (Lumentum), and Wuhan Accelink Technology are at the forefront of specialized silicon photonics and integrated photonic circuit development, contributing to the innovation ecosystem. Lumentum Holdings, through strategic acquisitions and organic growth, also holds a substantial market presence.
- Market Share Analysis: Understanding the market share distribution among key players is crucial for identifying competitive advantages and potential consolidation opportunities. Reports indicate that leading integrated photonic circuit providers command significant portions of the market for high-speed communication and data center applications.
- Innovation Ecosystems: The market is fueled by robust innovation, driven by collaborations between research institutions, startups, and established companies. This includes advancements in materials science, chip design, and manufacturing processes, leading to miniaturization and enhanced performance.
- Regulatory Frameworks: Emerging regulations concerning data security, electromagnetic interference, and environmental standards are gradually shaping market entry and product development strategies. Compliance with these frameworks is paramount for sustained growth.
- Product Substitutes: While nano-photonic chips offer significant advantages, traditional electronic components and alternative sensing technologies represent potential substitutes in certain niche applications. However, the increasing demand for higher bandwidth, lower power consumption, and faster processing speeds in emerging technologies like 5G and AI continues to drive the adoption of photonic solutions.
- End-User Trends: Key end-user trends include the increasing demand for faster data transmission in telecommunications, high-performance computing, autonomous driving systems, and advanced sensor technologies. The miniaturization and energy efficiency offered by nano-photonic chips are also critical.
- M&A Activities: Merger and acquisition (M&A) activities are prevalent as companies seek to acquire specialized technologies, expand their product portfolios, and gain market access. For instance, Lumentum's acquisition of NeoPhotonics significantly bolstered its position in the optical communications market. M&A deal values in the sector have reached hundreds of millions of dollars, reflecting the strategic importance of acquiring photonic capabilities.
Nano-Photonic Chips Industry Trends & Insights
The nano-photonic chips industry is experiencing an unprecedented surge, driven by the relentless pursuit of higher bandwidth, lower latency, and increased energy efficiency across a multitude of sectors. The compound annual growth rate (CAGR) for this market is projected to be exceptionally strong, estimated to be in the double digits throughout the forecast period. Market penetration is rapidly expanding beyond traditional telecommunications and data centers into emerging fields such as advanced sensing for autonomous vehicles, medical diagnostics, and industrial automation. This growth is underpinned by several critical technological advancements and evolving consumer and industry preferences.
The integration of photonics with advanced semiconductor manufacturing processes, particularly at nodes like ≤ 2nm and 3nm, is enabling the creation of smaller, more powerful, and more energy-efficient nano-photonic devices. These advancements are crucial for meeting the insatiable data demands of 5G networks, artificial intelligence workloads, and the Internet of Things (IoT). The development of co-packaged optics, where optical components are integrated directly onto or alongside processors, represents a significant disruption, promising to overcome the interconnect bottlenecks that plague current electronic systems. This integration is expected to boost data transfer speeds by several orders of magnitude while drastically reducing power consumption.
Consumer preferences are increasingly leaning towards immersive experiences, which require seamless, high-speed data transfer. This is evident in the growing adoption of virtual reality (VR), augmented reality (AR), and advanced gaming technologies, all of which will rely heavily on the capabilities of nano-photonic chips. Similarly, the automotive industry's push towards autonomous driving is a major market driver. Advanced driver-assistance systems (ADAS) and self-driving capabilities necessitate sophisticated LiDAR systems and high-speed in-vehicle communication networks, areas where nano-photonic chips are demonstrating a clear advantage.
Competitive dynamics are intensifying, with established players like Broadcom and Taiwan Semiconductor Manufacturing investing heavily in silicon photonics technology. Startups and specialized companies such as LioniX International and Sai MicroElectronics are carving out niches by focusing on specific applications and innovative materials. The ongoing innovation in laser sources, modulators, detectors, and integrated optical circuits is a key differentiator. The ability to fabricate these complex components with high yield and at scale is becoming a critical competitive factor. Furthermore, the development of novel materials and fabrication techniques that allow for further miniaturization and enhanced performance at sub-2nm and 3nm nodes will dictate market leadership. The increasing complexity of data processing and the need for faster, more efficient communication channels are creating a fertile ground for nano-photonic chip adoption, making this a market characterized by rapid technological evolution and significant investment.
Dominant Markets & Segments in Nano-Photonic Chips
The global nano-photonic chips market is characterized by regional dominance and the significant growth of specific application and type segments. North America, particularly the United States, currently leads the market, driven by substantial investments in research and development, a robust semiconductor industry, and the rapid deployment of advanced telecommunications infrastructure. The presence of major technology giants like Intel and IBM further solidifies its position. However, Asia Pacific, led by China and Taiwan, is emerging as a critical growth hub, fueled by government initiatives supporting advanced manufacturing, the expansion of 5G networks, and the increasing adoption of smart technologies across various industries.
- Leading Region: North America currently dominates the market due to strong R&D capabilities and early adoption of advanced technologies.
- Emerging Hub: Asia Pacific is exhibiting the fastest growth, driven by widespread 5G deployment and government support for the semiconductor industry.
- Key Country Drivers (North America):
- Economic Policies: Favorable government funding for AI and advanced manufacturing research and development.
- Infrastructure: Rapid build-out of fiber optic networks and data centers to support increased data traffic.
- Technological Innovation: Presence of leading technology companies driving advancements in silicon photonics.
- Key Country Drivers (Asia Pacific):
- Government Initiatives: Strong support for the domestic semiconductor industry and 5G infrastructure development.
- Manufacturing Prowess: Large-scale manufacturing capabilities, particularly in Taiwan, are crucial for chip production.
- Growing Demand: Rapid adoption of smart devices, electric vehicles, and smart city initiatives.
Application Dominance:
- Smart Driving: This segment is experiencing phenomenal growth due to the increasing complexity of autonomous driving systems. Nano-photonic chips are essential for LiDAR sensors, in-vehicle communication, and advanced driver-assistance systems (ADAS). The need for real-time data processing and high-speed communication within vehicles makes photonic solutions indispensable. Key drivers include safety regulations, consumer demand for advanced features, and the continuous evolution of autonomous driving technology.
- Security: In the security sector, nano-photonic chips are finding applications in advanced surveillance systems, biometric authentication, and secure communication networks. Their ability to detect minute changes and transmit data at high speeds is critical for next-generation security solutions.
- Somatosensory Interaction: With the rise of VR, AR, and haptic feedback technologies, nano-photonic chips are playing a crucial role in enabling more responsive and immersive user experiences. They facilitate the precise detection and transmission of sensory data, enhancing the realism and interactivity of these applications.
- Volume Measurement: In industrial and scientific applications, nano-photonic chips are employed for highly accurate volume measurement and flow sensing, leveraging their precision and sensitivity.
- Others: This broad category includes applications in medical imaging, advanced sensing, scientific instrumentation, and consumer electronics, all of which are contributing to the market's diversification.
Type Dominance:
- ≤ 2nm and 3nm: While currently in the early stages of development and adoption for photonic applications, these advanced nodes represent the future of nano-photonic chip miniaturization and performance enhancement. As manufacturing processes mature for these nodes, they are expected to unlock unprecedented capabilities in terms of speed, power efficiency, and integration density. The primary challenge remains the cost-effective fabrication of photonic structures at such small scales.
- Others: This category encompasses current mainstream nano-photonic chip technologies, often built on slightly larger nodes (e.g., 10nm, 28nm), which are widely adopted in existing telecommunications and data center infrastructure. These chips provide high-performance optical transceivers, modulators, and detectors that are crucial for current high-speed data transfer needs.
The interplay between these segments and regions highlights a market poised for widespread technological integration and adoption, driven by performance demands and evolving application requirements.
Nano-Photonic Chips Product Innovations
The nano-photonic chips market is characterized by continuous product innovation focused on enhancing speed, miniaturization, and energy efficiency. Key developments include the integration of multiple photonic functions onto a single chip, enabling smaller and more powerful optical transceivers and sensors. Advancements in silicon photonics fabrication have led to the production of high-performance modulators and detectors with reduced power consumption. Innovations in materials, such as the integration of III-V materials with silicon, are enabling the development of compact and efficient on-chip laser sources. These product developments directly address the growing demand for faster data transfer in data centers, advanced sensing capabilities in automotive, and immersive experiences in consumer electronics, providing significant competitive advantages for companies that can deliver these cutting-edge solutions.
Report Segmentation & Scope
This comprehensive report segments the global nano-photonic chips market based on critical application and technology types. The scope encompasses a detailed analysis of market sizes, growth projections, and competitive dynamics within each segment.
Application Segments:
- Somatosensory Interaction: This segment is projected to experience robust growth as VR, AR, and haptic feedback technologies become more mainstream. Growth projections indicate a significant market expansion driven by consumer demand for immersive experiences.
- Security: Applications in advanced surveillance, biometrics, and secure communication are driving steady growth. Market size for this segment is expanding due to increasing global security concerns.
- Smart Driving: This segment is a major growth accelerator, with significant market size expansion driven by the automotive industry's transition to autonomous vehicles and advanced ADAS.
- Volume Measurement: This segment, serving industrial and scientific applications, shows steady but stable growth, with its market size driven by precision measurement needs.
- Others: This encompasses diverse applications in medical diagnostics, consumer electronics, and scientific instrumentation, collectively contributing to overall market growth with varied individual projections.
Type Segments:
- ≤ 2nm and 3nm: These advanced node types, while nascent, represent the future of nano-photonic integration. Their market size is currently limited but projected for exponential growth as manufacturing capabilities mature, driven by the demand for ultra-compact and high-performance devices.
- Others: This category includes existing and widely adopted nano-photonic chip technologies. The market size for these types remains substantial, driven by current demand in telecommunications and data centers, with moderate but consistent growth projections.
The report provides a granular view of each segmentation, offering insights into market penetration, technological trends, and competitive landscapes within these defined areas.
Key Drivers of Nano-Photonic Chips Growth
The nano-photonic chips market is propelled by a confluence of technological advancements, economic imperatives, and supportive regulatory environments. The relentless demand for higher data transmission speeds and lower latency, particularly with the global rollout of 5G networks and the expansion of cloud computing, serves as a primary driver. The burgeoning field of artificial intelligence and machine learning, which requires massive data processing capabilities, also significantly boosts the need for high-performance, energy-efficient photonic interconnects.
- Technological Advancements: Miniaturization enabled by advanced lithography techniques, improved material science for efficient light manipulation, and the development of integrated photonics platforms are crucial. The progress in co-packaged optics and advanced chip design further fuels growth.
- Economic Factors: The increasing digitization of industries, the growth of the IoT ecosystem, and the demand for faster consumer electronics are creating substantial market opportunities. Cost reductions in fabrication processes are also making photonic solutions more accessible.
- Regulatory & Policy Support: Government initiatives supporting advanced manufacturing, digital infrastructure development, and research in photonics provide a favorable ecosystem for market expansion. For example, national strategies to boost domestic semiconductor production indirectly benefit the nano-photonic chip sector.
Challenges in the Nano-Photonic Chips Sector
Despite its immense potential, the nano-photonic chips sector faces several significant challenges that could impact its growth trajectory. The primary hurdle remains the high cost and complexity associated with the advanced manufacturing processes required to produce these intricate devices at scale. Achieving high yields for nanoscale photonic components is technically demanding and impacts the overall cost-effectiveness compared to established electronic counterparts.
- Manufacturing Complexity & Cost: The intricate fabrication processes for nanoscale photonic devices are capital-intensive and require specialized equipment, leading to higher unit costs. Yield optimization for sub-2nm and 3nm nodes presents substantial engineering challenges.
- Integration with Existing Infrastructure: Seamlessly integrating nano-photonic chips into existing electronic systems and infrastructure can be complex, requiring compatibility solutions and standardization efforts.
- Talent Gap: There is a shortage of skilled engineers and technicians with expertise in photonics, semiconductor fabrication, and integrated circuit design, which can hinder innovation and production scalability.
- Supply Chain Volatility: Like other advanced semiconductor sectors, the nano-photonic chip industry is susceptible to supply chain disruptions, raw material availability, and geopolitical factors that can affect production and pricing.
Leading Players in the Nano-Photonic Chips Market
The competitive landscape for nano-photonic chips is dynamic, featuring a mix of established semiconductor giants and specialized photonics innovators. Key companies driving innovation and market growth include:
- Intel
- LioniX International
- NeoPhotonics (Lumentum)
- IBM
- Broadcom
- Nokia
- Deptrum
- Ciena
- Lumentum Holdings
- Wuhan Accelink Technology
- Taiwan Semiconductor Manufacturing
- Sai MicroElectronics
Key Developments in Nano-Photonic Chips Sector
The nano-photonic chips sector has witnessed numerous strategic developments that have significantly shaped its market dynamics. These advancements range from technological breakthroughs in fabrication to strategic partnerships and acquisitions aimed at expanding market reach and technological capabilities.
- 2023: Intel announced significant progress in its silicon photonics technology, showcasing advancements in co-packaged optics with potential for data center applications.
- 2022: Lumentum Holdings completed the acquisition of NeoPhotonics, strengthening its portfolio of optical components and modules for high-speed communications.
- 2021: IBM unveiled new breakthroughs in silicon photonics, focusing on energy-efficient interconnects for advanced computing applications.
- 2020: Broadcom launched new high-speed optical transceivers leveraging advanced nano-photonic designs for 5G infrastructure and data centers.
- 2019: LioniX International announced the expansion of its manufacturing capacity for integrated photonic circuits, catering to the growing demand from telecommunications and sensing industries.
- Ongoing: Continuous advancements in lithography to achieve sub-2nm and 3nm node capabilities for photonic integration are being pursued by multiple industry players and research institutions.
Strategic Nano-Photonic Chips Market Outlook
The strategic outlook for the nano-photonic chips market is overwhelmingly positive, characterized by strong growth accelerators and substantial future potential. The increasing demand for higher bandwidth and lower latency in telecommunications, data centers, and emerging applications like AI and autonomous driving creates a fertile ground for photonic solutions. Strategic opportunities lie in the continued miniaturization and integration of optical functions onto chips, leading to more compact, energy-efficient, and cost-effective devices. Companies that can master the fabrication of photonic circuits at advanced semiconductor nodes (≤ 2nm and 3nm) and effectively integrate them into next-generation computing and communication systems are poised for significant market leadership. Furthermore, strategic partnerships between semiconductor manufacturers, equipment providers, and end-users will be crucial for accelerating innovation and market adoption, unlocking the full potential of nano-photonic technology.
Nano-Photonic Chips Segmentation
-
1. Application
- 1.1. Somatosensory Interaction
- 1.2. Security
- 1.3. Smart Driving
- 1.4. Volume Measurement
- 1.5. Others
-
2. Types
- 2.1. ≤ 2nm
- 2.2. 3nm
- 2.3. Others
Nano-Photonic Chips Segmentation By Geography
-
1. North America
- 1.1. United States
- 1.2. Canada
- 1.3. Mexico
-
2. South America
- 2.1. Brazil
- 2.2. Argentina
- 2.3. Rest of South America
-
3. Europe
- 3.1. United Kingdom
- 3.2. Germany
- 3.3. France
- 3.4. Italy
- 3.5. Spain
- 3.6. Russia
- 3.7. Benelux
- 3.8. Nordics
- 3.9. Rest of Europe
-
4. Middle East & Africa
- 4.1. Turkey
- 4.2. Israel
- 4.3. GCC
- 4.4. North Africa
- 4.5. South Africa
- 4.6. Rest of Middle East & Africa
-
5. Asia Pacific
- 5.1. China
- 5.2. India
- 5.3. Japan
- 5.4. South Korea
- 5.5. ASEAN
- 5.6. Oceania
- 5.7. Rest of Asia Pacific
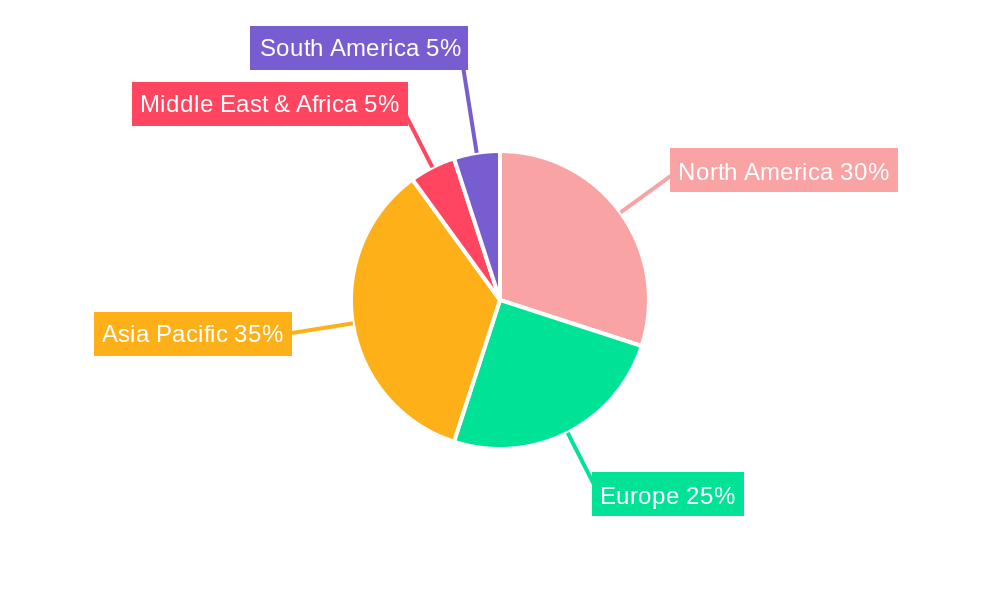
Nano-Photonic Chips Regional Market Share
Geographic Coverage of Nano-Photonic Chips
Nano-Photonic Chips REPORT HIGHLIGHTS
| Aspects | Details |
|---|---|
| Study Period | 2020-2034 |
| Base Year | 2025 |
| Estimated Year | 2026 |
| Forecast Period | 2026-2034 |
| Historical Period | 2020-2025 |
| Growth Rate | CAGR of 11.91% from 2020-2034 |
| Segmentation |
|
Table of Contents
- 1. Introduction
- 1.1. Research Scope
- 1.2. Market Segmentation
- 1.3. Research Methodology
- 1.4. Definitions and Assumptions
- 2. Executive Summary
- 2.1. Introduction
- 3. Market Dynamics
- 3.1. Introduction
- 3.2. Market Drivers
- 3.3. Market Restrains
- 3.4. Market Trends
- 4. Market Factor Analysis
- 4.1. Porters Five Forces
- 4.2. Supply/Value Chain
- 4.3. PESTEL analysis
- 4.4. Market Entropy
- 4.5. Patent/Trademark Analysis
- 5. Global Nano-Photonic Chips Analysis, Insights and Forecast, 2020-2032
- 5.1. Market Analysis, Insights and Forecast - by Application
- 5.1.1. Somatosensory Interaction
- 5.1.2. Security
- 5.1.3. Smart Driving
- 5.1.4. Volume Measurement
- 5.1.5. Others
- 5.2. Market Analysis, Insights and Forecast - by Types
- 5.2.1. ≤ 2nm
- 5.2.2. 3nm
- 5.2.3. Others
- 5.3. Market Analysis, Insights and Forecast - by Region
- 5.3.1. North America
- 5.3.2. South America
- 5.3.3. Europe
- 5.3.4. Middle East & Africa
- 5.3.5. Asia Pacific
- 5.1. Market Analysis, Insights and Forecast - by Application
- 6. North America Nano-Photonic Chips Analysis, Insights and Forecast, 2020-2032
- 6.1. Market Analysis, Insights and Forecast - by Application
- 6.1.1. Somatosensory Interaction
- 6.1.2. Security
- 6.1.3. Smart Driving
- 6.1.4. Volume Measurement
- 6.1.5. Others
- 6.2. Market Analysis, Insights and Forecast - by Types
- 6.2.1. ≤ 2nm
- 6.2.2. 3nm
- 6.2.3. Others
- 6.1. Market Analysis, Insights and Forecast - by Application
- 7. South America Nano-Photonic Chips Analysis, Insights and Forecast, 2020-2032
- 7.1. Market Analysis, Insights and Forecast - by Application
- 7.1.1. Somatosensory Interaction
- 7.1.2. Security
- 7.1.3. Smart Driving
- 7.1.4. Volume Measurement
- 7.1.5. Others
- 7.2. Market Analysis, Insights and Forecast - by Types
- 7.2.1. ≤ 2nm
- 7.2.2. 3nm
- 7.2.3. Others
- 7.1. Market Analysis, Insights and Forecast - by Application
- 8. Europe Nano-Photonic Chips Analysis, Insights and Forecast, 2020-2032
- 8.1. Market Analysis, Insights and Forecast - by Application
- 8.1.1. Somatosensory Interaction
- 8.1.2. Security
- 8.1.3. Smart Driving
- 8.1.4. Volume Measurement
- 8.1.5. Others
- 8.2. Market Analysis, Insights and Forecast - by Types
- 8.2.1. ≤ 2nm
- 8.2.2. 3nm
- 8.2.3. Others
- 8.1. Market Analysis, Insights and Forecast - by Application
- 9. Middle East & Africa Nano-Photonic Chips Analysis, Insights and Forecast, 2020-2032
- 9.1. Market Analysis, Insights and Forecast - by Application
- 9.1.1. Somatosensory Interaction
- 9.1.2. Security
- 9.1.3. Smart Driving
- 9.1.4. Volume Measurement
- 9.1.5. Others
- 9.2. Market Analysis, Insights and Forecast - by Types
- 9.2.1. ≤ 2nm
- 9.2.2. 3nm
- 9.2.3. Others
- 9.1. Market Analysis, Insights and Forecast - by Application
- 10. Asia Pacific Nano-Photonic Chips Analysis, Insights and Forecast, 2020-2032
- 10.1. Market Analysis, Insights and Forecast - by Application
- 10.1.1. Somatosensory Interaction
- 10.1.2. Security
- 10.1.3. Smart Driving
- 10.1.4. Volume Measurement
- 10.1.5. Others
- 10.2. Market Analysis, Insights and Forecast - by Types
- 10.2.1. ≤ 2nm
- 10.2.2. 3nm
- 10.2.3. Others
- 10.1. Market Analysis, Insights and Forecast - by Application
- 11. Competitive Analysis
- 11.1. Global Market Share Analysis 2025
- 11.2. Company Profiles
- 11.2.1 Intel
- 11.2.1.1. Overview
- 11.2.1.2. Products
- 11.2.1.3. SWOT Analysis
- 11.2.1.4. Recent Developments
- 11.2.1.5. Financials (Based on Availability)
- 11.2.2 LioniX International
- 11.2.2.1. Overview
- 11.2.2.2. Products
- 11.2.2.3. SWOT Analysis
- 11.2.2.4. Recent Developments
- 11.2.2.5. Financials (Based on Availability)
- 11.2.3 NeoPhotonics (Lumentum)
- 11.2.3.1. Overview
- 11.2.3.2. Products
- 11.2.3.3. SWOT Analysis
- 11.2.3.4. Recent Developments
- 11.2.3.5. Financials (Based on Availability)
- 11.2.4 IBM
- 11.2.4.1. Overview
- 11.2.4.2. Products
- 11.2.4.3. SWOT Analysis
- 11.2.4.4. Recent Developments
- 11.2.4.5. Financials (Based on Availability)
- 11.2.5 Broadcom
- 11.2.5.1. Overview
- 11.2.5.2. Products
- 11.2.5.3. SWOT Analysis
- 11.2.5.4. Recent Developments
- 11.2.5.5. Financials (Based on Availability)
- 11.2.6 Nokia
- 11.2.6.1. Overview
- 11.2.6.2. Products
- 11.2.6.3. SWOT Analysis
- 11.2.6.4. Recent Developments
- 11.2.6.5. Financials (Based on Availability)
- 11.2.7 Deptrum
- 11.2.7.1. Overview
- 11.2.7.2. Products
- 11.2.7.3. SWOT Analysis
- 11.2.7.4. Recent Developments
- 11.2.7.5. Financials (Based on Availability)
- 11.2.8 Ciena
- 11.2.8.1. Overview
- 11.2.8.2. Products
- 11.2.8.3. SWOT Analysis
- 11.2.8.4. Recent Developments
- 11.2.8.5. Financials (Based on Availability)
- 11.2.9 Lumentum Holdings
- 11.2.9.1. Overview
- 11.2.9.2. Products
- 11.2.9.3. SWOT Analysis
- 11.2.9.4. Recent Developments
- 11.2.9.5. Financials (Based on Availability)
- 11.2.10 Wuhan Accelink Technology
- 11.2.10.1. Overview
- 11.2.10.2. Products
- 11.2.10.3. SWOT Analysis
- 11.2.10.4. Recent Developments
- 11.2.10.5. Financials (Based on Availability)
- 11.2.11 Taiwan Semiconductor Manufacturing
- 11.2.11.1. Overview
- 11.2.11.2. Products
- 11.2.11.3. SWOT Analysis
- 11.2.11.4. Recent Developments
- 11.2.11.5. Financials (Based on Availability)
- 11.2.12 Sai MicroElectronics
- 11.2.12.1. Overview
- 11.2.12.2. Products
- 11.2.12.3. SWOT Analysis
- 11.2.12.4. Recent Developments
- 11.2.12.5. Financials (Based on Availability)
- 11.2.1 Intel
List of Figures
- Figure 1: Global Nano-Photonic Chips Revenue Breakdown (undefined, %) by Region 2025 & 2033
- Figure 2: Global Nano-Photonic Chips Volume Breakdown (K, %) by Region 2025 & 2033
- Figure 3: North America Nano-Photonic Chips Revenue (undefined), by Application 2025 & 2033
- Figure 4: North America Nano-Photonic Chips Volume (K), by Application 2025 & 2033
- Figure 5: North America Nano-Photonic Chips Revenue Share (%), by Application 2025 & 2033
- Figure 6: North America Nano-Photonic Chips Volume Share (%), by Application 2025 & 2033
- Figure 7: North America Nano-Photonic Chips Revenue (undefined), by Types 2025 & 2033
- Figure 8: North America Nano-Photonic Chips Volume (K), by Types 2025 & 2033
- Figure 9: North America Nano-Photonic Chips Revenue Share (%), by Types 2025 & 2033
- Figure 10: North America Nano-Photonic Chips Volume Share (%), by Types 2025 & 2033
- Figure 11: North America Nano-Photonic Chips Revenue (undefined), by Country 2025 & 2033
- Figure 12: North America Nano-Photonic Chips Volume (K), by Country 2025 & 2033
- Figure 13: North America Nano-Photonic Chips Revenue Share (%), by Country 2025 & 2033
- Figure 14: North America Nano-Photonic Chips Volume Share (%), by Country 2025 & 2033
- Figure 15: South America Nano-Photonic Chips Revenue (undefined), by Application 2025 & 2033
- Figure 16: South America Nano-Photonic Chips Volume (K), by Application 2025 & 2033
- Figure 17: South America Nano-Photonic Chips Revenue Share (%), by Application 2025 & 2033
- Figure 18: South America Nano-Photonic Chips Volume Share (%), by Application 2025 & 2033
- Figure 19: South America Nano-Photonic Chips Revenue (undefined), by Types 2025 & 2033
- Figure 20: South America Nano-Photonic Chips Volume (K), by Types 2025 & 2033
- Figure 21: South America Nano-Photonic Chips Revenue Share (%), by Types 2025 & 2033
- Figure 22: South America Nano-Photonic Chips Volume Share (%), by Types 2025 & 2033
- Figure 23: South America Nano-Photonic Chips Revenue (undefined), by Country 2025 & 2033
- Figure 24: South America Nano-Photonic Chips Volume (K), by Country 2025 & 2033
- Figure 25: South America Nano-Photonic Chips Revenue Share (%), by Country 2025 & 2033
- Figure 26: South America Nano-Photonic Chips Volume Share (%), by Country 2025 & 2033
- Figure 27: Europe Nano-Photonic Chips Revenue (undefined), by Application 2025 & 2033
- Figure 28: Europe Nano-Photonic Chips Volume (K), by Application 2025 & 2033
- Figure 29: Europe Nano-Photonic Chips Revenue Share (%), by Application 2025 & 2033
- Figure 30: Europe Nano-Photonic Chips Volume Share (%), by Application 2025 & 2033
- Figure 31: Europe Nano-Photonic Chips Revenue (undefined), by Types 2025 & 2033
- Figure 32: Europe Nano-Photonic Chips Volume (K), by Types 2025 & 2033
- Figure 33: Europe Nano-Photonic Chips Revenue Share (%), by Types 2025 & 2033
- Figure 34: Europe Nano-Photonic Chips Volume Share (%), by Types 2025 & 2033
- Figure 35: Europe Nano-Photonic Chips Revenue (undefined), by Country 2025 & 2033
- Figure 36: Europe Nano-Photonic Chips Volume (K), by Country 2025 & 2033
- Figure 37: Europe Nano-Photonic Chips Revenue Share (%), by Country 2025 & 2033
- Figure 38: Europe Nano-Photonic Chips Volume Share (%), by Country 2025 & 2033
- Figure 39: Middle East & Africa Nano-Photonic Chips Revenue (undefined), by Application 2025 & 2033
- Figure 40: Middle East & Africa Nano-Photonic Chips Volume (K), by Application 2025 & 2033
- Figure 41: Middle East & Africa Nano-Photonic Chips Revenue Share (%), by Application 2025 & 2033
- Figure 42: Middle East & Africa Nano-Photonic Chips Volume Share (%), by Application 2025 & 2033
- Figure 43: Middle East & Africa Nano-Photonic Chips Revenue (undefined), by Types 2025 & 2033
- Figure 44: Middle East & Africa Nano-Photonic Chips Volume (K), by Types 2025 & 2033
- Figure 45: Middle East & Africa Nano-Photonic Chips Revenue Share (%), by Types 2025 & 2033
- Figure 46: Middle East & Africa Nano-Photonic Chips Volume Share (%), by Types 2025 & 2033
- Figure 47: Middle East & Africa Nano-Photonic Chips Revenue (undefined), by Country 2025 & 2033
- Figure 48: Middle East & Africa Nano-Photonic Chips Volume (K), by Country 2025 & 2033
- Figure 49: Middle East & Africa Nano-Photonic Chips Revenue Share (%), by Country 2025 & 2033
- Figure 50: Middle East & Africa Nano-Photonic Chips Volume Share (%), by Country 2025 & 2033
- Figure 51: Asia Pacific Nano-Photonic Chips Revenue (undefined), by Application 2025 & 2033
- Figure 52: Asia Pacific Nano-Photonic Chips Volume (K), by Application 2025 & 2033
- Figure 53: Asia Pacific Nano-Photonic Chips Revenue Share (%), by Application 2025 & 2033
- Figure 54: Asia Pacific Nano-Photonic Chips Volume Share (%), by Application 2025 & 2033
- Figure 55: Asia Pacific Nano-Photonic Chips Revenue (undefined), by Types 2025 & 2033
- Figure 56: Asia Pacific Nano-Photonic Chips Volume (K), by Types 2025 & 2033
- Figure 57: Asia Pacific Nano-Photonic Chips Revenue Share (%), by Types 2025 & 2033
- Figure 58: Asia Pacific Nano-Photonic Chips Volume Share (%), by Types 2025 & 2033
- Figure 59: Asia Pacific Nano-Photonic Chips Revenue (undefined), by Country 2025 & 2033
- Figure 60: Asia Pacific Nano-Photonic Chips Volume (K), by Country 2025 & 2033
- Figure 61: Asia Pacific Nano-Photonic Chips Revenue Share (%), by Country 2025 & 2033
- Figure 62: Asia Pacific Nano-Photonic Chips Volume Share (%), by Country 2025 & 2033
List of Tables
- Table 1: Global Nano-Photonic Chips Revenue undefined Forecast, by Application 2020 & 2033
- Table 2: Global Nano-Photonic Chips Volume K Forecast, by Application 2020 & 2033
- Table 3: Global Nano-Photonic Chips Revenue undefined Forecast, by Types 2020 & 2033
- Table 4: Global Nano-Photonic Chips Volume K Forecast, by Types 2020 & 2033
- Table 5: Global Nano-Photonic Chips Revenue undefined Forecast, by Region 2020 & 2033
- Table 6: Global Nano-Photonic Chips Volume K Forecast, by Region 2020 & 2033
- Table 7: Global Nano-Photonic Chips Revenue undefined Forecast, by Application 2020 & 2033
- Table 8: Global Nano-Photonic Chips Volume K Forecast, by Application 2020 & 2033
- Table 9: Global Nano-Photonic Chips Revenue undefined Forecast, by Types 2020 & 2033
- Table 10: Global Nano-Photonic Chips Volume K Forecast, by Types 2020 & 2033
- Table 11: Global Nano-Photonic Chips Revenue undefined Forecast, by Country 2020 & 2033
- Table 12: Global Nano-Photonic Chips Volume K Forecast, by Country 2020 & 2033
- Table 13: United States Nano-Photonic Chips Revenue (undefined) Forecast, by Application 2020 & 2033
- Table 14: United States Nano-Photonic Chips Volume (K) Forecast, by Application 2020 & 2033
- Table 15: Canada Nano-Photonic Chips Revenue (undefined) Forecast, by Application 2020 & 2033
- Table 16: Canada Nano-Photonic Chips Volume (K) Forecast, by Application 2020 & 2033
- Table 17: Mexico Nano-Photonic Chips Revenue (undefined) Forecast, by Application 2020 & 2033
- Table 18: Mexico Nano-Photonic Chips Volume (K) Forecast, by Application 2020 & 2033
- Table 19: Global Nano-Photonic Chips Revenue undefined Forecast, by Application 2020 & 2033
- Table 20: Global Nano-Photonic Chips Volume K Forecast, by Application 2020 & 2033
- Table 21: Global Nano-Photonic Chips Revenue undefined Forecast, by Types 2020 & 2033
- Table 22: Global Nano-Photonic Chips Volume K Forecast, by Types 2020 & 2033
- Table 23: Global Nano-Photonic Chips Revenue undefined Forecast, by Country 2020 & 2033
- Table 24: Global Nano-Photonic Chips Volume K Forecast, by Country 2020 & 2033
- Table 25: Brazil Nano-Photonic Chips Revenue (undefined) Forecast, by Application 2020 & 2033
- Table 26: Brazil Nano-Photonic Chips Volume (K) Forecast, by Application 2020 & 2033
- Table 27: Argentina Nano-Photonic Chips Revenue (undefined) Forecast, by Application 2020 & 2033
- Table 28: Argentina Nano-Photonic Chips Volume (K) Forecast, by Application 2020 & 2033
- Table 29: Rest of South America Nano-Photonic Chips Revenue (undefined) Forecast, by Application 2020 & 2033
- Table 30: Rest of South America Nano-Photonic Chips Volume (K) Forecast, by Application 2020 & 2033
- Table 31: Global Nano-Photonic Chips Revenue undefined Forecast, by Application 2020 & 2033
- Table 32: Global Nano-Photonic Chips Volume K Forecast, by Application 2020 & 2033
- Table 33: Global Nano-Photonic Chips Revenue undefined Forecast, by Types 2020 & 2033
- Table 34: Global Nano-Photonic Chips Volume K Forecast, by Types 2020 & 2033
- Table 35: Global Nano-Photonic Chips Revenue undefined Forecast, by Country 2020 & 2033
- Table 36: Global Nano-Photonic Chips Volume K Forecast, by Country 2020 & 2033
- Table 37: United Kingdom Nano-Photonic Chips Revenue (undefined) Forecast, by Application 2020 & 2033
- Table 38: United Kingdom Nano-Photonic Chips Volume (K) Forecast, by Application 2020 & 2033
- Table 39: Germany Nano-Photonic Chips Revenue (undefined) Forecast, by Application 2020 & 2033
- Table 40: Germany Nano-Photonic Chips Volume (K) Forecast, by Application 2020 & 2033
- Table 41: France Nano-Photonic Chips Revenue (undefined) Forecast, by Application 2020 & 2033
- Table 42: France Nano-Photonic Chips Volume (K) Forecast, by Application 2020 & 2033
- Table 43: Italy Nano-Photonic Chips Revenue (undefined) Forecast, by Application 2020 & 2033
- Table 44: Italy Nano-Photonic Chips Volume (K) Forecast, by Application 2020 & 2033
- Table 45: Spain Nano-Photonic Chips Revenue (undefined) Forecast, by Application 2020 & 2033
- Table 46: Spain Nano-Photonic Chips Volume (K) Forecast, by Application 2020 & 2033
- Table 47: Russia Nano-Photonic Chips Revenue (undefined) Forecast, by Application 2020 & 2033
- Table 48: Russia Nano-Photonic Chips Volume (K) Forecast, by Application 2020 & 2033
- Table 49: Benelux Nano-Photonic Chips Revenue (undefined) Forecast, by Application 2020 & 2033
- Table 50: Benelux Nano-Photonic Chips Volume (K) Forecast, by Application 2020 & 2033
- Table 51: Nordics Nano-Photonic Chips Revenue (undefined) Forecast, by Application 2020 & 2033
- Table 52: Nordics Nano-Photonic Chips Volume (K) Forecast, by Application 2020 & 2033
- Table 53: Rest of Europe Nano-Photonic Chips Revenue (undefined) Forecast, by Application 2020 & 2033
- Table 54: Rest of Europe Nano-Photonic Chips Volume (K) Forecast, by Application 2020 & 2033
- Table 55: Global Nano-Photonic Chips Revenue undefined Forecast, by Application 2020 & 2033
- Table 56: Global Nano-Photonic Chips Volume K Forecast, by Application 2020 & 2033
- Table 57: Global Nano-Photonic Chips Revenue undefined Forecast, by Types 2020 & 2033
- Table 58: Global Nano-Photonic Chips Volume K Forecast, by Types 2020 & 2033
- Table 59: Global Nano-Photonic Chips Revenue undefined Forecast, by Country 2020 & 2033
- Table 60: Global Nano-Photonic Chips Volume K Forecast, by Country 2020 & 2033
- Table 61: Turkey Nano-Photonic Chips Revenue (undefined) Forecast, by Application 2020 & 2033
- Table 62: Turkey Nano-Photonic Chips Volume (K) Forecast, by Application 2020 & 2033
- Table 63: Israel Nano-Photonic Chips Revenue (undefined) Forecast, by Application 2020 & 2033
- Table 64: Israel Nano-Photonic Chips Volume (K) Forecast, by Application 2020 & 2033
- Table 65: GCC Nano-Photonic Chips Revenue (undefined) Forecast, by Application 2020 & 2033
- Table 66: GCC Nano-Photonic Chips Volume (K) Forecast, by Application 2020 & 2033
- Table 67: North Africa Nano-Photonic Chips Revenue (undefined) Forecast, by Application 2020 & 2033
- Table 68: North Africa Nano-Photonic Chips Volume (K) Forecast, by Application 2020 & 2033
- Table 69: South Africa Nano-Photonic Chips Revenue (undefined) Forecast, by Application 2020 & 2033
- Table 70: South Africa Nano-Photonic Chips Volume (K) Forecast, by Application 2020 & 2033
- Table 71: Rest of Middle East & Africa Nano-Photonic Chips Revenue (undefined) Forecast, by Application 2020 & 2033
- Table 72: Rest of Middle East & Africa Nano-Photonic Chips Volume (K) Forecast, by Application 2020 & 2033
- Table 73: Global Nano-Photonic Chips Revenue undefined Forecast, by Application 2020 & 2033
- Table 74: Global Nano-Photonic Chips Volume K Forecast, by Application 2020 & 2033
- Table 75: Global Nano-Photonic Chips Revenue undefined Forecast, by Types 2020 & 2033
- Table 76: Global Nano-Photonic Chips Volume K Forecast, by Types 2020 & 2033
- Table 77: Global Nano-Photonic Chips Revenue undefined Forecast, by Country 2020 & 2033
- Table 78: Global Nano-Photonic Chips Volume K Forecast, by Country 2020 & 2033
- Table 79: China Nano-Photonic Chips Revenue (undefined) Forecast, by Application 2020 & 2033
- Table 80: China Nano-Photonic Chips Volume (K) Forecast, by Application 2020 & 2033
- Table 81: India Nano-Photonic Chips Revenue (undefined) Forecast, by Application 2020 & 2033
- Table 82: India Nano-Photonic Chips Volume (K) Forecast, by Application 2020 & 2033
- Table 83: Japan Nano-Photonic Chips Revenue (undefined) Forecast, by Application 2020 & 2033
- Table 84: Japan Nano-Photonic Chips Volume (K) Forecast, by Application 2020 & 2033
- Table 85: South Korea Nano-Photonic Chips Revenue (undefined) Forecast, by Application 2020 & 2033
- Table 86: South Korea Nano-Photonic Chips Volume (K) Forecast, by Application 2020 & 2033
- Table 87: ASEAN Nano-Photonic Chips Revenue (undefined) Forecast, by Application 2020 & 2033
- Table 88: ASEAN Nano-Photonic Chips Volume (K) Forecast, by Application 2020 & 2033
- Table 89: Oceania Nano-Photonic Chips Revenue (undefined) Forecast, by Application 2020 & 2033
- Table 90: Oceania Nano-Photonic Chips Volume (K) Forecast, by Application 2020 & 2033
- Table 91: Rest of Asia Pacific Nano-Photonic Chips Revenue (undefined) Forecast, by Application 2020 & 2033
- Table 92: Rest of Asia Pacific Nano-Photonic Chips Volume (K) Forecast, by Application 2020 & 2033
Frequently Asked Questions
1. What is the projected Compound Annual Growth Rate (CAGR) of the Nano-Photonic Chips?
The projected CAGR is approximately 11.91%.
2. Which companies are prominent players in the Nano-Photonic Chips?
Key companies in the market include Intel, LioniX International, NeoPhotonics (Lumentum), IBM, Broadcom, Nokia, Deptrum, Ciena, Lumentum Holdings, Wuhan Accelink Technology, Taiwan Semiconductor Manufacturing, Sai MicroElectronics.
3. What are the main segments of the Nano-Photonic Chips?
The market segments include Application, Types.
4. Can you provide details about the market size?
The market size is estimated to be USD XXX N/A as of 2022.
5. What are some drivers contributing to market growth?
N/A
6. What are the notable trends driving market growth?
N/A
7. Are there any restraints impacting market growth?
N/A
8. Can you provide examples of recent developments in the market?
N/A
9. What pricing options are available for accessing the report?
Pricing options include single-user, multi-user, and enterprise licenses priced at USD 2900.00, USD 4350.00, and USD 5800.00 respectively.
10. Is the market size provided in terms of value or volume?
The market size is provided in terms of value, measured in N/A and volume, measured in K.
11. Are there any specific market keywords associated with the report?
Yes, the market keyword associated with the report is "Nano-Photonic Chips," which aids in identifying and referencing the specific market segment covered.
12. How do I determine which pricing option suits my needs best?
The pricing options vary based on user requirements and access needs. Individual users may opt for single-user licenses, while businesses requiring broader access may choose multi-user or enterprise licenses for cost-effective access to the report.
13. Are there any additional resources or data provided in the Nano-Photonic Chips report?
While the report offers comprehensive insights, it's advisable to review the specific contents or supplementary materials provided to ascertain if additional resources or data are available.
14. How can I stay updated on further developments or reports in the Nano-Photonic Chips?
To stay informed about further developments, trends, and reports in the Nano-Photonic Chips, consider subscribing to industry newsletters, following relevant companies and organizations, or regularly checking reputable industry news sources and publications.
Methodology
Step 1 - Identification of Relevant Samples Size from Population Database


Step 2 - Approaches for Defining Global Market Size (Value, Volume* & Price*)

Note*: In applicable scenarios
Step 3 - Data Sources
Primary Research
- Web Analytics
- Survey Reports
- Research Institute
- Latest Research Reports
- Opinion Leaders
Secondary Research
- Annual Reports
- White Paper
- Latest Press Release
- Industry Association
- Paid Database
- Investor Presentations

Step 4 - Data Triangulation
Involves using different sources of information in order to increase the validity of a study
These sources are likely to be stakeholders in a program - participants, other researchers, program staff, other community members, and so on.
Then we put all data in single framework & apply various statistical tools to find out the dynamic on the market.
During the analysis stage, feedback from the stakeholder groups would be compared to determine areas of agreement as well as areas of divergence

