

Key Insights
The North American e-cigarette market, a dynamic segment within the global vaping industry, is experiencing robust growth, fueled by several key factors. The market's substantial size and a compound annual growth rate (CAGR) of 17.60% from 2019-2024 indicates significant potential for expansion through 2033. This growth is primarily driven by increasing awareness of e-cigarettes as a potential harm reduction tool for smokers, combined with a wide array of product options catering to diverse consumer preferences. The market segmentation reveals a strong demand for both disposable and rechargeable devices, with automatic e-cigarettes likely commanding a larger market share due to their user-friendliness. However, the market faces challenges including stringent regulatory environments, particularly in the United States, which aim to curb youth vaping and potentially restrict product availability. Further, concerns regarding the long-term health effects of vaping continue to be a significant restraint. Despite these challenges, the market's substantial size and continued innovation in product design and functionality suggest a positive growth trajectory, particularly within the segments of rechargeable but disposable cartomizers and personalized vaporizers, which cater to evolving consumer needs and preferences.
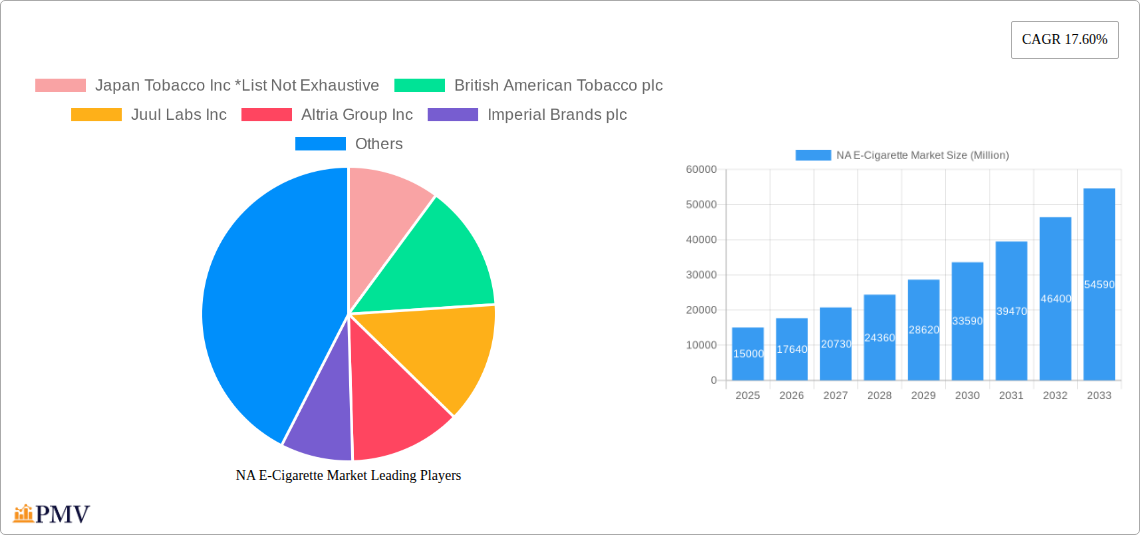
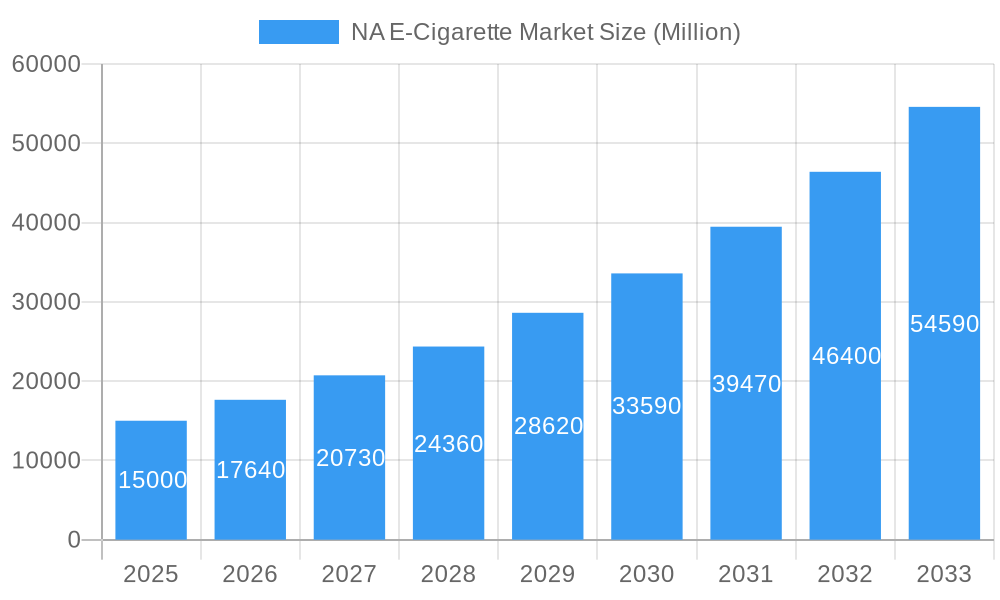
NA E-Cigarette Market Market Size (In Billion)
Despite regulatory hurdles, the North American e-cigarette market exhibits significant potential for sustained growth. Major players like Japan Tobacco Inc., British American Tobacco plc, Juul Labs Inc., Altria Group Inc., and Imperial Brands plc are actively competing in this lucrative space, driving innovation and market expansion. The increasing popularity of vaping as an alternative to traditional smoking continues to fuel demand, particularly among adult smokers looking to transition away from combustible cigarettes. However, targeted marketing efforts and further research addressing health concerns are crucial to maintain the market's sustainable growth. The market is expected to be significantly shaped by the ongoing evolution of regulations, consumer preferences toward specific product types (disposable vs. rechargeable), and emerging trends in vaping technology. Specific regional market shares within North America (e.g., U.S. vs. Canada) will depend on the varying levels of regulation and public perception across states and provinces.
NA E-Cigarette Market Company Market Share
North American E-Cigarette Market: A Comprehensive Report (2019-2033)
This detailed report provides a comprehensive analysis of the North American e-cigarette market, offering invaluable insights for industry stakeholders, investors, and strategic decision-makers. Covering the period from 2019 to 2033, with 2025 as the base year, this research meticulously examines market structure, competitive dynamics, growth drivers, challenges, and future outlook. The report segments the market by battery mode (Automatic and Manual E-cigarettes) and product type (Completely Disposable Model, Rechargeable but Disposable Cartomizer, and Personalized Vaporizer), providing granular analysis and accurate forecasts. The projected market value for 2025 is estimated at xx Million, with a Compound Annual Growth Rate (CAGR) of xx% during the forecast period (2025-2033).
NA E-Cigarette Market Structure & Competitive Dynamics
The North American e-cigarette market exhibits a dynamic competitive landscape characterized by a mix of established players and emerging startups. Market concentration is moderate, with a few major players holding significant market share, while numerous smaller companies compete in niche segments. Innovation ecosystems are robust, driven by continuous advancements in battery technology, e-liquid formulations, and device design. Regulatory frameworks, however, remain a significant influence, varying across states and provinces, creating complexities for companies operating nationwide. Product substitutes, such as traditional cigarettes and other nicotine delivery systems, continue to exert pressure, while end-user trends toward healthier alternatives and increased regulation impact market growth. Mergers and acquisitions (M&A) activity has been substantial in recent years, with deal values exceeding xx Million in the period 2019-2024, reflecting consolidation and expansion strategies.
- Market Concentration: Moderate, with top 5 players holding approximately xx% of market share (2025).
- Innovation Ecosystems: Strong emphasis on battery technology, e-liquid flavors, and device aesthetics.
- Regulatory Frameworks: Complex and varying across jurisdictions, impacting market access and product development.
- M&A Activity: Significant activity in the historical period (2019-2024), with total deal values exceeding xx Million.
- End-User Trends: Shifting towards healthier alternatives and preference for specific device types (e.g., disposable vapes).
NA E-Cigarette Market Industry Trends & Insights
The North American e-cigarette market is characterized by several key trends. Growth is driven by factors such as increasing awareness of e-cigarettes as a potential alternative to traditional cigarettes, the appeal of diverse flavors and nicotine strengths, and the convenience of various device types. Technological disruptions, including advancements in battery technology and e-liquid formulations, continuously shape the market landscape. Consumer preferences are increasingly influenced by health concerns, regulatory changes, and social perceptions. Competitive dynamics are intense, fueled by product innovation, aggressive marketing strategies, and price competition. Market penetration of e-cigarettes remains significant, especially among younger adult populations, although varying greatly across demographics.
Dominant Markets & Segments in NA E-Cigarette Market
The dominant segment within the North American e-cigarette market is the Completely Disposable Model, driven by its convenience and affordability. The US represents the largest national market, followed by Canada.
By Battery Mode:
- Automatic E-Cigarettes: Dominated by ease of use, leading to higher market penetration among novice users. Market size (2025) estimated at xx Million.
- Manual E-Cigarettes: Appeals to experienced vapers who value customization and control over vaping experience. Market size (2025) estimated at xx Million.
By Product:
- Completely Disposable Model: High convenience and low cost makes this the leading segment. Market size (2025) estimated at xx Million.
- Rechargeable but Disposable Cartomizer: Balances convenience with cost-effectiveness, attracting a significant user base. Market size (2025) estimated at xx Million.
- Personalized Vaporizer: Caters to advanced users seeking customization and performance. Market size (2025) estimated at xx Million.
Key Drivers of Dominance:
- Convenience: Disposable devices offer simplicity and ease of use.
- Affordability: Disposable options are generally less expensive than reusable devices.
- Flavor Variety: Wide range of flavors caters to diverse consumer preferences.
NA E-Cigarette Market Product Innovations
Recent innovations in the e-cigarette market focus on enhanced battery life, improved flavor delivery systems, and safer materials. Companies are emphasizing closed-system devices for greater control over e-liquid composition and nicotine levels. Technological advancements continue to drive the development of more discreet and aesthetically pleasing devices. This focus on user experience and safety contributes to increased market acceptance and potentially higher market penetration.
Report Segmentation & Scope
This report provides a detailed segmentation of the North American e-cigarette market based on battery mode (Automatic and Manual) and product type (Completely Disposable Model, Rechargeable but Disposable Cartomizer, and Personalized Vaporizer). Each segment includes analysis of market size, growth projections, competitive landscape, and key trends. Growth projections for each segment are detailed within the full report, incorporating various scenarios reflecting potential regulatory changes and consumer behavior shifts.
Key Drivers of NA E-Cigarette Market Growth
The North American e-cigarette market's growth is fueled by several factors: the perception of e-cigarettes as a less harmful alternative to traditional cigarettes, increasing consumer awareness, technological advancements leading to improved device performance and safety, and the expanding availability of diverse flavors and nicotine strengths. Furthermore, aggressive marketing and branding strategies by major players have played a significant role in market expansion.
Challenges in the NA E-Cigarette Market Sector
The NA e-cigarette market faces significant challenges including stringent regulations impacting product availability and marketing, concerns regarding the long-term health effects of vaping, and intense competition leading to price wars and reduced profit margins. Supply chain disruptions and rising costs of raw materials also pose considerable obstacles. These challenges have contributed to market volatility and uncertainty.
Leading Players in the NA E-Cigarette Market Market
Key Developments in NA E-Cigarette Market Sector
- 2020-01: Increased FDA regulation on e-cigarette flavors.
- 2021-10: Launch of a new nicotine-free e-cigarette product by a major player.
- 2022-05: Significant M&A activity amongst leading companies reshaping market landscape.
- 2023-08: Implementation of new taxation policies in several states impacting market prices.
Strategic NA E-Cigarette Market Outlook
The future of the North American e-cigarette market presents both opportunities and challenges. Continued innovation in product design and e-liquid formulations will drive growth. However, the market’s trajectory will significantly depend on evolving regulatory landscapes, consumer perceptions of health risks, and the success of public health initiatives aimed at reducing smoking rates. Strategic partnerships and collaborations will be essential for companies to navigate these complexities and achieve long-term success.
NA E-Cigarette Market Segmentation
-
1. Product
- 1.1. Completely Disposable Model
- 1.2. Rechargeable but Disposable Cartomizer
- 1.3. Personalized Vaporizer
-
2. Battery Mode
- 2.1. Automatic E-Cigarette
- 2.2. Manual E-Cigarette
-
3. Geography
- 3.1. United States
- 3.2. Canada
- 3.3. Rest of North America
NA E-Cigarette Market Segmentation By Geography
- 1. United States
- 2. Canada
- 3. Rest of North America
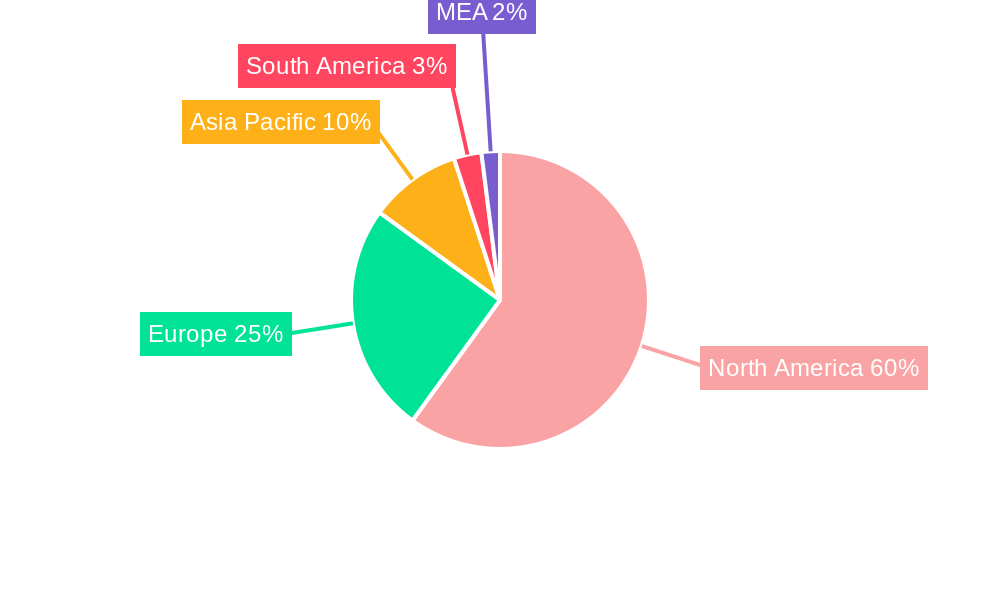
NA E-Cigarette Market Regional Market Share
Geographic Coverage of NA E-Cigarette Market
NA E-Cigarette Market REPORT HIGHLIGHTS
| Aspects | Details |
|---|---|
| Study Period | 2020-2034 |
| Base Year | 2025 |
| Estimated Year | 2026 |
| Forecast Period | 2026-2034 |
| Historical Period | 2020-2025 |
| Growth Rate | CAGR of 17.60% from 2020-2034 |
| Segmentation |
|
Table of Contents
- 1. Introduction
- 1.1. Research Scope
- 1.2. Market Segmentation
- 1.3. Research Objective
- 1.4. Definitions and Assumptions
- 2. Executive Summary
- 2.1. Market Snapshot
- 3. Market Dynamics
- 3.1. Market Drivers
- 3.2. Market Restrains
- 3.3. Market Trends
- 3.4. Market Opportunities
- 4. Market Factor Analysis
- 4.1. Porters Five Forces
- 4.1.1. Bargaining Power of Suppliers
- 4.1.2. Bargaining Power of Buyers
- 4.1.3. Threat of New Entrants
- 4.1.4. Threat of Substitutes
- 4.1.5. Competitive Rivalry
- 4.2. PESTEL analysis
- 4.3. BCG Analysis
- 4.3.1. Stars (High Growth, High Market Share)
- 4.3.2. Cash Cows (Low Growth, High Market Share)
- 4.3.3. Question Mark (High Growth, Low Market Share)
- 4.3.4. Dogs (Low Growth, Low Market Share)
- 4.4. Ansoff Matrix Analysis
- 4.5. Supply Chain Analysis
- 4.6. Regulatory Landscape
- 4.7. Current Market Potential and Opportunity Assessment (TAM–SAM–SOM Framework)
- 4.8. PMV Analyst Note
- 4.1. Porters Five Forces
- 5. Market Analysis, Insights and Forecast 2021-2033
- 5.1. Market Analysis, Insights and Forecast - by Product
- 5.1.1. Completely Disposable Model
- 5.1.2. Rechargeable but Disposable Cartomizer
- 5.1.3. Personalized Vaporizer
- 5.2. Market Analysis, Insights and Forecast - by Battery Mode
- 5.2.1. Automatic E-Cigarette
- 5.2.2. Manual E-Cigarette
- 5.3. Market Analysis, Insights and Forecast - by Geography
- 5.3.1. United States
- 5.3.2. Canada
- 5.3.3. Rest of North America
- 5.4. Market Analysis, Insights and Forecast - by Region
- 5.4.1. United States
- 5.4.2. Canada
- 5.4.3. Rest of North America
- 5.1. Market Analysis, Insights and Forecast - by Product
- 6. Global NA E-Cigarette Market Analysis, Insights and Forecast, 2021-2033
- 6.1. Market Analysis, Insights and Forecast - by Product
- 6.1.1. Completely Disposable Model
- 6.1.2. Rechargeable but Disposable Cartomizer
- 6.1.3. Personalized Vaporizer
- 6.2. Market Analysis, Insights and Forecast - by Battery Mode
- 6.2.1. Automatic E-Cigarette
- 6.2.2. Manual E-Cigarette
- 6.3. Market Analysis, Insights and Forecast - by Geography
- 6.3.1. United States
- 6.3.2. Canada
- 6.3.3. Rest of North America
- 6.1. Market Analysis, Insights and Forecast - by Product
- 7. United States NA E-Cigarette Market Analysis, Insights and Forecast, 2020-2032
- 7.1. Market Analysis, Insights and Forecast - by Product
- 7.1.1. Completely Disposable Model
- 7.1.2. Rechargeable but Disposable Cartomizer
- 7.1.3. Personalized Vaporizer
- 7.2. Market Analysis, Insights and Forecast - by Battery Mode
- 7.2.1. Automatic E-Cigarette
- 7.2.2. Manual E-Cigarette
- 7.3. Market Analysis, Insights and Forecast - by Geography
- 7.3.1. United States
- 7.3.2. Canada
- 7.3.3. Rest of North America
- 7.1. Market Analysis, Insights and Forecast - by Product
- 8. Canada NA E-Cigarette Market Analysis, Insights and Forecast, 2020-2032
- 8.1. Market Analysis, Insights and Forecast - by Product
- 8.1.1. Completely Disposable Model
- 8.1.2. Rechargeable but Disposable Cartomizer
- 8.1.3. Personalized Vaporizer
- 8.2. Market Analysis, Insights and Forecast - by Battery Mode
- 8.2.1. Automatic E-Cigarette
- 8.2.2. Manual E-Cigarette
- 8.3. Market Analysis, Insights and Forecast - by Geography
- 8.3.1. United States
- 8.3.2. Canada
- 8.3.3. Rest of North America
- 8.1. Market Analysis, Insights and Forecast - by Product
- 9. Rest of North America NA E-Cigarette Market Analysis, Insights and Forecast, 2020-2032
- 9.1. Market Analysis, Insights and Forecast - by Product
- 9.1.1. Completely Disposable Model
- 9.1.2. Rechargeable but Disposable Cartomizer
- 9.1.3. Personalized Vaporizer
- 9.2. Market Analysis, Insights and Forecast - by Battery Mode
- 9.2.1. Automatic E-Cigarette
- 9.2.2. Manual E-Cigarette
- 9.3. Market Analysis, Insights and Forecast - by Geography
- 9.3.1. United States
- 9.3.2. Canada
- 9.3.3. Rest of North America
- 9.1. Market Analysis, Insights and Forecast - by Product
- 10. Competitive Analysis
- 10.1. Company Profiles
- 10.1.1 Japan Tobacco Inc *List Not Exhaustive
- 10.1.1.1. Company Overview
- 10.1.1.2. Products
- 10.1.1.3. Company Financials
- 10.1.1.4. SWOT Analysis
- 10.1.2 British American Tobacco plc
- 10.1.2.1. Company Overview
- 10.1.2.2. Products
- 10.1.2.3. Company Financials
- 10.1.2.4. SWOT Analysis
- 10.1.3 Juul Labs Inc
- 10.1.3.1. Company Overview
- 10.1.3.2. Products
- 10.1.3.3. Company Financials
- 10.1.3.4. SWOT Analysis
- 10.1.4 Altria Group Inc
- 10.1.4.1. Company Overview
- 10.1.4.2. Products
- 10.1.4.3. Company Financials
- 10.1.4.4. SWOT Analysis
- 10.1.5 Imperial Brands plc
- 10.1.5.1. Company Overview
- 10.1.5.2. Products
- 10.1.5.3. Company Financials
- 10.1.5.4. SWOT Analysis
- 10.1.1 Japan Tobacco Inc *List Not Exhaustive
- 10.2. Market Entropy
- 10.2.1 Company's Key Areas Served
- 10.2.2 Recent Developments
- 10.3. Company Market Share Analysis 2025
- 10.3.1 Top 5 Companies Market Share Analysis
- 10.3.2 Top 3 Companies Market Share Analysis
- 10.4. List of Potential Customers
- 11. Research Methodology
List of Figures
- Figure 1: Global NA E-Cigarette Market Revenue Breakdown (Million, %) by Region 2025 & 2033
- Figure 2: Global NA E-Cigarette Market Volume Breakdown (K Units, %) by Region 2025 & 2033
- Figure 3: United States NA E-Cigarette Market Revenue (Million), by Product 2025 & 2033
- Figure 4: United States NA E-Cigarette Market Volume (K Units), by Product 2025 & 2033
- Figure 5: United States NA E-Cigarette Market Revenue Share (%), by Product 2025 & 2033
- Figure 6: United States NA E-Cigarette Market Volume Share (%), by Product 2025 & 2033
- Figure 7: United States NA E-Cigarette Market Revenue (Million), by Battery Mode 2025 & 2033
- Figure 8: United States NA E-Cigarette Market Volume (K Units), by Battery Mode 2025 & 2033
- Figure 9: United States NA E-Cigarette Market Revenue Share (%), by Battery Mode 2025 & 2033
- Figure 10: United States NA E-Cigarette Market Volume Share (%), by Battery Mode 2025 & 2033
- Figure 11: United States NA E-Cigarette Market Revenue (Million), by Geography 2025 & 2033
- Figure 12: United States NA E-Cigarette Market Volume (K Units), by Geography 2025 & 2033
- Figure 13: United States NA E-Cigarette Market Revenue Share (%), by Geography 2025 & 2033
- Figure 14: United States NA E-Cigarette Market Volume Share (%), by Geography 2025 & 2033
- Figure 15: United States NA E-Cigarette Market Revenue (Million), by Country 2025 & 2033
- Figure 16: United States NA E-Cigarette Market Volume (K Units), by Country 2025 & 2033
- Figure 17: United States NA E-Cigarette Market Revenue Share (%), by Country 2025 & 2033
- Figure 18: United States NA E-Cigarette Market Volume Share (%), by Country 2025 & 2033
- Figure 19: Canada NA E-Cigarette Market Revenue (Million), by Product 2025 & 2033
- Figure 20: Canada NA E-Cigarette Market Volume (K Units), by Product 2025 & 2033
- Figure 21: Canada NA E-Cigarette Market Revenue Share (%), by Product 2025 & 2033
- Figure 22: Canada NA E-Cigarette Market Volume Share (%), by Product 2025 & 2033
- Figure 23: Canada NA E-Cigarette Market Revenue (Million), by Battery Mode 2025 & 2033
- Figure 24: Canada NA E-Cigarette Market Volume (K Units), by Battery Mode 2025 & 2033
- Figure 25: Canada NA E-Cigarette Market Revenue Share (%), by Battery Mode 2025 & 2033
- Figure 26: Canada NA E-Cigarette Market Volume Share (%), by Battery Mode 2025 & 2033
- Figure 27: Canada NA E-Cigarette Market Revenue (Million), by Geography 2025 & 2033
- Figure 28: Canada NA E-Cigarette Market Volume (K Units), by Geography 2025 & 2033
- Figure 29: Canada NA E-Cigarette Market Revenue Share (%), by Geography 2025 & 2033
- Figure 30: Canada NA E-Cigarette Market Volume Share (%), by Geography 2025 & 2033
- Figure 31: Canada NA E-Cigarette Market Revenue (Million), by Country 2025 & 2033
- Figure 32: Canada NA E-Cigarette Market Volume (K Units), by Country 2025 & 2033
- Figure 33: Canada NA E-Cigarette Market Revenue Share (%), by Country 2025 & 2033
- Figure 34: Canada NA E-Cigarette Market Volume Share (%), by Country 2025 & 2033
- Figure 35: Rest of North America NA E-Cigarette Market Revenue (Million), by Product 2025 & 2033
- Figure 36: Rest of North America NA E-Cigarette Market Volume (K Units), by Product 2025 & 2033
- Figure 37: Rest of North America NA E-Cigarette Market Revenue Share (%), by Product 2025 & 2033
- Figure 38: Rest of North America NA E-Cigarette Market Volume Share (%), by Product 2025 & 2033
- Figure 39: Rest of North America NA E-Cigarette Market Revenue (Million), by Battery Mode 2025 & 2033
- Figure 40: Rest of North America NA E-Cigarette Market Volume (K Units), by Battery Mode 2025 & 2033
- Figure 41: Rest of North America NA E-Cigarette Market Revenue Share (%), by Battery Mode 2025 & 2033
- Figure 42: Rest of North America NA E-Cigarette Market Volume Share (%), by Battery Mode 2025 & 2033
- Figure 43: Rest of North America NA E-Cigarette Market Revenue (Million), by Geography 2025 & 2033
- Figure 44: Rest of North America NA E-Cigarette Market Volume (K Units), by Geography 2025 & 2033
- Figure 45: Rest of North America NA E-Cigarette Market Revenue Share (%), by Geography 2025 & 2033
- Figure 46: Rest of North America NA E-Cigarette Market Volume Share (%), by Geography 2025 & 2033
- Figure 47: Rest of North America NA E-Cigarette Market Revenue (Million), by Country 2025 & 2033
- Figure 48: Rest of North America NA E-Cigarette Market Volume (K Units), by Country 2025 & 2033
- Figure 49: Rest of North America NA E-Cigarette Market Revenue Share (%), by Country 2025 & 2033
- Figure 50: Rest of North America NA E-Cigarette Market Volume Share (%), by Country 2025 & 2033
List of Tables
- Table 1: Global NA E-Cigarette Market Revenue Million Forecast, by Product 2020 & 2033
- Table 2: Global NA E-Cigarette Market Volume K Units Forecast, by Product 2020 & 2033
- Table 3: Global NA E-Cigarette Market Revenue Million Forecast, by Battery Mode 2020 & 2033
- Table 4: Global NA E-Cigarette Market Volume K Units Forecast, by Battery Mode 2020 & 2033
- Table 5: Global NA E-Cigarette Market Revenue Million Forecast, by Geography 2020 & 2033
- Table 6: Global NA E-Cigarette Market Volume K Units Forecast, by Geography 2020 & 2033
- Table 7: Global NA E-Cigarette Market Revenue Million Forecast, by Region 2020 & 2033
- Table 8: Global NA E-Cigarette Market Volume K Units Forecast, by Region 2020 & 2033
- Table 9: Global NA E-Cigarette Market Revenue Million Forecast, by Product 2020 & 2033
- Table 10: Global NA E-Cigarette Market Volume K Units Forecast, by Product 2020 & 2033
- Table 11: Global NA E-Cigarette Market Revenue Million Forecast, by Battery Mode 2020 & 2033
- Table 12: Global NA E-Cigarette Market Volume K Units Forecast, by Battery Mode 2020 & 2033
- Table 13: Global NA E-Cigarette Market Revenue Million Forecast, by Geography 2020 & 2033
- Table 14: Global NA E-Cigarette Market Volume K Units Forecast, by Geography 2020 & 2033
- Table 15: Global NA E-Cigarette Market Revenue Million Forecast, by Country 2020 & 2033
- Table 16: Global NA E-Cigarette Market Volume K Units Forecast, by Country 2020 & 2033
- Table 17: Global NA E-Cigarette Market Revenue Million Forecast, by Product 2020 & 2033
- Table 18: Global NA E-Cigarette Market Volume K Units Forecast, by Product 2020 & 2033
- Table 19: Global NA E-Cigarette Market Revenue Million Forecast, by Battery Mode 2020 & 2033
- Table 20: Global NA E-Cigarette Market Volume K Units Forecast, by Battery Mode 2020 & 2033
- Table 21: Global NA E-Cigarette Market Revenue Million Forecast, by Geography 2020 & 2033
- Table 22: Global NA E-Cigarette Market Volume K Units Forecast, by Geography 2020 & 2033
- Table 23: Global NA E-Cigarette Market Revenue Million Forecast, by Country 2020 & 2033
- Table 24: Global NA E-Cigarette Market Volume K Units Forecast, by Country 2020 & 2033
- Table 25: Global NA E-Cigarette Market Revenue Million Forecast, by Product 2020 & 2033
- Table 26: Global NA E-Cigarette Market Volume K Units Forecast, by Product 2020 & 2033
- Table 27: Global NA E-Cigarette Market Revenue Million Forecast, by Battery Mode 2020 & 2033
- Table 28: Global NA E-Cigarette Market Volume K Units Forecast, by Battery Mode 2020 & 2033
- Table 29: Global NA E-Cigarette Market Revenue Million Forecast, by Geography 2020 & 2033
- Table 30: Global NA E-Cigarette Market Volume K Units Forecast, by Geography 2020 & 2033
- Table 31: Global NA E-Cigarette Market Revenue Million Forecast, by Country 2020 & 2033
- Table 32: Global NA E-Cigarette Market Volume K Units Forecast, by Country 2020 & 2033
Frequently Asked Questions
1. What is the projected Compound Annual Growth Rate (CAGR) of the NA E-Cigarette Market?
The projected CAGR is approximately 17.60%.
2. Which companies are prominent players in the NA E-Cigarette Market?
Key companies in the market include Japan Tobacco Inc *List Not Exhaustive, British American Tobacco plc, Juul Labs Inc, Altria Group Inc, Imperial Brands plc.
3. What are the main segments of the NA E-Cigarette Market?
The market segments include Product, Battery Mode, Geography.
4. Can you provide details about the market size?
The market size is estimated to be USD XX Million as of 2022.
5. What are some drivers contributing to market growth?
Aggressive Social Media Marketing; Lower-risk Factor Associated with the Use of E-Cigarettes Compared to Conventional/Combustible Cigarettes.
6. What are the notable trends driving market growth?
Rising consumption by the young population.
7. Are there any restraints impacting market growth?
Government Initiatives to Ban Disposable E-Cigarettes.
8. Can you provide examples of recent developments in the market?
N/A
9. What pricing options are available for accessing the report?
Pricing options include single-user, multi-user, and enterprise licenses priced at USD 4750, USD 5250, and USD 8750 respectively.
10. Is the market size provided in terms of value or volume?
The market size is provided in terms of value, measured in Million and volume, measured in K Units.
11. Are there any specific market keywords associated with the report?
Yes, the market keyword associated with the report is "NA E-Cigarette Market," which aids in identifying and referencing the specific market segment covered.
12. How do I determine which pricing option suits my needs best?
The pricing options vary based on user requirements and access needs. Individual users may opt for single-user licenses, while businesses requiring broader access may choose multi-user or enterprise licenses for cost-effective access to the report.
13. Are there any additional resources or data provided in the NA E-Cigarette Market report?
While the report offers comprehensive insights, it's advisable to review the specific contents or supplementary materials provided to ascertain if additional resources or data are available.
14. How can I stay updated on further developments or reports in the NA E-Cigarette Market?
To stay informed about further developments, trends, and reports in the NA E-Cigarette Market, consider subscribing to industry newsletters, following relevant companies and organizations, or regularly checking reputable industry news sources and publications.
Methodology
Step 1 - Identification of Relevant Samples Size from Population Database


Step 2 - Approaches for Defining Global Market Size (Value, Volume* & Price*)

Note*: In applicable scenarios
Step 3 - Data Sources
Primary Research
- Web Analytics
- Survey Reports
- Research Institute
- Latest Research Reports
- Opinion Leaders
Secondary Research
- Annual Reports
- White Paper
- Latest Press Release
- Industry Association
- Paid Database
- Investor Presentations

Step 4 - Data Triangulation
Involves using different sources of information in order to increase the validity of a study
These sources are likely to be stakeholders in a program - participants, other researchers, program staff, other community members, and so on.
Then we put all data in single framework & apply various statistical tools to find out the dynamic on the market.
During the analysis stage, feedback from the stakeholder groups would be compared to determine areas of agreement as well as areas of divergence