
Key Insights
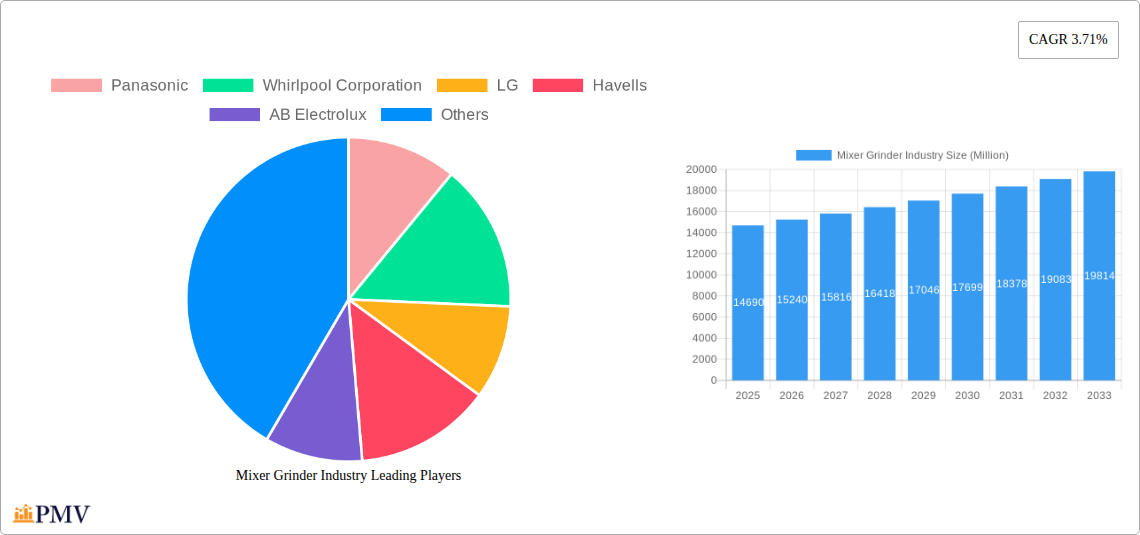
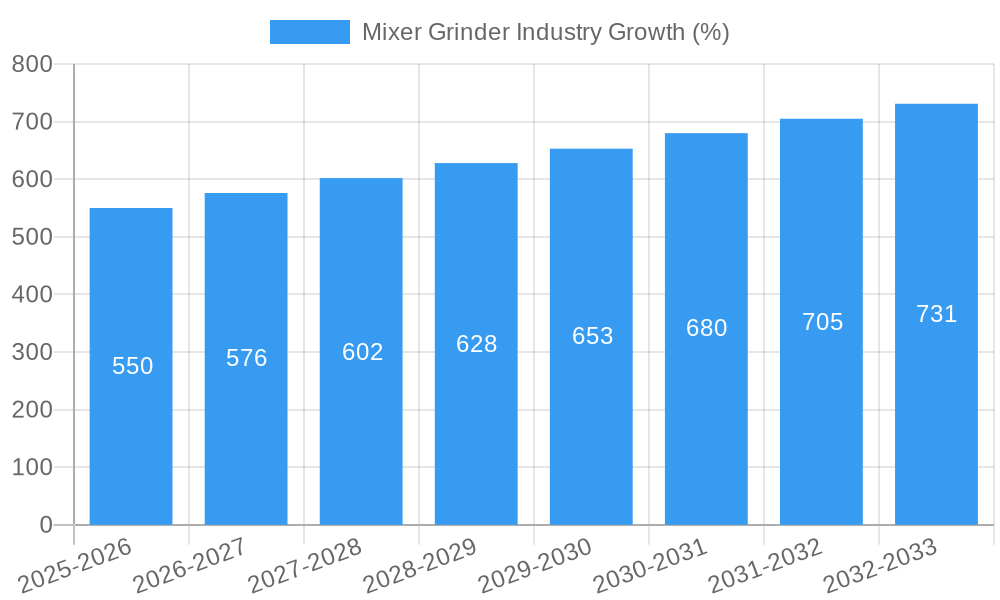
The global mixer grinder market, valued at $14.69 billion in 2025, is projected to experience steady growth, driven by increasing urbanization, changing lifestyles, and a rising demand for convenient kitchen appliances. The 3.71% CAGR indicates a consistent market expansion over the forecast period (2025-2033). Key growth drivers include the rising popularity of healthy eating habits promoting homemade food preparations, increased disposable incomes in developing economies leading to higher consumer spending on kitchen appliances, and the increasing adoption of online retail channels offering wider product choices and convenient purchasing options. The market is segmented by end-user (residential and commercial), product type (stand mixers and traditional mixers), and distribution channel (multi-brand stores, exclusive stores, and online stores). The residential segment currently holds the largest market share, driven by growing household formation and a preference for convenient food preparation methods. Stand mixers, owing to their versatility and enhanced features, are expected to witness robust growth compared to traditional mixers. Online stores are rapidly gaining traction as a distribution channel, fueled by the growth of e-commerce and improved digital infrastructure. Major players like Panasonic, Whirlpool, LG, and others are investing heavily in product innovation and brand building to maintain their market leadership. Competitive pressures and technological advancements in the industry are expected to fuel further growth and diversification.
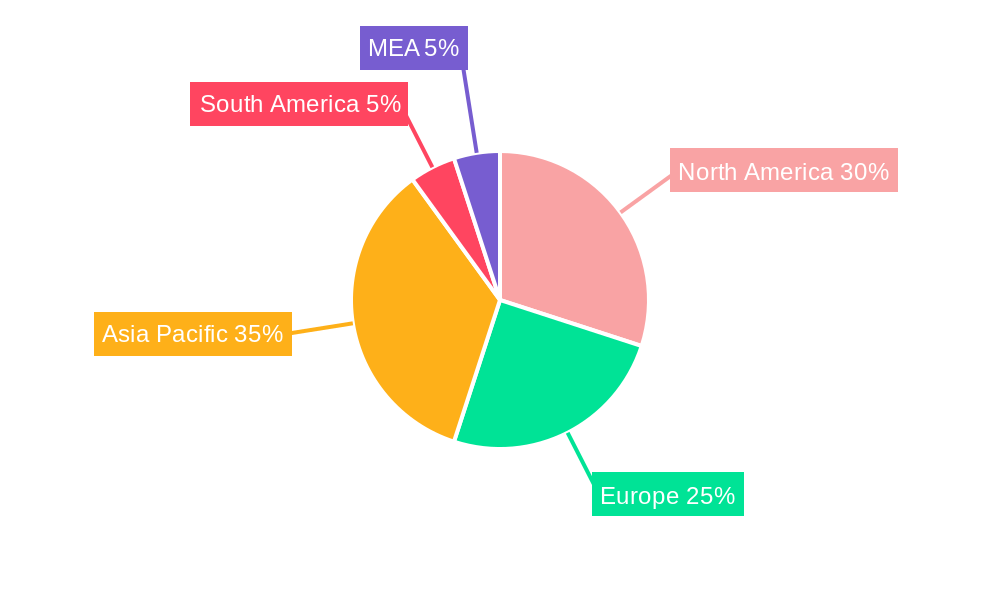
Geographic segmentation reveals a diverse market landscape. North America and Europe currently hold significant market shares due to established consumer bases and higher per capita income. However, rapid economic growth and urbanization in Asia-Pacific, particularly in India and China, are expected to drive substantial market expansion in the coming years. The South American market is also showing promising growth potential, driven by increasing disposable incomes and a growing preference for modern kitchen appliances. Market restraints include the rising cost of raw materials and fluctuating prices of components, which may impact production costs and consumer affordability. However, these challenges are likely to be mitigated through innovations in manufacturing processes and optimized supply chain management. The forecast period suggests a promising future for the mixer grinder market, with continued growth driven by a confluence of economic, social, and technological factors.
Mixer Grinder Industry Market Report: 2019-2033
This comprehensive report provides a detailed analysis of the global mixer grinder industry, offering invaluable insights for businesses, investors, and industry stakeholders. Covering the period 2019-2033, with a base year of 2025 and a forecast period of 2025-2033, this report examines market trends, competitive dynamics, and future growth potential. The market size is estimated at xx Million USD in 2025 and is projected to reach xx Million USD by 2033, exhibiting a CAGR of xx%.
Mixer Grinder Industry Market Structure & Competitive Dynamics
The global mixer grinder market is characterized by a moderately concentrated structure, with key players like Panasonic, Whirlpool Corporation, LG, Havells, AB Electrolux, Bosch Global, Philips, Samsung, Haier Inc, and Morphy Richards holding significant market share. Competition is fierce, driven by innovation in product features, design, and pricing strategies. The industry witnesses continuous mergers and acquisitions (M&A) activity, shaping the competitive landscape. For instance, the acquisition of TSI Semiconductors by Bosch in 2023 signifies a strategic move towards technological advancements, although not directly impacting the mixer grinder sector. Electrolux Professional's acquisition of Tosei Corporation in December 2023, while outside the direct mixer grinder segment, indicates the industry's broader interest in expansion and diversification.
The regulatory framework varies across different geographies, influencing product safety standards and labeling requirements. Substitute products, such as manual food processors, pose limited threats due to the convenience and efficiency offered by mixer grinders. Residential end-users constitute the dominant segment, while commercial applications are steadily growing. M&A activities are primarily focused on expanding market reach, enhancing technological capabilities, and diversifying product portfolios. Recent M&A deal values are estimated to be in the range of xx Million USD annually, but lack granular data for specific mixer grinder related acquisitions.
- Market Concentration: Moderately concentrated with top 10 players holding approximately xx% market share.
- Innovation Ecosystems: Strong focus on energy efficiency, smart features, and durable materials.
- Regulatory Frameworks: Vary by region, impacting product safety and labeling.
- Product Substitutes: Limited threat from manual alternatives.
- End-User Trends: Increasing demand from residential sector; growing commercial segment.
- M&A Activities: Focused on expansion, technology, and diversification; estimated annual deal value of xx Million USD.
Mixer Grinder Industry Trends & Insights
The mixer grinder industry is experiencing robust growth, driven by factors such as rising disposable incomes, changing lifestyles, and increasing urbanization, particularly in developing economies. Technological advancements, including the incorporation of smart features and improved motor technology, are enhancing product appeal and driving market penetration. Consumer preferences are shifting towards compact, energy-efficient models with enhanced safety features. The market's competitive dynamics are further influenced by the entry of new players and the continuous innovation by established brands. The CAGR for the forecast period is projected at xx%, with the market penetration rate steadily increasing. Specific growth drivers include:
- Rising Disposable Incomes: fueling demand for convenient kitchen appliances.
- Changing Lifestyles: increased preference for quick and easy meal preparation.
- Urbanization: driving demand in densely populated areas.
- Technological Advancements: energy-efficient motors, smart functionalities, improved safety features.
- Evolving Consumer Preferences: focus on compact designs, durability, and ease of use.
- Competitive Dynamics: continuous innovation, new entrants, and strategic partnerships.
Dominant Markets & Segments in Mixer Grinder Industry
The Asia-Pacific region, particularly India and China, represents the dominant market for mixer grinders, driven by large populations, rising incomes, and increasing urbanization. Within the end-user segment, residential applications dominate, accounting for approximately xx% of the total market. Traditional mixer grinders constitute a larger market share compared to stand mixers, owing to their affordability and widespread acceptance. Multi-brand stores remain the primary distribution channel, while online sales are witnessing substantial growth.
- Key Drivers in Asia-Pacific:
- Rapid economic growth and rising disposable incomes.
- Increasing urbanization and nuclear family structures.
- Growing awareness of convenience and time-saving kitchen appliances.
- Favorable government policies promoting domestic appliance manufacturing.
- Dominant End-User Segment: Residential (xx%) due to affordability and widespread usage.
- Dominant Product Type: Traditional Mixer Grinders (xx%) due to lower price point and familiarity.
- Dominant Distribution Channel: Multi-brand Stores (xx%), followed by rapid growth in Online Stores.
Mixer Grinder Industry Product Innovations
Recent product innovations focus on enhanced durability, energy efficiency, and user-friendly designs. Smart features, such as variable speed settings and pre-programmed functions, are becoming increasingly common. Manufacturers are also emphasizing safety features, such as overload protection and robust construction. These innovations cater to evolving consumer preferences for convenience, efficiency, and safety. The market is witnessing a gradual shift towards multi-functional appliances that combine various kitchen tasks in a single device.
Report Segmentation & Scope
The report segments the mixer grinder market based on end-user (Residential, Commercial), product type (Stand Mixer, Traditional Mixer), and distribution channel (Multi-brand Stores, Exclusive Stores, Online Stores, Other Distribution Channels). Growth projections vary across segments, with the residential sector anticipated to experience significant growth, driven by increasing disposable incomes and changing lifestyles. The online distribution channel is projected to witness the fastest growth, boosted by the rising adoption of e-commerce. Competitive dynamics vary across segments, with different players focusing on specific niche markets and customer segments. The market sizes for each segment are detailed in the full report, with specific values omitted here for brevity.
Key Drivers of Mixer Grinder Industry Growth
Several factors contribute to the growth of the mixer grinder industry. Rising disposable incomes in emerging markets and changing lifestyles that emphasize convenient cooking methods are significant drivers. Technological advancements, such as the development of energy-efficient motors and smart features, further enhance market attractiveness. Government initiatives promoting appliance manufacturing in certain regions also contribute to market expansion.
Challenges in the Mixer Grinder Industry Sector
The mixer grinder industry faces challenges such as intense competition, fluctuating raw material prices, and stringent regulatory requirements. Supply chain disruptions, particularly during periods of economic uncertainty, can impact production and pricing. The increasing prevalence of counterfeit products also poses a threat to the industry.
Leading Players in the Mixer Grinder Industry Market
- Panasonic
- Whirlpool Corporation
- LG
- Havells
- AB Electrolux
- Bosch Global
- Philips
- Samsung
- Haier Inc
- Morphy Richards
Key Developments in Mixer Grinder Industry Sector
- April 2023: Bosch announced plans to acquire TSI Semiconductors.
- August 2023: Bosch completed the acquisition of TSI Semiconductors, forming Robert Bosch Semiconductor LLC.
- December 2023: Electrolux Professional finalized the acquisition of Tosei Corporation.
Strategic Mixer Grinder Industry Market Outlook
The mixer grinder industry presents significant growth opportunities, particularly in emerging economies. Strategic initiatives such as focusing on innovation, expanding distribution networks, and enhancing brand recognition will be crucial for success. Capitalizing on the growing demand for smart appliances and focusing on sustainable manufacturing practices will be key to achieving long-term market leadership.
Mixer Grinder Industry Segmentation
-
1. Product Type
- 1.1. Stand Mixer
- 1.2. Traditional Mixer
-
2. Distribution Channel
- 2.1. Multi-brands Stores
- 2.2. Exclusive Stores
- 2.3. Online Stores
- 2.4. Other Distribution Channels
-
3. End User
- 3.1. Residential
- 3.2. Commercial
Mixer Grinder Industry Segmentation By Geography
- 1. North America
- 2. Europe
- 3. Asia Pacific
- 4. Latin America
- 5. Middle East and Africa
Mixer Grinder Industry REPORT HIGHLIGHTS
| Aspects | Details |
|---|---|
| Study Period | 2019-2033 |
| Base Year | 2024 |
| Estimated Year | 2025 |
| Forecast Period | 2025-2033 |
| Historical Period | 2019-2024 |
| Growth Rate | CAGR of 3.71% from 2019-2033 |
| Segmentation |
|
Table of Contents
- 1. Introduction
- 1.1. Research Scope
- 1.2. Market Segmentation
- 1.3. Research Methodology
- 1.4. Definitions and Assumptions
- 2. Executive Summary
- 2.1. Introduction
- 3. Market Dynamics
- 3.1. Introduction
- 3.2. Market Drivers
- 3.2.1. Increasing Urbanization is Driving the Market; Increase in Usage of Smart Kitchen Appliances is Driving the Market
- 3.3. Market Restrains
- 3.3.1. High Power Consumption
- 3.4. Market Trends
- 3.4.1. E-commerce Emerges as a Fastest Growing Distribution Channel for Mixer Grinders
- 4. Market Factor Analysis
- 4.1. Porters Five Forces
- 4.2. Supply/Value Chain
- 4.3. PESTEL analysis
- 4.4. Market Entropy
- 4.5. Patent/Trademark Analysis
- 5. Global Mixer Grinder Industry Analysis, Insights and Forecast, 2019-2031
- 5.1. Market Analysis, Insights and Forecast - by Product Type
- 5.1.1. Stand Mixer
- 5.1.2. Traditional Mixer
- 5.2. Market Analysis, Insights and Forecast - by Distribution Channel
- 5.2.1. Multi-brands Stores
- 5.2.2. Exclusive Stores
- 5.2.3. Online Stores
- 5.2.4. Other Distribution Channels
- 5.3. Market Analysis, Insights and Forecast - by End User
- 5.3.1. Residential
- 5.3.2. Commercial
- 5.4. Market Analysis, Insights and Forecast - by Region
- 5.4.1. North America
- 5.4.2. Europe
- 5.4.3. Asia Pacific
- 5.4.4. Latin America
- 5.4.5. Middle East and Africa
- 5.1. Market Analysis, Insights and Forecast - by Product Type
- 6. North America Mixer Grinder Industry Analysis, Insights and Forecast, 2019-2031
- 6.1. Market Analysis, Insights and Forecast - by Product Type
- 6.1.1. Stand Mixer
- 6.1.2. Traditional Mixer
- 6.2. Market Analysis, Insights and Forecast - by Distribution Channel
- 6.2.1. Multi-brands Stores
- 6.2.2. Exclusive Stores
- 6.2.3. Online Stores
- 6.2.4. Other Distribution Channels
- 6.3. Market Analysis, Insights and Forecast - by End User
- 6.3.1. Residential
- 6.3.2. Commercial
- 6.1. Market Analysis, Insights and Forecast - by Product Type
- 7. Europe Mixer Grinder Industry Analysis, Insights and Forecast, 2019-2031
- 7.1. Market Analysis, Insights and Forecast - by Product Type
- 7.1.1. Stand Mixer
- 7.1.2. Traditional Mixer
- 7.2. Market Analysis, Insights and Forecast - by Distribution Channel
- 7.2.1. Multi-brands Stores
- 7.2.2. Exclusive Stores
- 7.2.3. Online Stores
- 7.2.4. Other Distribution Channels
- 7.3. Market Analysis, Insights and Forecast - by End User
- 7.3.1. Residential
- 7.3.2. Commercial
- 7.1. Market Analysis, Insights and Forecast - by Product Type
- 8. Asia Pacific Mixer Grinder Industry Analysis, Insights and Forecast, 2019-2031
- 8.1. Market Analysis, Insights and Forecast - by Product Type
- 8.1.1. Stand Mixer
- 8.1.2. Traditional Mixer
- 8.2. Market Analysis, Insights and Forecast - by Distribution Channel
- 8.2.1. Multi-brands Stores
- 8.2.2. Exclusive Stores
- 8.2.3. Online Stores
- 8.2.4. Other Distribution Channels
- 8.3. Market Analysis, Insights and Forecast - by End User
- 8.3.1. Residential
- 8.3.2. Commercial
- 8.1. Market Analysis, Insights and Forecast - by Product Type
- 9. Latin America Mixer Grinder Industry Analysis, Insights and Forecast, 2019-2031
- 9.1. Market Analysis, Insights and Forecast - by Product Type
- 9.1.1. Stand Mixer
- 9.1.2. Traditional Mixer
- 9.2. Market Analysis, Insights and Forecast - by Distribution Channel
- 9.2.1. Multi-brands Stores
- 9.2.2. Exclusive Stores
- 9.2.3. Online Stores
- 9.2.4. Other Distribution Channels
- 9.3. Market Analysis, Insights and Forecast - by End User
- 9.3.1. Residential
- 9.3.2. Commercial
- 9.1. Market Analysis, Insights and Forecast - by Product Type
- 10. Middle East and Africa Mixer Grinder Industry Analysis, Insights and Forecast, 2019-2031
- 10.1. Market Analysis, Insights and Forecast - by Product Type
- 10.1.1. Stand Mixer
- 10.1.2. Traditional Mixer
- 10.2. Market Analysis, Insights and Forecast - by Distribution Channel
- 10.2.1. Multi-brands Stores
- 10.2.2. Exclusive Stores
- 10.2.3. Online Stores
- 10.2.4. Other Distribution Channels
- 10.3. Market Analysis, Insights and Forecast - by End User
- 10.3.1. Residential
- 10.3.2. Commercial
- 10.1. Market Analysis, Insights and Forecast - by Product Type
- 11. North America Mixer Grinder Industry Analysis, Insights and Forecast, 2019-2031
- 11.1. Market Analysis, Insights and Forecast - By Country/Sub-region
- 11.1.1 United States
- 11.1.2 Canada
- 11.1.3 Mexico
- 12. Europe Mixer Grinder Industry Analysis, Insights and Forecast, 2019-2031
- 12.1. Market Analysis, Insights and Forecast - By Country/Sub-region
- 12.1.1 Germany
- 12.1.2 United Kingdom
- 12.1.3 France
- 12.1.4 Spain
- 12.1.5 Italy
- 12.1.6 Spain
- 12.1.7 Belgium
- 12.1.8 Netherland
- 12.1.9 Nordics
- 12.1.10 Rest of Europe
- 13. Asia Pacific Mixer Grinder Industry Analysis, Insights and Forecast, 2019-2031
- 13.1. Market Analysis, Insights and Forecast - By Country/Sub-region
- 13.1.1 China
- 13.1.2 Japan
- 13.1.3 India
- 13.1.4 South Korea
- 13.1.5 Southeast Asia
- 13.1.6 Australia
- 13.1.7 Indonesia
- 13.1.8 Phillipes
- 13.1.9 Singapore
- 13.1.10 Thailandc
- 13.1.11 Rest of Asia Pacific
- 14. South America Mixer Grinder Industry Analysis, Insights and Forecast, 2019-2031
- 14.1. Market Analysis, Insights and Forecast - By Country/Sub-region
- 14.1.1 Brazil
- 14.1.2 Argentina
- 14.1.3 Peru
- 14.1.4 Chile
- 14.1.5 Colombia
- 14.1.6 Ecuador
- 14.1.7 Venezuela
- 14.1.8 Rest of South America
- 15. North America Mixer Grinder Industry Analysis, Insights and Forecast, 2019-2031
- 15.1. Market Analysis, Insights and Forecast - By Country/Sub-region
- 15.1.1 United States
- 15.1.2 Canada
- 15.1.3 Mexico
- 16. MEA Mixer Grinder Industry Analysis, Insights and Forecast, 2019-2031
- 16.1. Market Analysis, Insights and Forecast - By Country/Sub-region
- 16.1.1 United Arab Emirates
- 16.1.2 Saudi Arabia
- 16.1.3 South Africa
- 16.1.4 Rest of Middle East and Africa
- 17. Competitive Analysis
- 17.1. Global Market Share Analysis 2024
- 17.2. Company Profiles
- 17.2.1 Panasonic
- 17.2.1.1. Overview
- 17.2.1.2. Products
- 17.2.1.3. SWOT Analysis
- 17.2.1.4. Recent Developments
- 17.2.1.5. Financials (Based on Availability)
- 17.2.2 Whirlpool Corporation
- 17.2.2.1. Overview
- 17.2.2.2. Products
- 17.2.2.3. SWOT Analysis
- 17.2.2.4. Recent Developments
- 17.2.2.5. Financials (Based on Availability)
- 17.2.3 LG
- 17.2.3.1. Overview
- 17.2.3.2. Products
- 17.2.3.3. SWOT Analysis
- 17.2.3.4. Recent Developments
- 17.2.3.5. Financials (Based on Availability)
- 17.2.4 Havells
- 17.2.4.1. Overview
- 17.2.4.2. Products
- 17.2.4.3. SWOT Analysis
- 17.2.4.4. Recent Developments
- 17.2.4.5. Financials (Based on Availability)
- 17.2.5 AB Electrolux
- 17.2.5.1. Overview
- 17.2.5.2. Products
- 17.2.5.3. SWOT Analysis
- 17.2.5.4. Recent Developments
- 17.2.5.5. Financials (Based on Availability)
- 17.2.6 Bosch Global
- 17.2.6.1. Overview
- 17.2.6.2. Products
- 17.2.6.3. SWOT Analysis
- 17.2.6.4. Recent Developments
- 17.2.6.5. Financials (Based on Availability)
- 17.2.7 Philips
- 17.2.7.1. Overview
- 17.2.7.2. Products
- 17.2.7.3. SWOT Analysis
- 17.2.7.4. Recent Developments
- 17.2.7.5. Financials (Based on Availability)
- 17.2.8 Samsung
- 17.2.8.1. Overview
- 17.2.8.2. Products
- 17.2.8.3. SWOT Analysis
- 17.2.8.4. Recent Developments
- 17.2.8.5. Financials (Based on Availability)
- 17.2.9 Haier Inc
- 17.2.9.1. Overview
- 17.2.9.2. Products
- 17.2.9.3. SWOT Analysis
- 17.2.9.4. Recent Developments
- 17.2.9.5. Financials (Based on Availability)
- 17.2.10 Morphy Richards
- 17.2.10.1. Overview
- 17.2.10.2. Products
- 17.2.10.3. SWOT Analysis
- 17.2.10.4. Recent Developments
- 17.2.10.5. Financials (Based on Availability)
- 17.2.1 Panasonic
List of Figures
- Figure 1: Global Mixer Grinder Industry Revenue Breakdown (Million, %) by Region 2024 & 2032
- Figure 2: Global Mixer Grinder Industry Volume Breakdown (K Unit, %) by Region 2024 & 2032
- Figure 3: North America Mixer Grinder Industry Revenue (Million), by Country 2024 & 2032
- Figure 4: North America Mixer Grinder Industry Volume (K Unit), by Country 2024 & 2032
- Figure 5: North America Mixer Grinder Industry Revenue Share (%), by Country 2024 & 2032
- Figure 6: North America Mixer Grinder Industry Volume Share (%), by Country 2024 & 2032
- Figure 7: Europe Mixer Grinder Industry Revenue (Million), by Country 2024 & 2032
- Figure 8: Europe Mixer Grinder Industry Volume (K Unit), by Country 2024 & 2032
- Figure 9: Europe Mixer Grinder Industry Revenue Share (%), by Country 2024 & 2032
- Figure 10: Europe Mixer Grinder Industry Volume Share (%), by Country 2024 & 2032
- Figure 11: Asia Pacific Mixer Grinder Industry Revenue (Million), by Country 2024 & 2032
- Figure 12: Asia Pacific Mixer Grinder Industry Volume (K Unit), by Country 2024 & 2032
- Figure 13: Asia Pacific Mixer Grinder Industry Revenue Share (%), by Country 2024 & 2032
- Figure 14: Asia Pacific Mixer Grinder Industry Volume Share (%), by Country 2024 & 2032
- Figure 15: South America Mixer Grinder Industry Revenue (Million), by Country 2024 & 2032
- Figure 16: South America Mixer Grinder Industry Volume (K Unit), by Country 2024 & 2032
- Figure 17: South America Mixer Grinder Industry Revenue Share (%), by Country 2024 & 2032
- Figure 18: South America Mixer Grinder Industry Volume Share (%), by Country 2024 & 2032
- Figure 19: North America Mixer Grinder Industry Revenue (Million), by Country 2024 & 2032
- Figure 20: North America Mixer Grinder Industry Volume (K Unit), by Country 2024 & 2032
- Figure 21: North America Mixer Grinder Industry Revenue Share (%), by Country 2024 & 2032
- Figure 22: North America Mixer Grinder Industry Volume Share (%), by Country 2024 & 2032
- Figure 23: MEA Mixer Grinder Industry Revenue (Million), by Country 2024 & 2032
- Figure 24: MEA Mixer Grinder Industry Volume (K Unit), by Country 2024 & 2032
- Figure 25: MEA Mixer Grinder Industry Revenue Share (%), by Country 2024 & 2032
- Figure 26: MEA Mixer Grinder Industry Volume Share (%), by Country 2024 & 2032
- Figure 27: North America Mixer Grinder Industry Revenue (Million), by Product Type 2024 & 2032
- Figure 28: North America Mixer Grinder Industry Volume (K Unit), by Product Type 2024 & 2032
- Figure 29: North America Mixer Grinder Industry Revenue Share (%), by Product Type 2024 & 2032
- Figure 30: North America Mixer Grinder Industry Volume Share (%), by Product Type 2024 & 2032
- Figure 31: North America Mixer Grinder Industry Revenue (Million), by Distribution Channel 2024 & 2032
- Figure 32: North America Mixer Grinder Industry Volume (K Unit), by Distribution Channel 2024 & 2032
- Figure 33: North America Mixer Grinder Industry Revenue Share (%), by Distribution Channel 2024 & 2032
- Figure 34: North America Mixer Grinder Industry Volume Share (%), by Distribution Channel 2024 & 2032
- Figure 35: North America Mixer Grinder Industry Revenue (Million), by End User 2024 & 2032
- Figure 36: North America Mixer Grinder Industry Volume (K Unit), by End User 2024 & 2032
- Figure 37: North America Mixer Grinder Industry Revenue Share (%), by End User 2024 & 2032
- Figure 38: North America Mixer Grinder Industry Volume Share (%), by End User 2024 & 2032
- Figure 39: North America Mixer Grinder Industry Revenue (Million), by Country 2024 & 2032
- Figure 40: North America Mixer Grinder Industry Volume (K Unit), by Country 2024 & 2032
- Figure 41: North America Mixer Grinder Industry Revenue Share (%), by Country 2024 & 2032
- Figure 42: North America Mixer Grinder Industry Volume Share (%), by Country 2024 & 2032
- Figure 43: Europe Mixer Grinder Industry Revenue (Million), by Product Type 2024 & 2032
- Figure 44: Europe Mixer Grinder Industry Volume (K Unit), by Product Type 2024 & 2032
- Figure 45: Europe Mixer Grinder Industry Revenue Share (%), by Product Type 2024 & 2032
- Figure 46: Europe Mixer Grinder Industry Volume Share (%), by Product Type 2024 & 2032
- Figure 47: Europe Mixer Grinder Industry Revenue (Million), by Distribution Channel 2024 & 2032
- Figure 48: Europe Mixer Grinder Industry Volume (K Unit), by Distribution Channel 2024 & 2032
- Figure 49: Europe Mixer Grinder Industry Revenue Share (%), by Distribution Channel 2024 & 2032
- Figure 50: Europe Mixer Grinder Industry Volume Share (%), by Distribution Channel 2024 & 2032
- Figure 51: Europe Mixer Grinder Industry Revenue (Million), by End User 2024 & 2032
- Figure 52: Europe Mixer Grinder Industry Volume (K Unit), by End User 2024 & 2032
- Figure 53: Europe Mixer Grinder Industry Revenue Share (%), by End User 2024 & 2032
- Figure 54: Europe Mixer Grinder Industry Volume Share (%), by End User 2024 & 2032
- Figure 55: Europe Mixer Grinder Industry Revenue (Million), by Country 2024 & 2032
- Figure 56: Europe Mixer Grinder Industry Volume (K Unit), by Country 2024 & 2032
- Figure 57: Europe Mixer Grinder Industry Revenue Share (%), by Country 2024 & 2032
- Figure 58: Europe Mixer Grinder Industry Volume Share (%), by Country 2024 & 2032
- Figure 59: Asia Pacific Mixer Grinder Industry Revenue (Million), by Product Type 2024 & 2032
- Figure 60: Asia Pacific Mixer Grinder Industry Volume (K Unit), by Product Type 2024 & 2032
- Figure 61: Asia Pacific Mixer Grinder Industry Revenue Share (%), by Product Type 2024 & 2032
- Figure 62: Asia Pacific Mixer Grinder Industry Volume Share (%), by Product Type 2024 & 2032
- Figure 63: Asia Pacific Mixer Grinder Industry Revenue (Million), by Distribution Channel 2024 & 2032
- Figure 64: Asia Pacific Mixer Grinder Industry Volume (K Unit), by Distribution Channel 2024 & 2032
- Figure 65: Asia Pacific Mixer Grinder Industry Revenue Share (%), by Distribution Channel 2024 & 2032
- Figure 66: Asia Pacific Mixer Grinder Industry Volume Share (%), by Distribution Channel 2024 & 2032
- Figure 67: Asia Pacific Mixer Grinder Industry Revenue (Million), by End User 2024 & 2032
- Figure 68: Asia Pacific Mixer Grinder Industry Volume (K Unit), by End User 2024 & 2032
- Figure 69: Asia Pacific Mixer Grinder Industry Revenue Share (%), by End User 2024 & 2032
- Figure 70: Asia Pacific Mixer Grinder Industry Volume Share (%), by End User 2024 & 2032
- Figure 71: Asia Pacific Mixer Grinder Industry Revenue (Million), by Country 2024 & 2032
- Figure 72: Asia Pacific Mixer Grinder Industry Volume (K Unit), by Country 2024 & 2032
- Figure 73: Asia Pacific Mixer Grinder Industry Revenue Share (%), by Country 2024 & 2032
- Figure 74: Asia Pacific Mixer Grinder Industry Volume Share (%), by Country 2024 & 2032
- Figure 75: Latin America Mixer Grinder Industry Revenue (Million), by Product Type 2024 & 2032
- Figure 76: Latin America Mixer Grinder Industry Volume (K Unit), by Product Type 2024 & 2032
- Figure 77: Latin America Mixer Grinder Industry Revenue Share (%), by Product Type 2024 & 2032
- Figure 78: Latin America Mixer Grinder Industry Volume Share (%), by Product Type 2024 & 2032
- Figure 79: Latin America Mixer Grinder Industry Revenue (Million), by Distribution Channel 2024 & 2032
- Figure 80: Latin America Mixer Grinder Industry Volume (K Unit), by Distribution Channel 2024 & 2032
- Figure 81: Latin America Mixer Grinder Industry Revenue Share (%), by Distribution Channel 2024 & 2032
- Figure 82: Latin America Mixer Grinder Industry Volume Share (%), by Distribution Channel 2024 & 2032
- Figure 83: Latin America Mixer Grinder Industry Revenue (Million), by End User 2024 & 2032
- Figure 84: Latin America Mixer Grinder Industry Volume (K Unit), by End User 2024 & 2032
- Figure 85: Latin America Mixer Grinder Industry Revenue Share (%), by End User 2024 & 2032
- Figure 86: Latin America Mixer Grinder Industry Volume Share (%), by End User 2024 & 2032
- Figure 87: Latin America Mixer Grinder Industry Revenue (Million), by Country 2024 & 2032
- Figure 88: Latin America Mixer Grinder Industry Volume (K Unit), by Country 2024 & 2032
- Figure 89: Latin America Mixer Grinder Industry Revenue Share (%), by Country 2024 & 2032
- Figure 90: Latin America Mixer Grinder Industry Volume Share (%), by Country 2024 & 2032
- Figure 91: Middle East and Africa Mixer Grinder Industry Revenue (Million), by Product Type 2024 & 2032
- Figure 92: Middle East and Africa Mixer Grinder Industry Volume (K Unit), by Product Type 2024 & 2032
- Figure 93: Middle East and Africa Mixer Grinder Industry Revenue Share (%), by Product Type 2024 & 2032
- Figure 94: Middle East and Africa Mixer Grinder Industry Volume Share (%), by Product Type 2024 & 2032
- Figure 95: Middle East and Africa Mixer Grinder Industry Revenue (Million), by Distribution Channel 2024 & 2032
- Figure 96: Middle East and Africa Mixer Grinder Industry Volume (K Unit), by Distribution Channel 2024 & 2032
- Figure 97: Middle East and Africa Mixer Grinder Industry Revenue Share (%), by Distribution Channel 2024 & 2032
- Figure 98: Middle East and Africa Mixer Grinder Industry Volume Share (%), by Distribution Channel 2024 & 2032
- Figure 99: Middle East and Africa Mixer Grinder Industry Revenue (Million), by End User 2024 & 2032
- Figure 100: Middle East and Africa Mixer Grinder Industry Volume (K Unit), by End User 2024 & 2032
- Figure 101: Middle East and Africa Mixer Grinder Industry Revenue Share (%), by End User 2024 & 2032
- Figure 102: Middle East and Africa Mixer Grinder Industry Volume Share (%), by End User 2024 & 2032
- Figure 103: Middle East and Africa Mixer Grinder Industry Revenue (Million), by Country 2024 & 2032
- Figure 104: Middle East and Africa Mixer Grinder Industry Volume (K Unit), by Country 2024 & 2032
- Figure 105: Middle East and Africa Mixer Grinder Industry Revenue Share (%), by Country 2024 & 2032
- Figure 106: Middle East and Africa Mixer Grinder Industry Volume Share (%), by Country 2024 & 2032
List of Tables
- Table 1: Global Mixer Grinder Industry Revenue Million Forecast, by Region 2019 & 2032
- Table 2: Global Mixer Grinder Industry Volume K Unit Forecast, by Region 2019 & 2032
- Table 3: Global Mixer Grinder Industry Revenue Million Forecast, by Product Type 2019 & 2032
- Table 4: Global Mixer Grinder Industry Volume K Unit Forecast, by Product Type 2019 & 2032
- Table 5: Global Mixer Grinder Industry Revenue Million Forecast, by Distribution Channel 2019 & 2032
- Table 6: Global Mixer Grinder Industry Volume K Unit Forecast, by Distribution Channel 2019 & 2032
- Table 7: Global Mixer Grinder Industry Revenue Million Forecast, by End User 2019 & 2032
- Table 8: Global Mixer Grinder Industry Volume K Unit Forecast, by End User 2019 & 2032
- Table 9: Global Mixer Grinder Industry Revenue Million Forecast, by Region 2019 & 2032
- Table 10: Global Mixer Grinder Industry Volume K Unit Forecast, by Region 2019 & 2032
- Table 11: Global Mixer Grinder Industry Revenue Million Forecast, by Country 2019 & 2032
- Table 12: Global Mixer Grinder Industry Volume K Unit Forecast, by Country 2019 & 2032
- Table 13: United States Mixer Grinder Industry Revenue (Million) Forecast, by Application 2019 & 2032
- Table 14: United States Mixer Grinder Industry Volume (K Unit) Forecast, by Application 2019 & 2032
- Table 15: Canada Mixer Grinder Industry Revenue (Million) Forecast, by Application 2019 & 2032
- Table 16: Canada Mixer Grinder Industry Volume (K Unit) Forecast, by Application 2019 & 2032
- Table 17: Mexico Mixer Grinder Industry Revenue (Million) Forecast, by Application 2019 & 2032
- Table 18: Mexico Mixer Grinder Industry Volume (K Unit) Forecast, by Application 2019 & 2032
- Table 19: Global Mixer Grinder Industry Revenue Million Forecast, by Country 2019 & 2032
- Table 20: Global Mixer Grinder Industry Volume K Unit Forecast, by Country 2019 & 2032
- Table 21: Germany Mixer Grinder Industry Revenue (Million) Forecast, by Application 2019 & 2032
- Table 22: Germany Mixer Grinder Industry Volume (K Unit) Forecast, by Application 2019 & 2032
- Table 23: United Kingdom Mixer Grinder Industry Revenue (Million) Forecast, by Application 2019 & 2032
- Table 24: United Kingdom Mixer Grinder Industry Volume (K Unit) Forecast, by Application 2019 & 2032
- Table 25: France Mixer Grinder Industry Revenue (Million) Forecast, by Application 2019 & 2032
- Table 26: France Mixer Grinder Industry Volume (K Unit) Forecast, by Application 2019 & 2032
- Table 27: Spain Mixer Grinder Industry Revenue (Million) Forecast, by Application 2019 & 2032
- Table 28: Spain Mixer Grinder Industry Volume (K Unit) Forecast, by Application 2019 & 2032
- Table 29: Italy Mixer Grinder Industry Revenue (Million) Forecast, by Application 2019 & 2032
- Table 30: Italy Mixer Grinder Industry Volume (K Unit) Forecast, by Application 2019 & 2032
- Table 31: Spain Mixer Grinder Industry Revenue (Million) Forecast, by Application 2019 & 2032
- Table 32: Spain Mixer Grinder Industry Volume (K Unit) Forecast, by Application 2019 & 2032
- Table 33: Belgium Mixer Grinder Industry Revenue (Million) Forecast, by Application 2019 & 2032
- Table 34: Belgium Mixer Grinder Industry Volume (K Unit) Forecast, by Application 2019 & 2032
- Table 35: Netherland Mixer Grinder Industry Revenue (Million) Forecast, by Application 2019 & 2032
- Table 36: Netherland Mixer Grinder Industry Volume (K Unit) Forecast, by Application 2019 & 2032
- Table 37: Nordics Mixer Grinder Industry Revenue (Million) Forecast, by Application 2019 & 2032
- Table 38: Nordics Mixer Grinder Industry Volume (K Unit) Forecast, by Application 2019 & 2032
- Table 39: Rest of Europe Mixer Grinder Industry Revenue (Million) Forecast, by Application 2019 & 2032
- Table 40: Rest of Europe Mixer Grinder Industry Volume (K Unit) Forecast, by Application 2019 & 2032
- Table 41: Global Mixer Grinder Industry Revenue Million Forecast, by Country 2019 & 2032
- Table 42: Global Mixer Grinder Industry Volume K Unit Forecast, by Country 2019 & 2032
- Table 43: China Mixer Grinder Industry Revenue (Million) Forecast, by Application 2019 & 2032
- Table 44: China Mixer Grinder Industry Volume (K Unit) Forecast, by Application 2019 & 2032
- Table 45: Japan Mixer Grinder Industry Revenue (Million) Forecast, by Application 2019 & 2032
- Table 46: Japan Mixer Grinder Industry Volume (K Unit) Forecast, by Application 2019 & 2032
- Table 47: India Mixer Grinder Industry Revenue (Million) Forecast, by Application 2019 & 2032
- Table 48: India Mixer Grinder Industry Volume (K Unit) Forecast, by Application 2019 & 2032
- Table 49: South Korea Mixer Grinder Industry Revenue (Million) Forecast, by Application 2019 & 2032
- Table 50: South Korea Mixer Grinder Industry Volume (K Unit) Forecast, by Application 2019 & 2032
- Table 51: Southeast Asia Mixer Grinder Industry Revenue (Million) Forecast, by Application 2019 & 2032
- Table 52: Southeast Asia Mixer Grinder Industry Volume (K Unit) Forecast, by Application 2019 & 2032
- Table 53: Australia Mixer Grinder Industry Revenue (Million) Forecast, by Application 2019 & 2032
- Table 54: Australia Mixer Grinder Industry Volume (K Unit) Forecast, by Application 2019 & 2032
- Table 55: Indonesia Mixer Grinder Industry Revenue (Million) Forecast, by Application 2019 & 2032
- Table 56: Indonesia Mixer Grinder Industry Volume (K Unit) Forecast, by Application 2019 & 2032
- Table 57: Phillipes Mixer Grinder Industry Revenue (Million) Forecast, by Application 2019 & 2032
- Table 58: Phillipes Mixer Grinder Industry Volume (K Unit) Forecast, by Application 2019 & 2032
- Table 59: Singapore Mixer Grinder Industry Revenue (Million) Forecast, by Application 2019 & 2032
- Table 60: Singapore Mixer Grinder Industry Volume (K Unit) Forecast, by Application 2019 & 2032
- Table 61: Thailandc Mixer Grinder Industry Revenue (Million) Forecast, by Application 2019 & 2032
- Table 62: Thailandc Mixer Grinder Industry Volume (K Unit) Forecast, by Application 2019 & 2032
- Table 63: Rest of Asia Pacific Mixer Grinder Industry Revenue (Million) Forecast, by Application 2019 & 2032
- Table 64: Rest of Asia Pacific Mixer Grinder Industry Volume (K Unit) Forecast, by Application 2019 & 2032
- Table 65: Global Mixer Grinder Industry Revenue Million Forecast, by Country 2019 & 2032
- Table 66: Global Mixer Grinder Industry Volume K Unit Forecast, by Country 2019 & 2032
- Table 67: Brazil Mixer Grinder Industry Revenue (Million) Forecast, by Application 2019 & 2032
- Table 68: Brazil Mixer Grinder Industry Volume (K Unit) Forecast, by Application 2019 & 2032
- Table 69: Argentina Mixer Grinder Industry Revenue (Million) Forecast, by Application 2019 & 2032
- Table 70: Argentina Mixer Grinder Industry Volume (K Unit) Forecast, by Application 2019 & 2032
- Table 71: Peru Mixer Grinder Industry Revenue (Million) Forecast, by Application 2019 & 2032
- Table 72: Peru Mixer Grinder Industry Volume (K Unit) Forecast, by Application 2019 & 2032
- Table 73: Chile Mixer Grinder Industry Revenue (Million) Forecast, by Application 2019 & 2032
- Table 74: Chile Mixer Grinder Industry Volume (K Unit) Forecast, by Application 2019 & 2032
- Table 75: Colombia Mixer Grinder Industry Revenue (Million) Forecast, by Application 2019 & 2032
- Table 76: Colombia Mixer Grinder Industry Volume (K Unit) Forecast, by Application 2019 & 2032
- Table 77: Ecuador Mixer Grinder Industry Revenue (Million) Forecast, by Application 2019 & 2032
- Table 78: Ecuador Mixer Grinder Industry Volume (K Unit) Forecast, by Application 2019 & 2032
- Table 79: Venezuela Mixer Grinder Industry Revenue (Million) Forecast, by Application 2019 & 2032
- Table 80: Venezuela Mixer Grinder Industry Volume (K Unit) Forecast, by Application 2019 & 2032
- Table 81: Rest of South America Mixer Grinder Industry Revenue (Million) Forecast, by Application 2019 & 2032
- Table 82: Rest of South America Mixer Grinder Industry Volume (K Unit) Forecast, by Application 2019 & 2032
- Table 83: Global Mixer Grinder Industry Revenue Million Forecast, by Country 2019 & 2032
- Table 84: Global Mixer Grinder Industry Volume K Unit Forecast, by Country 2019 & 2032
- Table 85: United States Mixer Grinder Industry Revenue (Million) Forecast, by Application 2019 & 2032
- Table 86: United States Mixer Grinder Industry Volume (K Unit) Forecast, by Application 2019 & 2032
- Table 87: Canada Mixer Grinder Industry Revenue (Million) Forecast, by Application 2019 & 2032
- Table 88: Canada Mixer Grinder Industry Volume (K Unit) Forecast, by Application 2019 & 2032
- Table 89: Mexico Mixer Grinder Industry Revenue (Million) Forecast, by Application 2019 & 2032
- Table 90: Mexico Mixer Grinder Industry Volume (K Unit) Forecast, by Application 2019 & 2032
- Table 91: Global Mixer Grinder Industry Revenue Million Forecast, by Country 2019 & 2032
- Table 92: Global Mixer Grinder Industry Volume K Unit Forecast, by Country 2019 & 2032
- Table 93: United Arab Emirates Mixer Grinder Industry Revenue (Million) Forecast, by Application 2019 & 2032
- Table 94: United Arab Emirates Mixer Grinder Industry Volume (K Unit) Forecast, by Application 2019 & 2032
- Table 95: Saudi Arabia Mixer Grinder Industry Revenue (Million) Forecast, by Application 2019 & 2032
- Table 96: Saudi Arabia Mixer Grinder Industry Volume (K Unit) Forecast, by Application 2019 & 2032
- Table 97: South Africa Mixer Grinder Industry Revenue (Million) Forecast, by Application 2019 & 2032
- Table 98: South Africa Mixer Grinder Industry Volume (K Unit) Forecast, by Application 2019 & 2032
- Table 99: Rest of Middle East and Africa Mixer Grinder Industry Revenue (Million) Forecast, by Application 2019 & 2032
- Table 100: Rest of Middle East and Africa Mixer Grinder Industry Volume (K Unit) Forecast, by Application 2019 & 2032
- Table 101: Global Mixer Grinder Industry Revenue Million Forecast, by Product Type 2019 & 2032
- Table 102: Global Mixer Grinder Industry Volume K Unit Forecast, by Product Type 2019 & 2032
- Table 103: Global Mixer Grinder Industry Revenue Million Forecast, by Distribution Channel 2019 & 2032
- Table 104: Global Mixer Grinder Industry Volume K Unit Forecast, by Distribution Channel 2019 & 2032
- Table 105: Global Mixer Grinder Industry Revenue Million Forecast, by End User 2019 & 2032
- Table 106: Global Mixer Grinder Industry Volume K Unit Forecast, by End User 2019 & 2032
- Table 107: Global Mixer Grinder Industry Revenue Million Forecast, by Country 2019 & 2032
- Table 108: Global Mixer Grinder Industry Volume K Unit Forecast, by Country 2019 & 2032
- Table 109: Global Mixer Grinder Industry Revenue Million Forecast, by Product Type 2019 & 2032
- Table 110: Global Mixer Grinder Industry Volume K Unit Forecast, by Product Type 2019 & 2032
- Table 111: Global Mixer Grinder Industry Revenue Million Forecast, by Distribution Channel 2019 & 2032
- Table 112: Global Mixer Grinder Industry Volume K Unit Forecast, by Distribution Channel 2019 & 2032
- Table 113: Global Mixer Grinder Industry Revenue Million Forecast, by End User 2019 & 2032
- Table 114: Global Mixer Grinder Industry Volume K Unit Forecast, by End User 2019 & 2032
- Table 115: Global Mixer Grinder Industry Revenue Million Forecast, by Country 2019 & 2032
- Table 116: Global Mixer Grinder Industry Volume K Unit Forecast, by Country 2019 & 2032
- Table 117: Global Mixer Grinder Industry Revenue Million Forecast, by Product Type 2019 & 2032
- Table 118: Global Mixer Grinder Industry Volume K Unit Forecast, by Product Type 2019 & 2032
- Table 119: Global Mixer Grinder Industry Revenue Million Forecast, by Distribution Channel 2019 & 2032
- Table 120: Global Mixer Grinder Industry Volume K Unit Forecast, by Distribution Channel 2019 & 2032
- Table 121: Global Mixer Grinder Industry Revenue Million Forecast, by End User 2019 & 2032
- Table 122: Global Mixer Grinder Industry Volume K Unit Forecast, by End User 2019 & 2032
- Table 123: Global Mixer Grinder Industry Revenue Million Forecast, by Country 2019 & 2032
- Table 124: Global Mixer Grinder Industry Volume K Unit Forecast, by Country 2019 & 2032
- Table 125: Global Mixer Grinder Industry Revenue Million Forecast, by Product Type 2019 & 2032
- Table 126: Global Mixer Grinder Industry Volume K Unit Forecast, by Product Type 2019 & 2032
- Table 127: Global Mixer Grinder Industry Revenue Million Forecast, by Distribution Channel 2019 & 2032
- Table 128: Global Mixer Grinder Industry Volume K Unit Forecast, by Distribution Channel 2019 & 2032
- Table 129: Global Mixer Grinder Industry Revenue Million Forecast, by End User 2019 & 2032
- Table 130: Global Mixer Grinder Industry Volume K Unit Forecast, by End User 2019 & 2032
- Table 131: Global Mixer Grinder Industry Revenue Million Forecast, by Country 2019 & 2032
- Table 132: Global Mixer Grinder Industry Volume K Unit Forecast, by Country 2019 & 2032
- Table 133: Global Mixer Grinder Industry Revenue Million Forecast, by Product Type 2019 & 2032
- Table 134: Global Mixer Grinder Industry Volume K Unit Forecast, by Product Type 2019 & 2032
- Table 135: Global Mixer Grinder Industry Revenue Million Forecast, by Distribution Channel 2019 & 2032
- Table 136: Global Mixer Grinder Industry Volume K Unit Forecast, by Distribution Channel 2019 & 2032
- Table 137: Global Mixer Grinder Industry Revenue Million Forecast, by End User 2019 & 2032
- Table 138: Global Mixer Grinder Industry Volume K Unit Forecast, by End User 2019 & 2032
- Table 139: Global Mixer Grinder Industry Revenue Million Forecast, by Country 2019 & 2032
- Table 140: Global Mixer Grinder Industry Volume K Unit Forecast, by Country 2019 & 2032
Frequently Asked Questions
1. What is the projected Compound Annual Growth Rate (CAGR) of the Mixer Grinder Industry?
The projected CAGR is approximately 3.71%.
2. Which companies are prominent players in the Mixer Grinder Industry?
Key companies in the market include Panasonic, Whirlpool Corporation, LG, Havells, AB Electrolux, Bosch Global, Philips, Samsung, Haier Inc, Morphy Richards.
3. What are the main segments of the Mixer Grinder Industry?
The market segments include Product Type, Distribution Channel, End User.
4. Can you provide details about the market size?
The market size is estimated to be USD 14.69 Million as of 2022.
5. What are some drivers contributing to market growth?
Increasing Urbanization is Driving the Market; Increase in Usage of Smart Kitchen Appliances is Driving the Market.
6. What are the notable trends driving market growth?
E-commerce Emerges as a Fastest Growing Distribution Channel for Mixer Grinders.
7. Are there any restraints impacting market growth?
High Power Consumption.
8. Can you provide examples of recent developments in the market?
In April 2023, Bosch revealed plans to acquire the assets of TSI Semiconductors, including its Roseville, California campus. The acquisition was finalized on August 31, 2023, and the newly formed company will operate under the name Robert Bosch Semiconductor LLC.
9. What pricing options are available for accessing the report?
Pricing options include single-user, multi-user, and enterprise licenses priced at USD 4750, USD 5250, and USD 8750 respectively.
10. Is the market size provided in terms of value or volume?
The market size is provided in terms of value, measured in Million and volume, measured in K Unit.
11. Are there any specific market keywords associated with the report?
Yes, the market keyword associated with the report is "Mixer Grinder Industry," which aids in identifying and referencing the specific market segment covered.
12. How do I determine which pricing option suits my needs best?
The pricing options vary based on user requirements and access needs. Individual users may opt for single-user licenses, while businesses requiring broader access may choose multi-user or enterprise licenses for cost-effective access to the report.
13. Are there any additional resources or data provided in the Mixer Grinder Industry report?
While the report offers comprehensive insights, it's advisable to review the specific contents or supplementary materials provided to ascertain if additional resources or data are available.
14. How can I stay updated on further developments or reports in the Mixer Grinder Industry?
To stay informed about further developments, trends, and reports in the Mixer Grinder Industry, consider subscribing to industry newsletters, following relevant companies and organizations, or regularly checking reputable industry news sources and publications.
Methodology
Step 1 - Identification of Relevant Samples Size from Population Database


Step 2 - Approaches for Defining Global Market Size (Value, Volume* & Price*)

Note*: In applicable scenarios
Step 3 - Data Sources
Primary Research
- Web Analytics
- Survey Reports
- Research Institute
- Latest Research Reports
- Opinion Leaders
Secondary Research
- Annual Reports
- White Paper
- Latest Press Release
- Industry Association
- Paid Database
- Investor Presentations

Step 4 - Data Triangulation
Involves using different sources of information in order to increase the validity of a study
These sources are likely to be stakeholders in a program - participants, other researchers, program staff, other community members, and so on.
Then we put all data in single framework & apply various statistical tools to find out the dynamic on the market.
During the analysis stage, feedback from the stakeholder groups would be compared to determine areas of agreement as well as areas of divergence


