
Key Insights
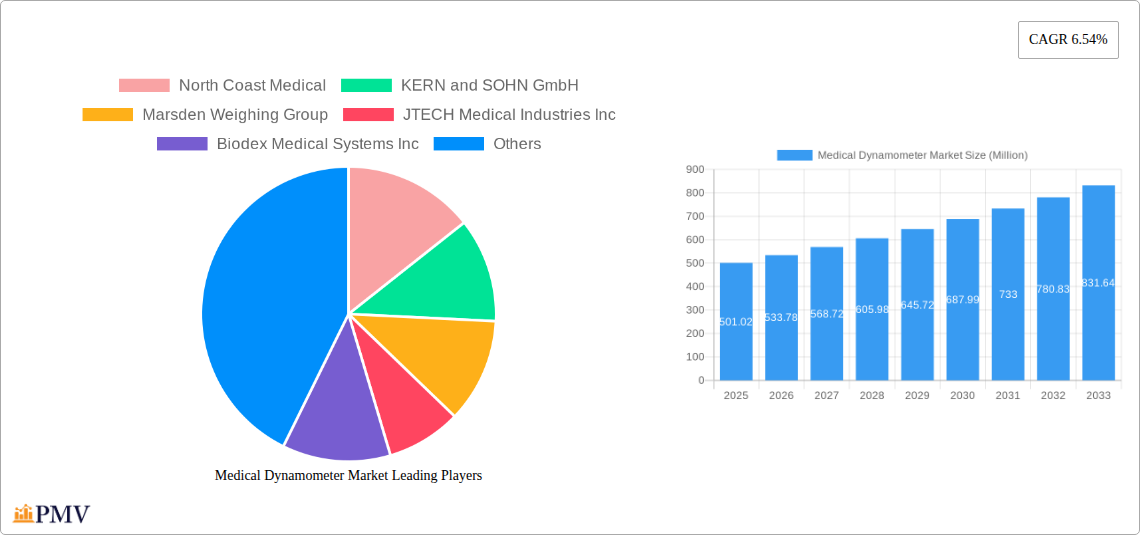
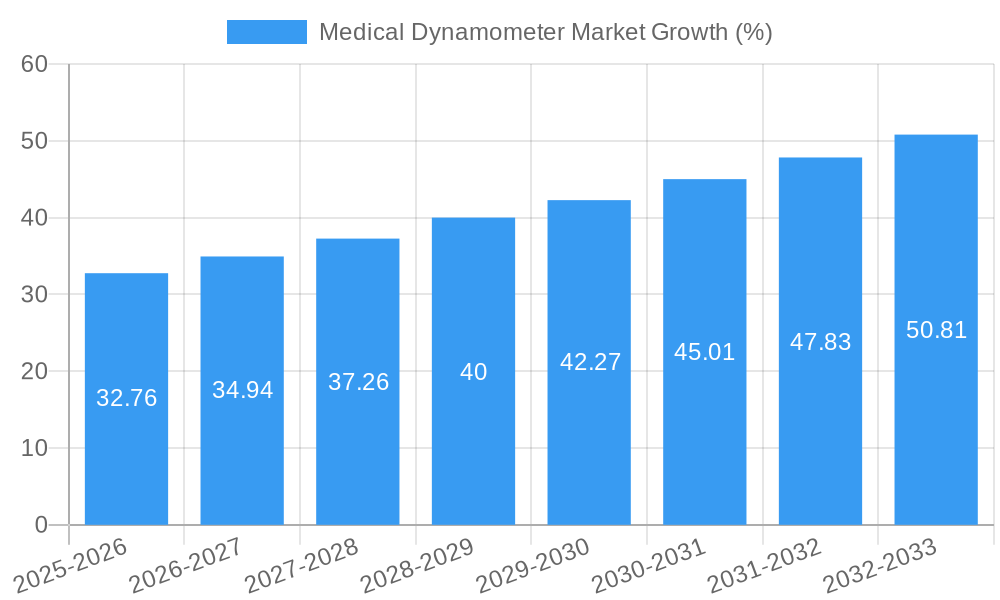
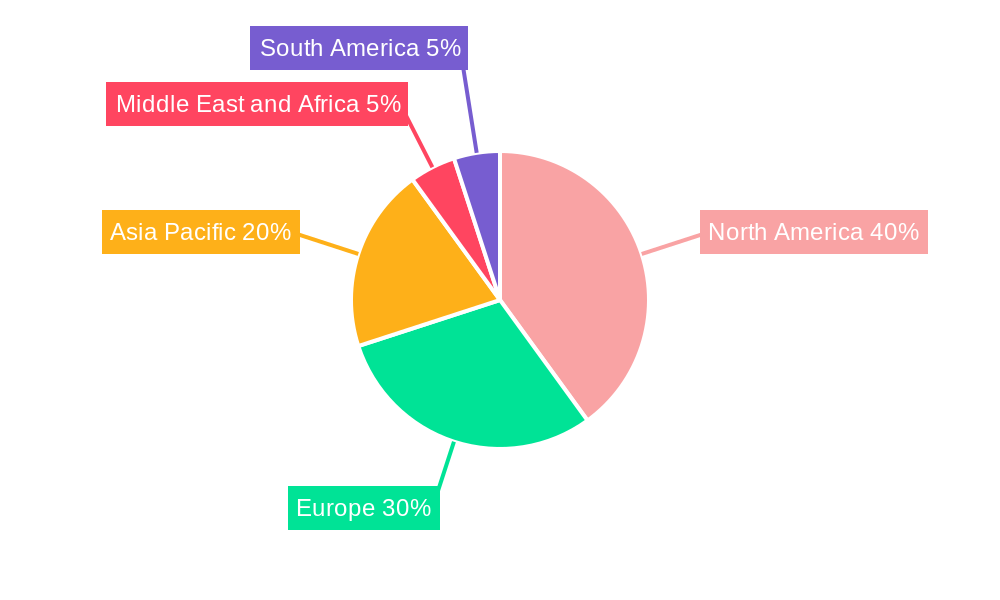
The global medical dynamometer market, valued at $501.02 million in 2025, is poised for robust growth, exhibiting a Compound Annual Growth Rate (CAGR) of 6.54% from 2025 to 2033. This expansion is driven by several key factors. The increasing prevalence of musculoskeletal disorders, neurological conditions, and cardiovascular diseases necessitates frequent strength assessment, fueling demand for accurate and reliable dynamometers. Furthermore, advancements in dynamometer technology, such as the integration of digital sensors and software for improved data analysis and remote monitoring, are enhancing their usability and appeal among healthcare professionals. The growing adoption of these devices in various healthcare settings, including hospitals, clinics, and rehabilitation centers, further contributes to market growth. The market is segmented by usage (hospitals/clinics, rehabilitation centers, others), product type (chest, hand, push-pull, squeeze dynamometers, and other devices), and application (orthopedic, neurology, cardiology, medical trauma, and others). North America currently holds a significant market share, attributable to advanced healthcare infrastructure and high adoption rates. However, the Asia-Pacific region is expected to witness substantial growth due to rising healthcare expenditure and increasing awareness of rehabilitation therapies.
The market faces certain restraints, primarily the high initial investment cost of advanced dynamometer systems and the need for skilled personnel to operate and interpret the data. However, these challenges are mitigated by the long-term cost benefits associated with improved patient outcomes and reduced healthcare costs through early diagnosis and targeted interventions. Competitive pressures among established players like North Coast Medical, KERN and SOHN GmbH, and Biodex Medical Systems Inc., coupled with the emergence of new entrants, are expected to foster innovation and drive further market expansion. The market's future trajectory suggests continuous growth, driven by technological improvements, expanding applications, and a global rise in chronic diseases requiring regular strength assessment. This makes the medical dynamometer market an attractive area for investment and innovation within the healthcare technology sector.
Medical Dynamometer Market: A Comprehensive Report (2019-2033)
This in-depth report provides a comprehensive analysis of the global Medical Dynamometer Market, offering valuable insights for stakeholders, investors, and industry professionals. Covering the period from 2019 to 2033, with 2025 as the base year and a forecast period of 2025-2033, this report meticulously examines market dynamics, competitive landscapes, and future growth potential. The global medical dynamometer market size was valued at xx Million in 2025 and is projected to reach xx Million by 2033, registering a CAGR of xx% during the forecast period.
Medical Dynamometer Market Market Structure & Competitive Dynamics
This section delves into the competitive dynamics of the medical dynamometer market, analyzing market concentration, innovation ecosystems, regulatory frameworks, product substitutes, end-user trends, and mergers and acquisitions (M&A) activities. The market is characterized by a moderately concentrated landscape, with key players holding significant market share. The top five companies account for approximately xx% of the global market share in 2025. However, several smaller players contribute significantly to innovation and niche market penetration.
- Market Concentration: The Herfindahl-Hirschman Index (HHI) for the market is estimated at xx, indicating a moderately concentrated market structure.
- Innovation Ecosystems: The market is driven by continuous innovation in sensor technology, data analytics, and ergonomic design. Collaborative partnerships between manufacturers and research institutions are fostering product development.
- Regulatory Frameworks: Stringent regulatory approvals (e.g., FDA clearance) and compliance with international standards significantly influence market entry and product development.
- Product Substitutes: Alternative methods for assessing muscle strength and function, such as manual muscle testing, pose a degree of competitive pressure. However, the accuracy and objectivity offered by dynamometers continue to favor their adoption.
- End-User Trends: The increasing prevalence of musculoskeletal disorders and the growing demand for objective assessment tools are key drivers of market growth.
- M&A Activities: The past five years have witnessed xx M&A deals in the medical dynamometer market, with a total transaction value of approximately xx Million. These acquisitions primarily focus on expanding product portfolios and geographical reach.
Medical Dynamometer Market Industry Trends & Insights
This section explores key trends shaping the medical dynamometer market, encompassing market growth drivers, technological disruptions, evolving consumer preferences, and competitive dynamics. The market is experiencing robust growth fueled by several factors, including the rising prevalence of chronic diseases requiring rehabilitation, advancements in dynamometer technology, and increasing healthcare expenditure globally. The market is expected to witness a Compound Annual Growth Rate (CAGR) of xx% between 2025 and 2033. Market penetration in developing economies is also projected to increase significantly during this period, driven by rising healthcare awareness and improving healthcare infrastructure. Technological advancements such as wireless connectivity, data logging capabilities, and sophisticated software for data analysis are driving the adoption of advanced dynamometers.
Dominant Markets & Segments in Medical Dynamometer Market
This section identifies the leading regions, countries, and segments within the medical dynamometer market. Analysis reveals that North America currently holds the largest market share, driven by factors such as advanced healthcare infrastructure, high adoption rates of advanced technologies, and a sizable geriatric population. However, the Asia-Pacific region is projected to witness the fastest growth in the coming years, owing to rapidly rising healthcare expenditure and increasing awareness about musculoskeletal disorders.
By Usage:
- Hospitals/Clinics: This segment dominates the market due to high demand for accurate muscle strength assessment in various medical specialties. Key drivers include increasing patient volume, the need for objective clinical measurements, and the integration of dynamometers into standard clinical protocols.
- Rehabilitation Centers: This segment shows significant growth potential, driven by the rising prevalence of musculoskeletal injuries and the growing focus on evidence-based rehabilitation practices.
- Others (e.g., research institutions, sports medicine clinics): This segment represents a niche market with steady growth.
By Product:
- Hand Dynamometer: This segment accounts for the largest share due to its widespread use in assessing hand grip strength.
- Other Devices: This segment comprises specialized dynamometers for assessing specific muscle groups, which continue to drive product innovation.
By Application:
- Orthopedic: This is the largest application segment, driven by the high prevalence of orthopedic injuries and the crucial role of dynamometry in assessing functional recovery.
- Neurology: Neurological applications are gaining momentum due to increased research on motor neuron diseases and the need for objective assessment tools.
Medical Dynamometer Market Product Innovations
Recent product innovations focus on improving accuracy, portability, and data analysis capabilities. Wireless dynamometers with integrated software for data visualization and reporting are gaining popularity. Miniaturized devices are improving patient comfort and ease of use. These developments cater to the growing demand for efficient and user-friendly diagnostic tools.
Report Segmentation & Scope
This report provides a detailed segmentation of the medical dynamometer market across various parameters. The segmentation provides a granular view of the market, allowing for a nuanced understanding of growth dynamics in each segment. The report covers all major geographical regions and offers market size estimations and growth projections for each segment. Competitive analysis within each segment identifies key players and their market strategies.
By Usage: Hospitals/Clinics, Rehabilitation Centers, Others By Product: Chest Dynamometer, Hand Dynamometer, Push Pull Dynamometer, Squeeze Dynamometer, Other Devices By Application: Orthopedic, Neurology, Cardiology, Medical Trauma, Others
Key Drivers of Medical Dynamometer Market Growth
The medical dynamometer market is driven by several key factors. The rising prevalence of chronic diseases like arthritis, stroke, and spinal cord injuries necessitates regular muscle strength assessment, fueling demand for dynamometers. Technological advancements, such as wireless connectivity and improved data analysis software, are enhancing the functionality and usability of these devices. Moreover, increasing healthcare expenditure and government initiatives to improve healthcare infrastructure are contributing to market growth.
Challenges in the Medical Dynamometer Market Sector
Several challenges hinder the growth of the medical dynamometer market. High initial investment costs for advanced dynamometers can be a barrier to adoption, particularly in resource-constrained settings. Furthermore, the presence of alternative assessment methods and the need for skilled personnel to operate these devices pose challenges. The market also faces competitive pressure from emerging technologies in muscle strength assessment.
Leading Players in the Medical Dynamometer Market Market
- North Coast Medical
- KERN and SOHN GmbH
- Marsden Weighing Group
- JTECH Medical Industries Inc
- Biodex Medical Systems Inc
- Lafayette Instrument
- Fabrication Enterprises
- Charder Electronic Co Ltd
Key Developments in Medical Dynamometer Market Sector
- January 2023: JTECH Medical Industries Inc. launched a new wireless hand dynamometer with enhanced data analysis capabilities.
- March 2022: Biodex Medical Systems Inc. acquired a smaller competitor, expanding its product portfolio.
- Further developments are detailed in the full report.
Strategic Medical Dynamometer Market Market Outlook
The medical dynamometer market holds significant growth potential, driven by increasing healthcare spending, technological advancements, and growing awareness of the importance of muscle strength assessment. Strategic opportunities exist in developing innovative products with enhanced features, expanding into emerging markets, and forging strategic partnerships to broaden market reach. Focus on user-friendly design and integration with electronic health record systems will be crucial for future success.
Medical Dynamometer Market Segmentation
-
1. Product
- 1.1. Chest Dynamometer
- 1.2. Hand Dynamometer
- 1.3. Push Pull Dynamometer
- 1.4. Squeeze Dynamometer
- 1.5. Other Devices
-
2. Application
- 2.1. Orthopedic
- 2.2. Neurology
- 2.3. Cardiology
- 2.4. Medical Trauma
- 2.5. Others
-
3. Usage
- 3.1. Hospitals/Clinics
- 3.2. Rehabilitation Centers
- 3.3. Others
Medical Dynamometer Market Segmentation By Geography
-
1. North America
- 1.1. United States
- 1.2. Canada
- 1.3. Mexico
-
2. Europe
- 2.1. Germany
- 2.2. United Kingdom
- 2.3. France
- 2.4. Italy
- 2.5. Spain
- 2.6. Rest of Europe
-
3. Asia Pacific
- 3.1. China
- 3.2. Japan
- 3.3. India
- 3.4. Australia
- 3.5. South Korea
- 3.6. Rest of Asia Pacific
-
4. Middle East and Africa
- 4.1. GCC
- 4.2. South Africa
- 4.3. Rest of Middle East and Africa
-
5. South America
- 5.1. Brazil
- 5.2. Argentina
- 5.3. Rest of South America
Medical Dynamometer Market REPORT HIGHLIGHTS
| Aspects | Details |
|---|---|
| Study Period | 2019-2033 |
| Base Year | 2024 |
| Estimated Year | 2025 |
| Forecast Period | 2025-2033 |
| Historical Period | 2019-2024 |
| Growth Rate | CAGR of 6.54% from 2019-2033 |
| Segmentation |
|
Table of Contents
- 1. Introduction
- 1.1. Research Scope
- 1.2. Market Segmentation
- 1.3. Research Methodology
- 1.4. Definitions and Assumptions
- 2. Executive Summary
- 2.1. Introduction
- 3. Market Dynamics
- 3.1. Introduction
- 3.2. Market Drivers
- 3.2.1. ; Rising Incidence of Osteoporosis; Increasing Sport Related Injuries and Disorders
- 3.3. Market Restrains
- 3.3.1. ; High Cost of Devices
- 3.4. Market Trends
- 3.4.1. Hand Dynamometer is Expected to Hold the Largest Market Share in the Medical Dynamometer Market
- 4. Market Factor Analysis
- 4.1. Porters Five Forces
- 4.2. Supply/Value Chain
- 4.3. PESTEL analysis
- 4.4. Market Entropy
- 4.5. Patent/Trademark Analysis
- 5. Global Medical Dynamometer Market Analysis, Insights and Forecast, 2019-2031
- 5.1. Market Analysis, Insights and Forecast - by Product
- 5.1.1. Chest Dynamometer
- 5.1.2. Hand Dynamometer
- 5.1.3. Push Pull Dynamometer
- 5.1.4. Squeeze Dynamometer
- 5.1.5. Other Devices
- 5.2. Market Analysis, Insights and Forecast - by Application
- 5.2.1. Orthopedic
- 5.2.2. Neurology
- 5.2.3. Cardiology
- 5.2.4. Medical Trauma
- 5.2.5. Others
- 5.3. Market Analysis, Insights and Forecast - by Usage
- 5.3.1. Hospitals/Clinics
- 5.3.2. Rehabilitation Centers
- 5.3.3. Others
- 5.4. Market Analysis, Insights and Forecast - by Region
- 5.4.1. North America
- 5.4.2. Europe
- 5.4.3. Asia Pacific
- 5.4.4. Middle East and Africa
- 5.4.5. South America
- 5.1. Market Analysis, Insights and Forecast - by Product
- 6. North America Medical Dynamometer Market Analysis, Insights and Forecast, 2019-2031
- 6.1. Market Analysis, Insights and Forecast - by Product
- 6.1.1. Chest Dynamometer
- 6.1.2. Hand Dynamometer
- 6.1.3. Push Pull Dynamometer
- 6.1.4. Squeeze Dynamometer
- 6.1.5. Other Devices
- 6.2. Market Analysis, Insights and Forecast - by Application
- 6.2.1. Orthopedic
- 6.2.2. Neurology
- 6.2.3. Cardiology
- 6.2.4. Medical Trauma
- 6.2.5. Others
- 6.3. Market Analysis, Insights and Forecast - by Usage
- 6.3.1. Hospitals/Clinics
- 6.3.2. Rehabilitation Centers
- 6.3.3. Others
- 6.1. Market Analysis, Insights and Forecast - by Product
- 7. Europe Medical Dynamometer Market Analysis, Insights and Forecast, 2019-2031
- 7.1. Market Analysis, Insights and Forecast - by Product
- 7.1.1. Chest Dynamometer
- 7.1.2. Hand Dynamometer
- 7.1.3. Push Pull Dynamometer
- 7.1.4. Squeeze Dynamometer
- 7.1.5. Other Devices
- 7.2. Market Analysis, Insights and Forecast - by Application
- 7.2.1. Orthopedic
- 7.2.2. Neurology
- 7.2.3. Cardiology
- 7.2.4. Medical Trauma
- 7.2.5. Others
- 7.3. Market Analysis, Insights and Forecast - by Usage
- 7.3.1. Hospitals/Clinics
- 7.3.2. Rehabilitation Centers
- 7.3.3. Others
- 7.1. Market Analysis, Insights and Forecast - by Product
- 8. Asia Pacific Medical Dynamometer Market Analysis, Insights and Forecast, 2019-2031
- 8.1. Market Analysis, Insights and Forecast - by Product
- 8.1.1. Chest Dynamometer
- 8.1.2. Hand Dynamometer
- 8.1.3. Push Pull Dynamometer
- 8.1.4. Squeeze Dynamometer
- 8.1.5. Other Devices
- 8.2. Market Analysis, Insights and Forecast - by Application
- 8.2.1. Orthopedic
- 8.2.2. Neurology
- 8.2.3. Cardiology
- 8.2.4. Medical Trauma
- 8.2.5. Others
- 8.3. Market Analysis, Insights and Forecast - by Usage
- 8.3.1. Hospitals/Clinics
- 8.3.2. Rehabilitation Centers
- 8.3.3. Others
- 8.1. Market Analysis, Insights and Forecast - by Product
- 9. Middle East and Africa Medical Dynamometer Market Analysis, Insights and Forecast, 2019-2031
- 9.1. Market Analysis, Insights and Forecast - by Product
- 9.1.1. Chest Dynamometer
- 9.1.2. Hand Dynamometer
- 9.1.3. Push Pull Dynamometer
- 9.1.4. Squeeze Dynamometer
- 9.1.5. Other Devices
- 9.2. Market Analysis, Insights and Forecast - by Application
- 9.2.1. Orthopedic
- 9.2.2. Neurology
- 9.2.3. Cardiology
- 9.2.4. Medical Trauma
- 9.2.5. Others
- 9.3. Market Analysis, Insights and Forecast - by Usage
- 9.3.1. Hospitals/Clinics
- 9.3.2. Rehabilitation Centers
- 9.3.3. Others
- 9.1. Market Analysis, Insights and Forecast - by Product
- 10. South America Medical Dynamometer Market Analysis, Insights and Forecast, 2019-2031
- 10.1. Market Analysis, Insights and Forecast - by Product
- 10.1.1. Chest Dynamometer
- 10.1.2. Hand Dynamometer
- 10.1.3. Push Pull Dynamometer
- 10.1.4. Squeeze Dynamometer
- 10.1.5. Other Devices
- 10.2. Market Analysis, Insights and Forecast - by Application
- 10.2.1. Orthopedic
- 10.2.2. Neurology
- 10.2.3. Cardiology
- 10.2.4. Medical Trauma
- 10.2.5. Others
- 10.3. Market Analysis, Insights and Forecast - by Usage
- 10.3.1. Hospitals/Clinics
- 10.3.2. Rehabilitation Centers
- 10.3.3. Others
- 10.1. Market Analysis, Insights and Forecast - by Product
- 11. North America Medical Dynamometer Market Analysis, Insights and Forecast, 2019-2031
- 11.1. Market Analysis, Insights and Forecast - By Country/Sub-region
- 11.1.1 United States
- 11.1.2 Canada
- 11.1.3 Mexico
- 12. Europe Medical Dynamometer Market Analysis, Insights and Forecast, 2019-2031
- 12.1. Market Analysis, Insights and Forecast - By Country/Sub-region
- 12.1.1 Germany
- 12.1.2 United Kingdom
- 12.1.3 France
- 12.1.4 Italy
- 12.1.5 Spain
- 12.1.6 Rest of Europe
- 13. Asia Pacific Medical Dynamometer Market Analysis, Insights and Forecast, 2019-2031
- 13.1. Market Analysis, Insights and Forecast - By Country/Sub-region
- 13.1.1 China
- 13.1.2 Japan
- 13.1.3 India
- 13.1.4 Australia
- 13.1.5 South Korea
- 13.1.6 Rest of Asia Pacific
- 14. Middle East and Africa Medical Dynamometer Market Analysis, Insights and Forecast, 2019-2031
- 14.1. Market Analysis, Insights and Forecast - By Country/Sub-region
- 14.1.1 GCC
- 14.1.2 South Africa
- 14.1.3 Rest of Middle East and Africa
- 15. South America Medical Dynamometer Market Analysis, Insights and Forecast, 2019-2031
- 15.1. Market Analysis, Insights and Forecast - By Country/Sub-region
- 15.1.1 Brazil
- 15.1.2 Argentina
- 15.1.3 Rest of South America
- 16. Competitive Analysis
- 16.1. Global Market Share Analysis 2024
- 16.2. Company Profiles
- 16.2.1 North Coast Medical
- 16.2.1.1. Overview
- 16.2.1.2. Products
- 16.2.1.3. SWOT Analysis
- 16.2.1.4. Recent Developments
- 16.2.1.5. Financials (Based on Availability)
- 16.2.2 KERN and SOHN GmbH
- 16.2.2.1. Overview
- 16.2.2.2. Products
- 16.2.2.3. SWOT Analysis
- 16.2.2.4. Recent Developments
- 16.2.2.5. Financials (Based on Availability)
- 16.2.3 Marsden Weighing Group
- 16.2.3.1. Overview
- 16.2.3.2. Products
- 16.2.3.3. SWOT Analysis
- 16.2.3.4. Recent Developments
- 16.2.3.5. Financials (Based on Availability)
- 16.2.4 JTECH Medical Industries Inc
- 16.2.4.1. Overview
- 16.2.4.2. Products
- 16.2.4.3. SWOT Analysis
- 16.2.4.4. Recent Developments
- 16.2.4.5. Financials (Based on Availability)
- 16.2.5 Biodex Medical Systems Inc
- 16.2.5.1. Overview
- 16.2.5.2. Products
- 16.2.5.3. SWOT Analysis
- 16.2.5.4. Recent Developments
- 16.2.5.5. Financials (Based on Availability)
- 16.2.6 Lafayette Instrument*List Not Exhaustive
- 16.2.6.1. Overview
- 16.2.6.2. Products
- 16.2.6.3. SWOT Analysis
- 16.2.6.4. Recent Developments
- 16.2.6.5. Financials (Based on Availability)
- 16.2.7 Fabrication Enterprises
- 16.2.7.1. Overview
- 16.2.7.2. Products
- 16.2.7.3. SWOT Analysis
- 16.2.7.4. Recent Developments
- 16.2.7.5. Financials (Based on Availability)
- 16.2.8 Charder Electronic Co Ltd
- 16.2.8.1. Overview
- 16.2.8.2. Products
- 16.2.8.3. SWOT Analysis
- 16.2.8.4. Recent Developments
- 16.2.8.5. Financials (Based on Availability)
- 16.2.1 North Coast Medical
List of Figures
- Figure 1: Global Medical Dynamometer Market Revenue Breakdown (Million, %) by Region 2024 & 2032
- Figure 2: North America Medical Dynamometer Market Revenue (Million), by Country 2024 & 2032
- Figure 3: North America Medical Dynamometer Market Revenue Share (%), by Country 2024 & 2032
- Figure 4: Europe Medical Dynamometer Market Revenue (Million), by Country 2024 & 2032
- Figure 5: Europe Medical Dynamometer Market Revenue Share (%), by Country 2024 & 2032
- Figure 6: Asia Pacific Medical Dynamometer Market Revenue (Million), by Country 2024 & 2032
- Figure 7: Asia Pacific Medical Dynamometer Market Revenue Share (%), by Country 2024 & 2032
- Figure 8: Middle East and Africa Medical Dynamometer Market Revenue (Million), by Country 2024 & 2032
- Figure 9: Middle East and Africa Medical Dynamometer Market Revenue Share (%), by Country 2024 & 2032
- Figure 10: South America Medical Dynamometer Market Revenue (Million), by Country 2024 & 2032
- Figure 11: South America Medical Dynamometer Market Revenue Share (%), by Country 2024 & 2032
- Figure 12: North America Medical Dynamometer Market Revenue (Million), by Product 2024 & 2032
- Figure 13: North America Medical Dynamometer Market Revenue Share (%), by Product 2024 & 2032
- Figure 14: North America Medical Dynamometer Market Revenue (Million), by Application 2024 & 2032
- Figure 15: North America Medical Dynamometer Market Revenue Share (%), by Application 2024 & 2032
- Figure 16: North America Medical Dynamometer Market Revenue (Million), by Usage 2024 & 2032
- Figure 17: North America Medical Dynamometer Market Revenue Share (%), by Usage 2024 & 2032
- Figure 18: North America Medical Dynamometer Market Revenue (Million), by Country 2024 & 2032
- Figure 19: North America Medical Dynamometer Market Revenue Share (%), by Country 2024 & 2032
- Figure 20: Europe Medical Dynamometer Market Revenue (Million), by Product 2024 & 2032
- Figure 21: Europe Medical Dynamometer Market Revenue Share (%), by Product 2024 & 2032
- Figure 22: Europe Medical Dynamometer Market Revenue (Million), by Application 2024 & 2032
- Figure 23: Europe Medical Dynamometer Market Revenue Share (%), by Application 2024 & 2032
- Figure 24: Europe Medical Dynamometer Market Revenue (Million), by Usage 2024 & 2032
- Figure 25: Europe Medical Dynamometer Market Revenue Share (%), by Usage 2024 & 2032
- Figure 26: Europe Medical Dynamometer Market Revenue (Million), by Country 2024 & 2032
- Figure 27: Europe Medical Dynamometer Market Revenue Share (%), by Country 2024 & 2032
- Figure 28: Asia Pacific Medical Dynamometer Market Revenue (Million), by Product 2024 & 2032
- Figure 29: Asia Pacific Medical Dynamometer Market Revenue Share (%), by Product 2024 & 2032
- Figure 30: Asia Pacific Medical Dynamometer Market Revenue (Million), by Application 2024 & 2032
- Figure 31: Asia Pacific Medical Dynamometer Market Revenue Share (%), by Application 2024 & 2032
- Figure 32: Asia Pacific Medical Dynamometer Market Revenue (Million), by Usage 2024 & 2032
- Figure 33: Asia Pacific Medical Dynamometer Market Revenue Share (%), by Usage 2024 & 2032
- Figure 34: Asia Pacific Medical Dynamometer Market Revenue (Million), by Country 2024 & 2032
- Figure 35: Asia Pacific Medical Dynamometer Market Revenue Share (%), by Country 2024 & 2032
- Figure 36: Middle East and Africa Medical Dynamometer Market Revenue (Million), by Product 2024 & 2032
- Figure 37: Middle East and Africa Medical Dynamometer Market Revenue Share (%), by Product 2024 & 2032
- Figure 38: Middle East and Africa Medical Dynamometer Market Revenue (Million), by Application 2024 & 2032
- Figure 39: Middle East and Africa Medical Dynamometer Market Revenue Share (%), by Application 2024 & 2032
- Figure 40: Middle East and Africa Medical Dynamometer Market Revenue (Million), by Usage 2024 & 2032
- Figure 41: Middle East and Africa Medical Dynamometer Market Revenue Share (%), by Usage 2024 & 2032
- Figure 42: Middle East and Africa Medical Dynamometer Market Revenue (Million), by Country 2024 & 2032
- Figure 43: Middle East and Africa Medical Dynamometer Market Revenue Share (%), by Country 2024 & 2032
- Figure 44: South America Medical Dynamometer Market Revenue (Million), by Product 2024 & 2032
- Figure 45: South America Medical Dynamometer Market Revenue Share (%), by Product 2024 & 2032
- Figure 46: South America Medical Dynamometer Market Revenue (Million), by Application 2024 & 2032
- Figure 47: South America Medical Dynamometer Market Revenue Share (%), by Application 2024 & 2032
- Figure 48: South America Medical Dynamometer Market Revenue (Million), by Usage 2024 & 2032
- Figure 49: South America Medical Dynamometer Market Revenue Share (%), by Usage 2024 & 2032
- Figure 50: South America Medical Dynamometer Market Revenue (Million), by Country 2024 & 2032
- Figure 51: South America Medical Dynamometer Market Revenue Share (%), by Country 2024 & 2032
List of Tables
- Table 1: Global Medical Dynamometer Market Revenue Million Forecast, by Region 2019 & 2032
- Table 2: Global Medical Dynamometer Market Revenue Million Forecast, by Product 2019 & 2032
- Table 3: Global Medical Dynamometer Market Revenue Million Forecast, by Application 2019 & 2032
- Table 4: Global Medical Dynamometer Market Revenue Million Forecast, by Usage 2019 & 2032
- Table 5: Global Medical Dynamometer Market Revenue Million Forecast, by Region 2019 & 2032
- Table 6: Global Medical Dynamometer Market Revenue Million Forecast, by Country 2019 & 2032
- Table 7: United States Medical Dynamometer Market Revenue (Million) Forecast, by Application 2019 & 2032
- Table 8: Canada Medical Dynamometer Market Revenue (Million) Forecast, by Application 2019 & 2032
- Table 9: Mexico Medical Dynamometer Market Revenue (Million) Forecast, by Application 2019 & 2032
- Table 10: Global Medical Dynamometer Market Revenue Million Forecast, by Country 2019 & 2032
- Table 11: Germany Medical Dynamometer Market Revenue (Million) Forecast, by Application 2019 & 2032
- Table 12: United Kingdom Medical Dynamometer Market Revenue (Million) Forecast, by Application 2019 & 2032
- Table 13: France Medical Dynamometer Market Revenue (Million) Forecast, by Application 2019 & 2032
- Table 14: Italy Medical Dynamometer Market Revenue (Million) Forecast, by Application 2019 & 2032
- Table 15: Spain Medical Dynamometer Market Revenue (Million) Forecast, by Application 2019 & 2032
- Table 16: Rest of Europe Medical Dynamometer Market Revenue (Million) Forecast, by Application 2019 & 2032
- Table 17: Global Medical Dynamometer Market Revenue Million Forecast, by Country 2019 & 2032
- Table 18: China Medical Dynamometer Market Revenue (Million) Forecast, by Application 2019 & 2032
- Table 19: Japan Medical Dynamometer Market Revenue (Million) Forecast, by Application 2019 & 2032
- Table 20: India Medical Dynamometer Market Revenue (Million) Forecast, by Application 2019 & 2032
- Table 21: Australia Medical Dynamometer Market Revenue (Million) Forecast, by Application 2019 & 2032
- Table 22: South Korea Medical Dynamometer Market Revenue (Million) Forecast, by Application 2019 & 2032
- Table 23: Rest of Asia Pacific Medical Dynamometer Market Revenue (Million) Forecast, by Application 2019 & 2032
- Table 24: Global Medical Dynamometer Market Revenue Million Forecast, by Country 2019 & 2032
- Table 25: GCC Medical Dynamometer Market Revenue (Million) Forecast, by Application 2019 & 2032
- Table 26: South Africa Medical Dynamometer Market Revenue (Million) Forecast, by Application 2019 & 2032
- Table 27: Rest of Middle East and Africa Medical Dynamometer Market Revenue (Million) Forecast, by Application 2019 & 2032
- Table 28: Global Medical Dynamometer Market Revenue Million Forecast, by Country 2019 & 2032
- Table 29: Brazil Medical Dynamometer Market Revenue (Million) Forecast, by Application 2019 & 2032
- Table 30: Argentina Medical Dynamometer Market Revenue (Million) Forecast, by Application 2019 & 2032
- Table 31: Rest of South America Medical Dynamometer Market Revenue (Million) Forecast, by Application 2019 & 2032
- Table 32: Global Medical Dynamometer Market Revenue Million Forecast, by Product 2019 & 2032
- Table 33: Global Medical Dynamometer Market Revenue Million Forecast, by Application 2019 & 2032
- Table 34: Global Medical Dynamometer Market Revenue Million Forecast, by Usage 2019 & 2032
- Table 35: Global Medical Dynamometer Market Revenue Million Forecast, by Country 2019 & 2032
- Table 36: United States Medical Dynamometer Market Revenue (Million) Forecast, by Application 2019 & 2032
- Table 37: Canada Medical Dynamometer Market Revenue (Million) Forecast, by Application 2019 & 2032
- Table 38: Mexico Medical Dynamometer Market Revenue (Million) Forecast, by Application 2019 & 2032
- Table 39: Global Medical Dynamometer Market Revenue Million Forecast, by Product 2019 & 2032
- Table 40: Global Medical Dynamometer Market Revenue Million Forecast, by Application 2019 & 2032
- Table 41: Global Medical Dynamometer Market Revenue Million Forecast, by Usage 2019 & 2032
- Table 42: Global Medical Dynamometer Market Revenue Million Forecast, by Country 2019 & 2032
- Table 43: Germany Medical Dynamometer Market Revenue (Million) Forecast, by Application 2019 & 2032
- Table 44: United Kingdom Medical Dynamometer Market Revenue (Million) Forecast, by Application 2019 & 2032
- Table 45: France Medical Dynamometer Market Revenue (Million) Forecast, by Application 2019 & 2032
- Table 46: Italy Medical Dynamometer Market Revenue (Million) Forecast, by Application 2019 & 2032
- Table 47: Spain Medical Dynamometer Market Revenue (Million) Forecast, by Application 2019 & 2032
- Table 48: Rest of Europe Medical Dynamometer Market Revenue (Million) Forecast, by Application 2019 & 2032
- Table 49: Global Medical Dynamometer Market Revenue Million Forecast, by Product 2019 & 2032
- Table 50: Global Medical Dynamometer Market Revenue Million Forecast, by Application 2019 & 2032
- Table 51: Global Medical Dynamometer Market Revenue Million Forecast, by Usage 2019 & 2032
- Table 52: Global Medical Dynamometer Market Revenue Million Forecast, by Country 2019 & 2032
- Table 53: China Medical Dynamometer Market Revenue (Million) Forecast, by Application 2019 & 2032
- Table 54: Japan Medical Dynamometer Market Revenue (Million) Forecast, by Application 2019 & 2032
- Table 55: India Medical Dynamometer Market Revenue (Million) Forecast, by Application 2019 & 2032
- Table 56: Australia Medical Dynamometer Market Revenue (Million) Forecast, by Application 2019 & 2032
- Table 57: South Korea Medical Dynamometer Market Revenue (Million) Forecast, by Application 2019 & 2032
- Table 58: Rest of Asia Pacific Medical Dynamometer Market Revenue (Million) Forecast, by Application 2019 & 2032
- Table 59: Global Medical Dynamometer Market Revenue Million Forecast, by Product 2019 & 2032
- Table 60: Global Medical Dynamometer Market Revenue Million Forecast, by Application 2019 & 2032
- Table 61: Global Medical Dynamometer Market Revenue Million Forecast, by Usage 2019 & 2032
- Table 62: Global Medical Dynamometer Market Revenue Million Forecast, by Country 2019 & 2032
- Table 63: GCC Medical Dynamometer Market Revenue (Million) Forecast, by Application 2019 & 2032
- Table 64: South Africa Medical Dynamometer Market Revenue (Million) Forecast, by Application 2019 & 2032
- Table 65: Rest of Middle East and Africa Medical Dynamometer Market Revenue (Million) Forecast, by Application 2019 & 2032
- Table 66: Global Medical Dynamometer Market Revenue Million Forecast, by Product 2019 & 2032
- Table 67: Global Medical Dynamometer Market Revenue Million Forecast, by Application 2019 & 2032
- Table 68: Global Medical Dynamometer Market Revenue Million Forecast, by Usage 2019 & 2032
- Table 69: Global Medical Dynamometer Market Revenue Million Forecast, by Country 2019 & 2032
- Table 70: Brazil Medical Dynamometer Market Revenue (Million) Forecast, by Application 2019 & 2032
- Table 71: Argentina Medical Dynamometer Market Revenue (Million) Forecast, by Application 2019 & 2032
- Table 72: Rest of South America Medical Dynamometer Market Revenue (Million) Forecast, by Application 2019 & 2032
Frequently Asked Questions
1. What is the projected Compound Annual Growth Rate (CAGR) of the Medical Dynamometer Market?
The projected CAGR is approximately 6.54%.
2. Which companies are prominent players in the Medical Dynamometer Market?
Key companies in the market include North Coast Medical, KERN and SOHN GmbH, Marsden Weighing Group, JTECH Medical Industries Inc, Biodex Medical Systems Inc, Lafayette Instrument*List Not Exhaustive, Fabrication Enterprises, Charder Electronic Co Ltd.
3. What are the main segments of the Medical Dynamometer Market?
The market segments include Product, Application, Usage.
4. Can you provide details about the market size?
The market size is estimated to be USD 501.02 Million as of 2022.
5. What are some drivers contributing to market growth?
; Rising Incidence of Osteoporosis; Increasing Sport Related Injuries and Disorders.
6. What are the notable trends driving market growth?
Hand Dynamometer is Expected to Hold the Largest Market Share in the Medical Dynamometer Market.
7. Are there any restraints impacting market growth?
; High Cost of Devices.
8. Can you provide examples of recent developments in the market?
N/A
9. What pricing options are available for accessing the report?
Pricing options include single-user, multi-user, and enterprise licenses priced at USD 4750, USD 5250, and USD 8750 respectively.
10. Is the market size provided in terms of value or volume?
The market size is provided in terms of value, measured in Million.
11. Are there any specific market keywords associated with the report?
Yes, the market keyword associated with the report is "Medical Dynamometer Market," which aids in identifying and referencing the specific market segment covered.
12. How do I determine which pricing option suits my needs best?
The pricing options vary based on user requirements and access needs. Individual users may opt for single-user licenses, while businesses requiring broader access may choose multi-user or enterprise licenses for cost-effective access to the report.
13. Are there any additional resources or data provided in the Medical Dynamometer Market report?
While the report offers comprehensive insights, it's advisable to review the specific contents or supplementary materials provided to ascertain if additional resources or data are available.
14. How can I stay updated on further developments or reports in the Medical Dynamometer Market?
To stay informed about further developments, trends, and reports in the Medical Dynamometer Market, consider subscribing to industry newsletters, following relevant companies and organizations, or regularly checking reputable industry news sources and publications.
Methodology
Step 1 - Identification of Relevant Samples Size from Population Database


Step 2 - Approaches for Defining Global Market Size (Value, Volume* & Price*)

Note*: In applicable scenarios
Step 3 - Data Sources
Primary Research
- Web Analytics
- Survey Reports
- Research Institute
- Latest Research Reports
- Opinion Leaders
Secondary Research
- Annual Reports
- White Paper
- Latest Press Release
- Industry Association
- Paid Database
- Investor Presentations

Step 4 - Data Triangulation
Involves using different sources of information in order to increase the validity of a study
These sources are likely to be stakeholders in a program - participants, other researchers, program staff, other community members, and so on.
Then we put all data in single framework & apply various statistical tools to find out the dynamic on the market.
During the analysis stage, feedback from the stakeholder groups would be compared to determine areas of agreement as well as areas of divergence


