
Key Insights
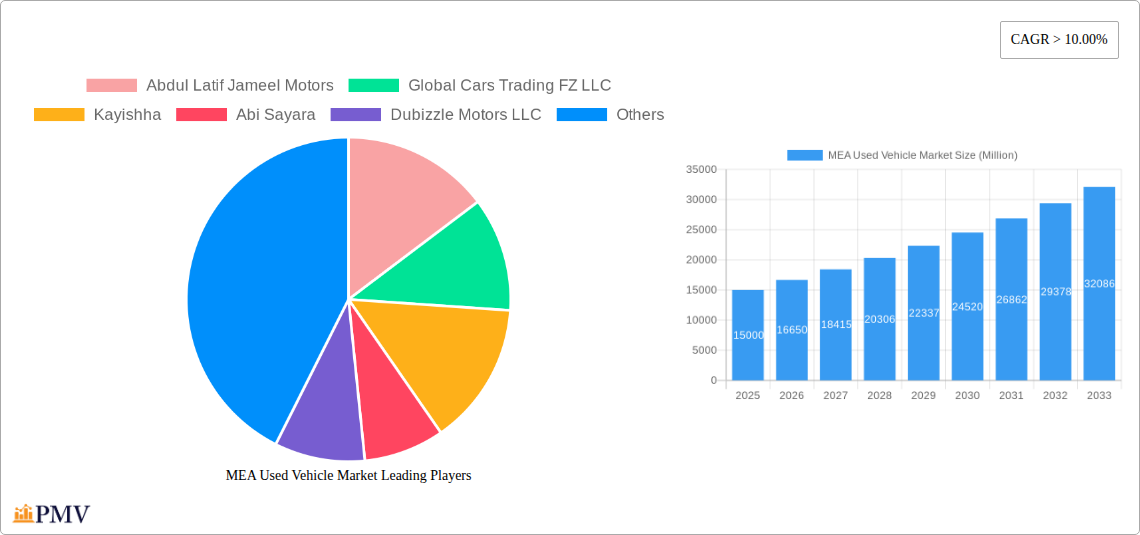
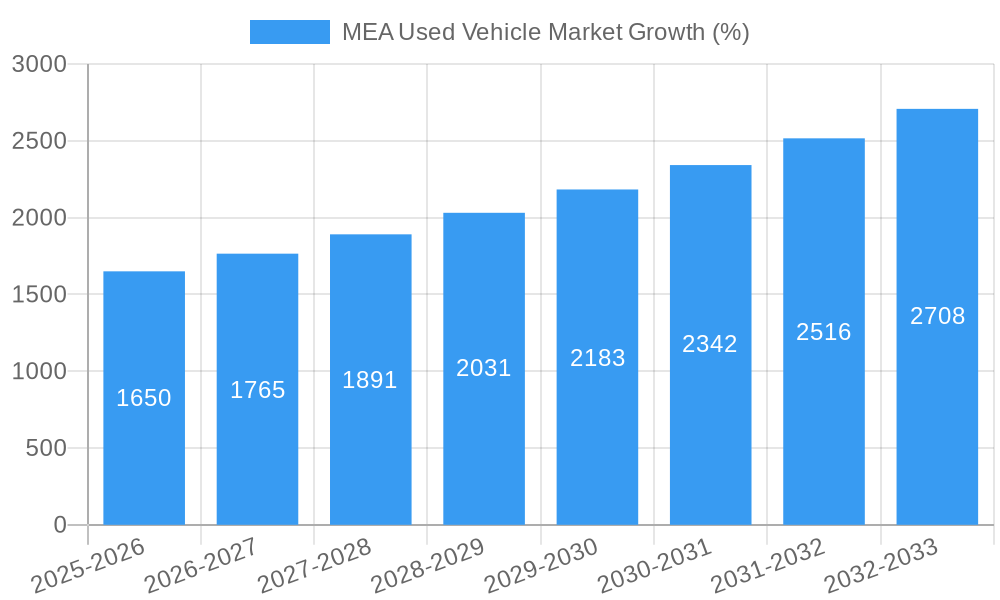
The Middle East and Africa (MEA) used vehicle market is experiencing robust growth, projected to maintain a Compound Annual Growth Rate (CAGR) exceeding 10% from 2025 to 2033. This expansion is fueled by several key factors. Firstly, the increasing affordability of used vehicles compared to new cars makes them an attractive option for a wider consumer base, particularly in developing economies within the region. Secondly, a burgeoning young population with rising disposable incomes is driving demand for personal transportation, further stimulating the used car market. The market is segmented by vehicle type (hatchbacks, sedans, SUVs), vendor type (organized and unorganized dealerships), and geography, with the UAE, Saudi Arabia, and Egypt representing significant markets. The presence of established players like Abdul Latif Jameel Motors and Al-Futtaim Group, alongside numerous smaller, independent vendors, creates a competitive landscape. However, challenges remain, including fluctuating fuel prices, economic uncertainties in certain regions, and the availability of financing options. Government regulations impacting vehicle imports and emissions standards also influence market dynamics. The organized sector is expected to see faster growth due to increased consumer trust and transparency offered by established dealerships. The growing popularity of online platforms like Dubizzle Motors further contributes to market transparency and accessibility.
Looking ahead, the MEA used vehicle market's growth trajectory is influenced by several trends. The rise of online marketplaces and digitalization in the automotive sector enhances transparency and facilitates streamlined transactions. Growing consumer preference for SUVs, driven by their versatility and family-oriented appeal, is shifting market share within vehicle types. Furthermore, increasing awareness of vehicle maintenance and quality checks drives demand for certified pre-owned vehicles, boosting the organized segment's performance. Despite potential economic headwinds, the long-term outlook remains positive, driven by consistent population growth, rising urbanization, and the enduring demand for affordable and reliable transportation throughout the MEA region. The market will likely witness further consolidation amongst larger players, alongside the emergence of innovative business models catering to specific consumer segments.
MEA Used Vehicle Market: A Comprehensive Report (2019-2033)
This comprehensive report provides an in-depth analysis of the Middle East and Africa (MEA) used vehicle market, offering valuable insights for industry stakeholders, investors, and policymakers. The study covers the period from 2019 to 2033, with a focus on the forecast period of 2025-2033, using 2025 as the base year. The report segments the market by vehicle type (Hatchbacks, Sedans, SUVs), vendor type (Organized, Unorganized), and country (United Arab Emirates, Saudi Arabia, Egypt, Kenya, Rest of MEA). Key players analyzed include Abdul Latif Jameel Motors, Global Cars Trading FZ LLC, Kayishha, Abi Sayara, Dubizzle Motors LLC, Al-Futtaim Group, Yallamotor, and Bavaria Motors (list not exhaustive). The market size is projected to reach xx Million by 2033.
MEA Used Vehicle Market Market Structure & Competitive Dynamics
The MEA used vehicle market exhibits a moderately concentrated structure, with a few large players dominating the organized sector alongside a large number of smaller, unorganized players. Market share is heavily influenced by established automotive groups like Al-Futtaim Group and Abdul Latif Jameel Motors, which leverage their extensive dealer networks and brand recognition. The unorganized sector, characterized by individual sellers and smaller dealerships, accounts for a significant portion of transactions, particularly in less developed markets within the region.
Innovation within the MEA used vehicle market is driven by the increasing adoption of online platforms and digital technologies. Regulatory frameworks vary across countries, impacting market access and operational costs. Substitute products include public transport and ride-hailing services, posing competitive pressure, especially in urban areas. End-user trends indicate a growing preference for SUVs and hatchbacks due to affordability and fuel efficiency concerns.
M&A activity has been moderate, with larger players strategically acquiring smaller dealerships to expand their reach and market share. The value of recent M&A deals within the sector remains undisclosed/estimated at xx Million.
- Market Concentration: Moderate, dominated by a few large players in the organized sector.
- Innovation Ecosystems: Increasing adoption of digital platforms and online marketplaces.
- Regulatory Frameworks: Vary significantly across countries in the MEA region.
- Product Substitutes: Public transport and ride-hailing services.
- End-User Trends: Growing demand for fuel-efficient vehicles like SUVs and hatchbacks.
- M&A Activity: Moderate activity with deal values estimated at xx Million.
MEA Used Vehicle Market Industry Trends & Insights
The MEA used vehicle market is experiencing robust growth, driven by factors such as rising disposable incomes, increasing urbanization, and a preference for used vehicles over new ones due to affordability. The compound annual growth rate (CAGR) is estimated at xx% during the forecast period (2025-2033). Technological disruptions, particularly the emergence of online marketplaces and digital financing options, are significantly transforming the market landscape. Consumer preferences are shifting towards newer models, fuel-efficient vehicles, and vehicles with extended warranties.
The competitive landscape is intensifying with the entry of new players and the expansion of existing ones. Market penetration of organized players is gradually increasing as consumers gain trust in online platforms and organized dealerships. Challenges remain, however, including inconsistent vehicle quality, lack of transparency in pricing, and difficulties in verifying vehicle history.
Dominant Markets & Segments in MEA Used Vehicle Market
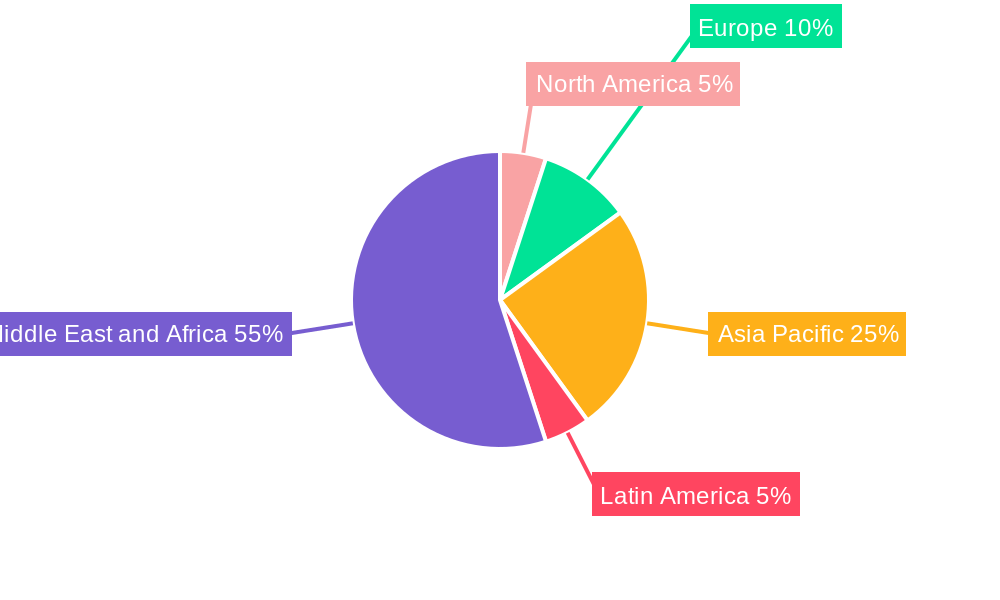
The United Arab Emirates (UAE) and Saudi Arabia represent the largest markets within the MEA region, driven by high vehicle ownership rates and strong economic growth. Egypt and Kenya are also exhibiting significant growth potential.
- Leading Region: Middle East (specifically UAE and Saudi Arabia).
- Leading Vehicle Type: SUVs are experiencing high growth, followed by hatchbacks and sedans.
- Leading Vendor Type: The organized sector is growing rapidly, but the unorganized sector remains significant.
Key Drivers for Dominant Markets:
- UAE & Saudi Arabia: Strong economic growth, high disposable incomes, established automotive infrastructure, and favorable government policies.
- Egypt & Kenya: Rapid urbanization, growing middle class, and increasing demand for affordable transportation options.
The dominance analysis shows a correlation between economic strength, infrastructure development, and the penetration of organized players in the used vehicle market. Regions with robust economies and advanced infrastructure tend to have a higher proportion of organized dealers and online marketplaces, leading to greater market transparency and consumer protection.
MEA Used Vehicle Market Product Innovations
Recent product innovations focus on improving the customer experience and enhancing the transparency of transactions. Online platforms offer advanced search filters, detailed vehicle history reports, and secure payment gateways. Technological innovations such as AI-powered valuation tools and virtual inspections are also gaining traction. The market is moving towards greater standardization of vehicle quality checks and certifications to improve consumer trust and reduce information asymmetry.
Report Segmentation & Scope
The report segments the MEA used vehicle market based on vehicle type (Hatchbacks, Sedans, SUVs), vendor type (Organized, Unorganized), and country (United Arab Emirates, Saudi Arabia, Egypt, Kenya, Rest of MEA). Each segment provides detailed market size estimates, growth projections, and competitive dynamics. The growth projections are influenced by economic factors, consumer preferences, and government policies in each specific market segment. For example, the SUV segment shows a higher growth projection compared to sedans in several markets due to consumer preferences for larger vehicles. The organized vendor type segment is projected to have a faster growth rate than the unorganized sector due to increased trust and efficiency.
Key Drivers of MEA Used Vehicle Market Growth
Several factors contribute to the growth of the MEA used vehicle market. Rising disposable incomes, especially in the Middle East, enable more people to afford vehicles. Urbanization and improved road infrastructure further boost demand. Government policies, while varying across countries, often impact used vehicle imports and sales, and the rising popularity of online marketplaces facilitates transactions and enhances market efficiency. The increasing preference for used vehicles due to affordability also contributes to market growth.
Challenges in the MEA Used Vehicle Market Sector
Challenges include the inconsistent quality of used vehicles, the lack of transparency in pricing and vehicle history, difficulties verifying authenticity, regulatory complexities across different countries, and the competition from public transport and ride-hailing services. Supply chain disruptions and fluctuations in currency exchange rates also pose significant challenges. The dominance of informal players may lead to uneven quality standards and potential consumer exploitation.
Leading Players in the MEA Used Vehicle Market Market
- Abdul Latif Jameel Motors
- Global Cars Trading FZ LLC
- Kayishha
- Abi Sayara
- Dubizzle Motors LLC
- Al-Futtaim Group
- Yallamotor
- Bavaria Motors
Key Developments in MEA Used Vehicle Market Sector
- March 2022: ADIB (Abu Dhabi Islamic Bank) launched the UAE's largest digital car marketplace, providing a single platform for car searching, test drives, insurance quotes, and financing. This significantly improved the customer experience and promoted transparency in the market.
Strategic MEA Used Vehicle Market Market Outlook
The MEA used vehicle market is poised for continued growth, driven by favorable demographic trends, economic expansion in key markets, and increasing technological adoption. Strategic opportunities exist for businesses focusing on online marketplaces, digital financing solutions, and enhanced vehicle inspection and certification services. Companies that can effectively address the challenges of market fragmentation, inconsistent vehicle quality, and regulatory complexities will be best positioned to capture market share.
MEA Used Vehicle Market Segmentation
-
1. Vehicle Type
- 1.1. Hachbacks
- 1.2. Sedan
- 1.3. Sports Utility vehicles (SUV)
-
2. Vendor Type
- 2.1. Organized
- 2.2. Unorganized
MEA Used Vehicle Market Segmentation By Geography
-
1. North America
- 1.1. United States
- 1.2. Canada
- 1.3. Mexico
-
2. South America
- 2.1. Brazil
- 2.2. Argentina
- 2.3. Rest of South America
-
3. Europe
- 3.1. United Kingdom
- 3.2. Germany
- 3.3. France
- 3.4. Italy
- 3.5. Spain
- 3.6. Russia
- 3.7. Benelux
- 3.8. Nordics
- 3.9. Rest of Europe
-
4. Middle East & Africa
- 4.1. Turkey
- 4.2. Israel
- 4.3. GCC
- 4.4. North Africa
- 4.5. South Africa
- 4.6. Rest of Middle East & Africa
-
5. Asia Pacific
- 5.1. China
- 5.2. India
- 5.3. Japan
- 5.4. South Korea
- 5.5. ASEAN
- 5.6. Oceania
- 5.7. Rest of Asia Pacific
MEA Used Vehicle Market REPORT HIGHLIGHTS
| Aspects | Details |
|---|---|
| Study Period | 2019-2033 |
| Base Year | 2024 |
| Estimated Year | 2025 |
| Forecast Period | 2025-2033 |
| Historical Period | 2019-2024 |
| Growth Rate | CAGR of > 10.00% from 2019-2033 |
| Segmentation |
|
Table of Contents
- 1. Introduction
- 1.1. Research Scope
- 1.2. Market Segmentation
- 1.3. Research Methodology
- 1.4. Definitions and Assumptions
- 2. Executive Summary
- 2.1. Introduction
- 3. Market Dynamics
- 3.1. Introduction
- 3.2. Market Drivers
- 3.2.1. The Increasing Demand for Luxury Cars is Anticipated to Boost the Market
- 3.3. Market Restrains
- 3.3.1. Comparatively Limited Market Transparency May Hinder the Market
- 3.4. Market Trends
- 3.4.1. Shift towards Unorganized Vendor to Elevate Used Cars Sales In Middle-East and Africa
- 4. Market Factor Analysis
- 4.1. Porters Five Forces
- 4.2. Supply/Value Chain
- 4.3. PESTEL analysis
- 4.4. Market Entropy
- 4.5. Patent/Trademark Analysis
- 5. Global MEA Used Vehicle Market Analysis, Insights and Forecast, 2019-2031
- 5.1. Market Analysis, Insights and Forecast - by Vehicle Type
- 5.1.1. Hachbacks
- 5.1.2. Sedan
- 5.1.3. Sports Utility vehicles (SUV)
- 5.2. Market Analysis, Insights and Forecast - by Vendor Type
- 5.2.1. Organized
- 5.2.2. Unorganized
- 5.3. Market Analysis, Insights and Forecast - by Region
- 5.3.1. North America
- 5.3.2. South America
- 5.3.3. Europe
- 5.3.4. Middle East & Africa
- 5.3.5. Asia Pacific
- 5.1. Market Analysis, Insights and Forecast - by Vehicle Type
- 6. North America MEA Used Vehicle Market Analysis, Insights and Forecast, 2019-2031
- 6.1. Market Analysis, Insights and Forecast - by Vehicle Type
- 6.1.1. Hachbacks
- 6.1.2. Sedan
- 6.1.3. Sports Utility vehicles (SUV)
- 6.2. Market Analysis, Insights and Forecast - by Vendor Type
- 6.2.1. Organized
- 6.2.2. Unorganized
- 6.1. Market Analysis, Insights and Forecast - by Vehicle Type
- 7. South America MEA Used Vehicle Market Analysis, Insights and Forecast, 2019-2031
- 7.1. Market Analysis, Insights and Forecast - by Vehicle Type
- 7.1.1. Hachbacks
- 7.1.2. Sedan
- 7.1.3. Sports Utility vehicles (SUV)
- 7.2. Market Analysis, Insights and Forecast - by Vendor Type
- 7.2.1. Organized
- 7.2.2. Unorganized
- 7.1. Market Analysis, Insights and Forecast - by Vehicle Type
- 8. Europe MEA Used Vehicle Market Analysis, Insights and Forecast, 2019-2031
- 8.1. Market Analysis, Insights and Forecast - by Vehicle Type
- 8.1.1. Hachbacks
- 8.1.2. Sedan
- 8.1.3. Sports Utility vehicles (SUV)
- 8.2. Market Analysis, Insights and Forecast - by Vendor Type
- 8.2.1. Organized
- 8.2.2. Unorganized
- 8.1. Market Analysis, Insights and Forecast - by Vehicle Type
- 9. Middle East & Africa MEA Used Vehicle Market Analysis, Insights and Forecast, 2019-2031
- 9.1. Market Analysis, Insights and Forecast - by Vehicle Type
- 9.1.1. Hachbacks
- 9.1.2. Sedan
- 9.1.3. Sports Utility vehicles (SUV)
- 9.2. Market Analysis, Insights and Forecast - by Vendor Type
- 9.2.1. Organized
- 9.2.2. Unorganized
- 9.1. Market Analysis, Insights and Forecast - by Vehicle Type
- 10. Asia Pacific MEA Used Vehicle Market Analysis, Insights and Forecast, 2019-2031
- 10.1. Market Analysis, Insights and Forecast - by Vehicle Type
- 10.1.1. Hachbacks
- 10.1.2. Sedan
- 10.1.3. Sports Utility vehicles (SUV)
- 10.2. Market Analysis, Insights and Forecast - by Vendor Type
- 10.2.1. Organized
- 10.2.2. Unorganized
- 10.1. Market Analysis, Insights and Forecast - by Vehicle Type
- 11. North America MEA Used Vehicle Market Analysis, Insights and Forecast, 2019-2031
- 11.1. Market Analysis, Insights and Forecast - By Country/Sub-region
- 11.1.1 United States
- 11.1.2 Canada
- 11.1.3 Rest of North America
- 12. Europe MEA Used Vehicle Market Analysis, Insights and Forecast, 2019-2031
- 12.1. Market Analysis, Insights and Forecast - By Country/Sub-region
- 12.1.1 Germany
- 12.1.2 United Kingdom
- 12.1.3 France
- 12.1.4 Spain
- 12.1.5 Rest of Europe
- 13. Asia Pacific MEA Used Vehicle Market Analysis, Insights and Forecast, 2019-2031
- 13.1. Market Analysis, Insights and Forecast - By Country/Sub-region
- 13.1.1 India
- 13.1.2 China
- 13.1.3 Japan
- 13.1.4 Rest of Asia Pacific
- 14. Latin America MEA Used Vehicle Market Analysis, Insights and Forecast, 2019-2031
- 14.1. Market Analysis, Insights and Forecast - By Country/Sub-region
- 14.1.1 Mexico
- 14.1.2 Brazil
- 14.1.3 Argentina
- 15. Middle East and Africa MEA Used Vehicle Market Analysis, Insights and Forecast, 2019-2031
- 15.1. Market Analysis, Insights and Forecast - By Country/Sub-region
- 15.1.1 United Arab Emirates
- 15.1.2 Saudi Arabia
- 15.1.3 Rest of Middle East and Africa
- 16. Competitive Analysis
- 16.1. Global Market Share Analysis 2024
- 16.2. Company Profiles
- 16.2.1 Abdul Latif Jameel Motors
- 16.2.1.1. Overview
- 16.2.1.2. Products
- 16.2.1.3. SWOT Analysis
- 16.2.1.4. Recent Developments
- 16.2.1.5. Financials (Based on Availability)
- 16.2.2 Global Cars Trading FZ LLC
- 16.2.2.1. Overview
- 16.2.2.2. Products
- 16.2.2.3. SWOT Analysis
- 16.2.2.4. Recent Developments
- 16.2.2.5. Financials (Based on Availability)
- 16.2.3 Kayishha
- 16.2.3.1. Overview
- 16.2.3.2. Products
- 16.2.3.3. SWOT Analysis
- 16.2.3.4. Recent Developments
- 16.2.3.5. Financials (Based on Availability)
- 16.2.4 Abi Sayara
- 16.2.4.1. Overview
- 16.2.4.2. Products
- 16.2.4.3. SWOT Analysis
- 16.2.4.4. Recent Developments
- 16.2.4.5. Financials (Based on Availability)
- 16.2.5 Dubizzle Motors LLC
- 16.2.5.1. Overview
- 16.2.5.2. Products
- 16.2.5.3. SWOT Analysis
- 16.2.5.4. Recent Developments
- 16.2.5.5. Financials (Based on Availability)
- 16.2.6 Al-Futtaim Group
- 16.2.6.1. Overview
- 16.2.6.2. Products
- 16.2.6.3. SWOT Analysis
- 16.2.6.4. Recent Developments
- 16.2.6.5. Financials (Based on Availability)
- 16.2.7 Yallamotor
- 16.2.7.1. Overview
- 16.2.7.2. Products
- 16.2.7.3. SWOT Analysis
- 16.2.7.4. Recent Developments
- 16.2.7.5. Financials (Based on Availability)
- 16.2.8 Bavaria Motors*List Not Exhaustive
- 16.2.8.1. Overview
- 16.2.8.2. Products
- 16.2.8.3. SWOT Analysis
- 16.2.8.4. Recent Developments
- 16.2.8.5. Financials (Based on Availability)
- 16.2.1 Abdul Latif Jameel Motors
List of Figures
- Figure 1: Global MEA Used Vehicle Market Revenue Breakdown (Million, %) by Region 2024 & 2032
- Figure 2: North America MEA Used Vehicle Market Revenue (Million), by Country 2024 & 2032
- Figure 3: North America MEA Used Vehicle Market Revenue Share (%), by Country 2024 & 2032
- Figure 4: Europe MEA Used Vehicle Market Revenue (Million), by Country 2024 & 2032
- Figure 5: Europe MEA Used Vehicle Market Revenue Share (%), by Country 2024 & 2032
- Figure 6: Asia Pacific MEA Used Vehicle Market Revenue (Million), by Country 2024 & 2032
- Figure 7: Asia Pacific MEA Used Vehicle Market Revenue Share (%), by Country 2024 & 2032
- Figure 8: Latin America MEA Used Vehicle Market Revenue (Million), by Country 2024 & 2032
- Figure 9: Latin America MEA Used Vehicle Market Revenue Share (%), by Country 2024 & 2032
- Figure 10: Middle East and Africa MEA Used Vehicle Market Revenue (Million), by Country 2024 & 2032
- Figure 11: Middle East and Africa MEA Used Vehicle Market Revenue Share (%), by Country 2024 & 2032
- Figure 12: North America MEA Used Vehicle Market Revenue (Million), by Vehicle Type 2024 & 2032
- Figure 13: North America MEA Used Vehicle Market Revenue Share (%), by Vehicle Type 2024 & 2032
- Figure 14: North America MEA Used Vehicle Market Revenue (Million), by Vendor Type 2024 & 2032
- Figure 15: North America MEA Used Vehicle Market Revenue Share (%), by Vendor Type 2024 & 2032
- Figure 16: North America MEA Used Vehicle Market Revenue (Million), by Country 2024 & 2032
- Figure 17: North America MEA Used Vehicle Market Revenue Share (%), by Country 2024 & 2032
- Figure 18: South America MEA Used Vehicle Market Revenue (Million), by Vehicle Type 2024 & 2032
- Figure 19: South America MEA Used Vehicle Market Revenue Share (%), by Vehicle Type 2024 & 2032
- Figure 20: South America MEA Used Vehicle Market Revenue (Million), by Vendor Type 2024 & 2032
- Figure 21: South America MEA Used Vehicle Market Revenue Share (%), by Vendor Type 2024 & 2032
- Figure 22: South America MEA Used Vehicle Market Revenue (Million), by Country 2024 & 2032
- Figure 23: South America MEA Used Vehicle Market Revenue Share (%), by Country 2024 & 2032
- Figure 24: Europe MEA Used Vehicle Market Revenue (Million), by Vehicle Type 2024 & 2032
- Figure 25: Europe MEA Used Vehicle Market Revenue Share (%), by Vehicle Type 2024 & 2032
- Figure 26: Europe MEA Used Vehicle Market Revenue (Million), by Vendor Type 2024 & 2032
- Figure 27: Europe MEA Used Vehicle Market Revenue Share (%), by Vendor Type 2024 & 2032
- Figure 28: Europe MEA Used Vehicle Market Revenue (Million), by Country 2024 & 2032
- Figure 29: Europe MEA Used Vehicle Market Revenue Share (%), by Country 2024 & 2032
- Figure 30: Middle East & Africa MEA Used Vehicle Market Revenue (Million), by Vehicle Type 2024 & 2032
- Figure 31: Middle East & Africa MEA Used Vehicle Market Revenue Share (%), by Vehicle Type 2024 & 2032
- Figure 32: Middle East & Africa MEA Used Vehicle Market Revenue (Million), by Vendor Type 2024 & 2032
- Figure 33: Middle East & Africa MEA Used Vehicle Market Revenue Share (%), by Vendor Type 2024 & 2032
- Figure 34: Middle East & Africa MEA Used Vehicle Market Revenue (Million), by Country 2024 & 2032
- Figure 35: Middle East & Africa MEA Used Vehicle Market Revenue Share (%), by Country 2024 & 2032
- Figure 36: Asia Pacific MEA Used Vehicle Market Revenue (Million), by Vehicle Type 2024 & 2032
- Figure 37: Asia Pacific MEA Used Vehicle Market Revenue Share (%), by Vehicle Type 2024 & 2032
- Figure 38: Asia Pacific MEA Used Vehicle Market Revenue (Million), by Vendor Type 2024 & 2032
- Figure 39: Asia Pacific MEA Used Vehicle Market Revenue Share (%), by Vendor Type 2024 & 2032
- Figure 40: Asia Pacific MEA Used Vehicle Market Revenue (Million), by Country 2024 & 2032
- Figure 41: Asia Pacific MEA Used Vehicle Market Revenue Share (%), by Country 2024 & 2032
List of Tables
- Table 1: Global MEA Used Vehicle Market Revenue Million Forecast, by Region 2019 & 2032
- Table 2: Global MEA Used Vehicle Market Revenue Million Forecast, by Vehicle Type 2019 & 2032
- Table 3: Global MEA Used Vehicle Market Revenue Million Forecast, by Vendor Type 2019 & 2032
- Table 4: Global MEA Used Vehicle Market Revenue Million Forecast, by Region 2019 & 2032
- Table 5: Global MEA Used Vehicle Market Revenue Million Forecast, by Country 2019 & 2032
- Table 6: United States MEA Used Vehicle Market Revenue (Million) Forecast, by Application 2019 & 2032
- Table 7: Canada MEA Used Vehicle Market Revenue (Million) Forecast, by Application 2019 & 2032
- Table 8: Rest of North America MEA Used Vehicle Market Revenue (Million) Forecast, by Application 2019 & 2032
- Table 9: Global MEA Used Vehicle Market Revenue Million Forecast, by Country 2019 & 2032
- Table 10: Germany MEA Used Vehicle Market Revenue (Million) Forecast, by Application 2019 & 2032
- Table 11: United Kingdom MEA Used Vehicle Market Revenue (Million) Forecast, by Application 2019 & 2032
- Table 12: France MEA Used Vehicle Market Revenue (Million) Forecast, by Application 2019 & 2032
- Table 13: Spain MEA Used Vehicle Market Revenue (Million) Forecast, by Application 2019 & 2032
- Table 14: Rest of Europe MEA Used Vehicle Market Revenue (Million) Forecast, by Application 2019 & 2032
- Table 15: Global MEA Used Vehicle Market Revenue Million Forecast, by Country 2019 & 2032
- Table 16: India MEA Used Vehicle Market Revenue (Million) Forecast, by Application 2019 & 2032
- Table 17: China MEA Used Vehicle Market Revenue (Million) Forecast, by Application 2019 & 2032
- Table 18: Japan MEA Used Vehicle Market Revenue (Million) Forecast, by Application 2019 & 2032
- Table 19: Rest of Asia Pacific MEA Used Vehicle Market Revenue (Million) Forecast, by Application 2019 & 2032
- Table 20: Global MEA Used Vehicle Market Revenue Million Forecast, by Country 2019 & 2032
- Table 21: Mexico MEA Used Vehicle Market Revenue (Million) Forecast, by Application 2019 & 2032
- Table 22: Brazil MEA Used Vehicle Market Revenue (Million) Forecast, by Application 2019 & 2032
- Table 23: Argentina MEA Used Vehicle Market Revenue (Million) Forecast, by Application 2019 & 2032
- Table 24: Global MEA Used Vehicle Market Revenue Million Forecast, by Country 2019 & 2032
- Table 25: United Arab Emirates MEA Used Vehicle Market Revenue (Million) Forecast, by Application 2019 & 2032
- Table 26: Saudi Arabia MEA Used Vehicle Market Revenue (Million) Forecast, by Application 2019 & 2032
- Table 27: Rest of Middle East and Africa MEA Used Vehicle Market Revenue (Million) Forecast, by Application 2019 & 2032
- Table 28: Global MEA Used Vehicle Market Revenue Million Forecast, by Vehicle Type 2019 & 2032
- Table 29: Global MEA Used Vehicle Market Revenue Million Forecast, by Vendor Type 2019 & 2032
- Table 30: Global MEA Used Vehicle Market Revenue Million Forecast, by Country 2019 & 2032
- Table 31: United States MEA Used Vehicle Market Revenue (Million) Forecast, by Application 2019 & 2032
- Table 32: Canada MEA Used Vehicle Market Revenue (Million) Forecast, by Application 2019 & 2032
- Table 33: Mexico MEA Used Vehicle Market Revenue (Million) Forecast, by Application 2019 & 2032
- Table 34: Global MEA Used Vehicle Market Revenue Million Forecast, by Vehicle Type 2019 & 2032
- Table 35: Global MEA Used Vehicle Market Revenue Million Forecast, by Vendor Type 2019 & 2032
- Table 36: Global MEA Used Vehicle Market Revenue Million Forecast, by Country 2019 & 2032
- Table 37: Brazil MEA Used Vehicle Market Revenue (Million) Forecast, by Application 2019 & 2032
- Table 38: Argentina MEA Used Vehicle Market Revenue (Million) Forecast, by Application 2019 & 2032
- Table 39: Rest of South America MEA Used Vehicle Market Revenue (Million) Forecast, by Application 2019 & 2032
- Table 40: Global MEA Used Vehicle Market Revenue Million Forecast, by Vehicle Type 2019 & 2032
- Table 41: Global MEA Used Vehicle Market Revenue Million Forecast, by Vendor Type 2019 & 2032
- Table 42: Global MEA Used Vehicle Market Revenue Million Forecast, by Country 2019 & 2032
- Table 43: United Kingdom MEA Used Vehicle Market Revenue (Million) Forecast, by Application 2019 & 2032
- Table 44: Germany MEA Used Vehicle Market Revenue (Million) Forecast, by Application 2019 & 2032
- Table 45: France MEA Used Vehicle Market Revenue (Million) Forecast, by Application 2019 & 2032
- Table 46: Italy MEA Used Vehicle Market Revenue (Million) Forecast, by Application 2019 & 2032
- Table 47: Spain MEA Used Vehicle Market Revenue (Million) Forecast, by Application 2019 & 2032
- Table 48: Russia MEA Used Vehicle Market Revenue (Million) Forecast, by Application 2019 & 2032
- Table 49: Benelux MEA Used Vehicle Market Revenue (Million) Forecast, by Application 2019 & 2032
- Table 50: Nordics MEA Used Vehicle Market Revenue (Million) Forecast, by Application 2019 & 2032
- Table 51: Rest of Europe MEA Used Vehicle Market Revenue (Million) Forecast, by Application 2019 & 2032
- Table 52: Global MEA Used Vehicle Market Revenue Million Forecast, by Vehicle Type 2019 & 2032
- Table 53: Global MEA Used Vehicle Market Revenue Million Forecast, by Vendor Type 2019 & 2032
- Table 54: Global MEA Used Vehicle Market Revenue Million Forecast, by Country 2019 & 2032
- Table 55: Turkey MEA Used Vehicle Market Revenue (Million) Forecast, by Application 2019 & 2032
- Table 56: Israel MEA Used Vehicle Market Revenue (Million) Forecast, by Application 2019 & 2032
- Table 57: GCC MEA Used Vehicle Market Revenue (Million) Forecast, by Application 2019 & 2032
- Table 58: North Africa MEA Used Vehicle Market Revenue (Million) Forecast, by Application 2019 & 2032
- Table 59: South Africa MEA Used Vehicle Market Revenue (Million) Forecast, by Application 2019 & 2032
- Table 60: Rest of Middle East & Africa MEA Used Vehicle Market Revenue (Million) Forecast, by Application 2019 & 2032
- Table 61: Global MEA Used Vehicle Market Revenue Million Forecast, by Vehicle Type 2019 & 2032
- Table 62: Global MEA Used Vehicle Market Revenue Million Forecast, by Vendor Type 2019 & 2032
- Table 63: Global MEA Used Vehicle Market Revenue Million Forecast, by Country 2019 & 2032
- Table 64: China MEA Used Vehicle Market Revenue (Million) Forecast, by Application 2019 & 2032
- Table 65: India MEA Used Vehicle Market Revenue (Million) Forecast, by Application 2019 & 2032
- Table 66: Japan MEA Used Vehicle Market Revenue (Million) Forecast, by Application 2019 & 2032
- Table 67: South Korea MEA Used Vehicle Market Revenue (Million) Forecast, by Application 2019 & 2032
- Table 68: ASEAN MEA Used Vehicle Market Revenue (Million) Forecast, by Application 2019 & 2032
- Table 69: Oceania MEA Used Vehicle Market Revenue (Million) Forecast, by Application 2019 & 2032
- Table 70: Rest of Asia Pacific MEA Used Vehicle Market Revenue (Million) Forecast, by Application 2019 & 2032
Frequently Asked Questions
1. What is the projected Compound Annual Growth Rate (CAGR) of the MEA Used Vehicle Market?
The projected CAGR is approximately > 10.00%.
2. Which companies are prominent players in the MEA Used Vehicle Market?
Key companies in the market include Abdul Latif Jameel Motors, Global Cars Trading FZ LLC, Kayishha, Abi Sayara, Dubizzle Motors LLC, Al-Futtaim Group, Yallamotor, Bavaria Motors*List Not Exhaustive.
3. What are the main segments of the MEA Used Vehicle Market?
The market segments include Vehicle Type, Vendor Type.
4. Can you provide details about the market size?
The market size is estimated to be USD XX Million as of 2022.
5. What are some drivers contributing to market growth?
The Increasing Demand for Luxury Cars is Anticipated to Boost the Market.
6. What are the notable trends driving market growth?
Shift towards Unorganized Vendor to Elevate Used Cars Sales In Middle-East and Africa.
7. Are there any restraints impacting market growth?
Comparatively Limited Market Transparency May Hinder the Market.
8. Can you provide examples of recent developments in the market?
In March 2022, ADIB (Abu Dhabi Islamic Bank) launched the emirates' largest digital car marketplace. Using this digital marketplace, on a single view, consumers can easily search for cars from a wide network of dealers and distributors, schedule a test drive, obtain an insurance quote for the car, and apply for financing for the same. The company discussed the issue with all 775 car dealers in UAE and finally made this digital portal for ease for buyers so that they can have their car from home itself.
9. What pricing options are available for accessing the report?
Pricing options include single-user, multi-user, and enterprise licenses priced at USD 4750, USD 4950, and USD 6800 respectively.
10. Is the market size provided in terms of value or volume?
The market size is provided in terms of value, measured in Million.
11. Are there any specific market keywords associated with the report?
Yes, the market keyword associated with the report is "MEA Used Vehicle Market," which aids in identifying and referencing the specific market segment covered.
12. How do I determine which pricing option suits my needs best?
The pricing options vary based on user requirements and access needs. Individual users may opt for single-user licenses, while businesses requiring broader access may choose multi-user or enterprise licenses for cost-effective access to the report.
13. Are there any additional resources or data provided in the MEA Used Vehicle Market report?
While the report offers comprehensive insights, it's advisable to review the specific contents or supplementary materials provided to ascertain if additional resources or data are available.
14. How can I stay updated on further developments or reports in the MEA Used Vehicle Market?
To stay informed about further developments, trends, and reports in the MEA Used Vehicle Market, consider subscribing to industry newsletters, following relevant companies and organizations, or regularly checking reputable industry news sources and publications.
Methodology
Step 1 - Identification of Relevant Samples Size from Population Database


Step 2 - Approaches for Defining Global Market Size (Value, Volume* & Price*)

Note*: In applicable scenarios
Step 3 - Data Sources
Primary Research
- Web Analytics
- Survey Reports
- Research Institute
- Latest Research Reports
- Opinion Leaders
Secondary Research
- Annual Reports
- White Paper
- Latest Press Release
- Industry Association
- Paid Database
- Investor Presentations

Step 4 - Data Triangulation
Involves using different sources of information in order to increase the validity of a study
These sources are likely to be stakeholders in a program - participants, other researchers, program staff, other community members, and so on.
Then we put all data in single framework & apply various statistical tools to find out the dynamic on the market.
During the analysis stage, feedback from the stakeholder groups would be compared to determine areas of agreement as well as areas of divergence


