
Key Insights
The MEA Functional Beverages market, while smaller than its North American or European counterparts, exhibits significant growth potential. Driven by increasing health consciousness, rising disposable incomes, and a young, active population, the region is witnessing a surge in demand for functional beverages like energy drinks, sports drinks, and fortified juices. This trend is particularly pronounced in urban centers and among the millennial and Gen Z demographics, who are more likely to adopt health-focused lifestyle choices and readily embrace new products. The market's growth is further fueled by expanding distribution channels, including the rise of online retail platforms, which are improving access to a wider range of functional beverages across the MEA region. However, challenges remain, such as fluctuating raw material prices, regulatory hurdles in certain countries, and the competition from established players with extensive distribution networks. The market's segmentation reflects this complexity, with supermarket/hypermarkets and pharmacies leading distribution, while energy drinks and sports drinks are currently the dominant product types, though the demand for dairy-based and other functional drinks is steadily increasing. Overall, the MEA functional beverage market represents a dynamic landscape with considerable untapped potential for growth in the coming years, especially as consumer preferences and purchasing power continue to evolve.
The competitive landscape is characterized by a mix of international giants like Coca-Cola, PepsiCo, and Red Bull, alongside regional players focusing on local tastes and preferences. This competition drives innovation and product diversification, leading to more specialized functional beverages tailored to the specific needs of different consumer segments within the MEA region. Successful companies are adapting to the market by investing in marketing campaigns that highlight the health benefits of their products, forming strategic partnerships to enhance distribution, and introducing products with innovative ingredients and formulations to cater to evolving consumer preferences. While challenges related to logistics, infrastructure, and consumer awareness remain, the market's overall trajectory points to continued expansion and diversification, creating opportunities for both established and emerging players.
MEA Functional Beverages Industry: Market Analysis & Forecast (2019-2033)
This comprehensive report provides a detailed analysis of the Middle East and Africa (MEA) functional beverages industry, encompassing market size, growth drivers, competitive landscape, and future outlook. The study period covers 2019-2033, with 2025 as the base and estimated year. The report offers actionable insights for businesses operating or planning to enter this dynamic market, valued at xx Million in 2025 and projected to reach xx Million by 2033.
MEA Functional Beverages Industry Market Structure & Competitive Dynamics
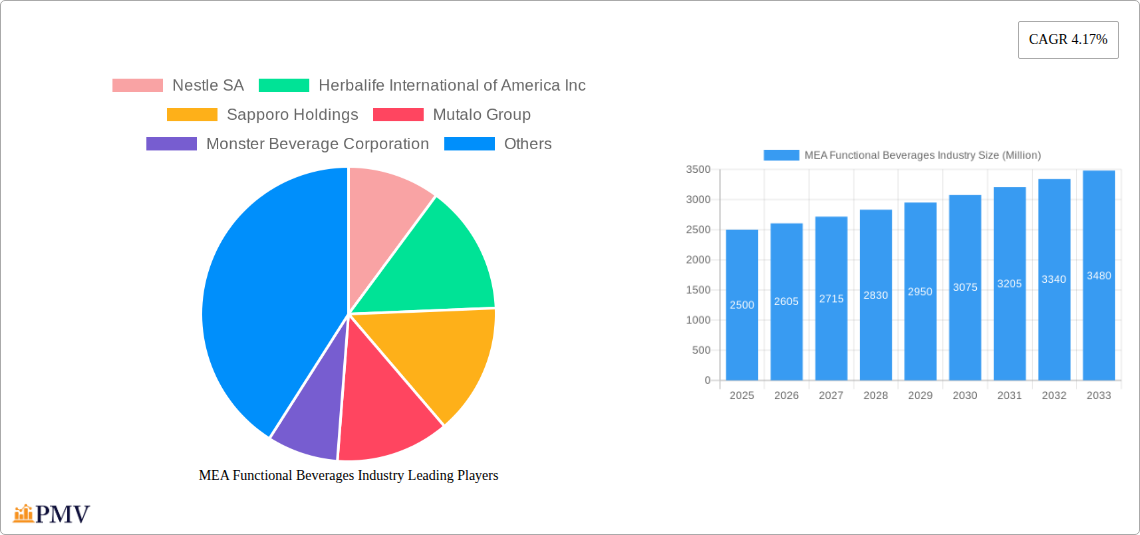
The MEA functional beverages market exhibits a moderately concentrated structure, with key players like Nestle SA, Herbalife International of America Inc, Sapporo Holdings, Red Bull GmbH, and The Coca-Cola Company holding significant market share. However, the presence of numerous regional and smaller players fosters competition. Innovation is driven by consumer demand for healthier and more functional options, leading to product diversification and the introduction of novel ingredients. Regulatory frameworks vary across the MEA region, influencing product labeling, ingredients, and marketing claims. Product substitutes, such as fresh juices and traditional beverages, exert competitive pressure. The increasing health consciousness among consumers is a key end-user trend, boosting demand for functional beverages. M&A activity in the sector is moderate, with deal values averaging xx Million in recent years, primarily focused on expanding product portfolios and market reach. Key market share metrics indicate that the top 5 players control approximately xx% of the overall market.
MEA Functional Beverages Industry Industry Trends & Insights
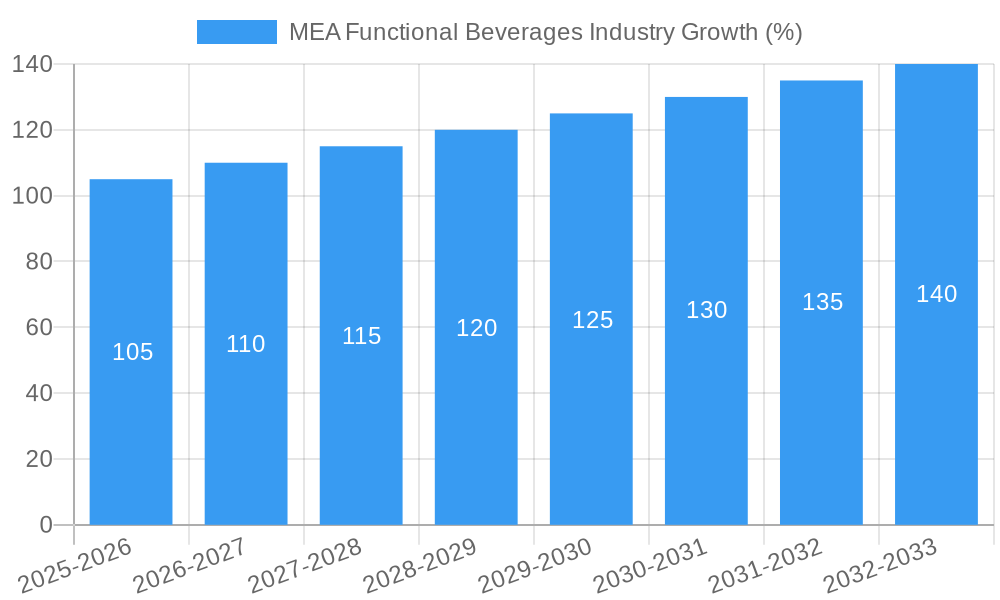
The MEA functional beverages market is experiencing robust growth, driven by factors such as rising disposable incomes, increasing health awareness, and a growing preference for convenient and healthier beverage options. The market exhibits a Compound Annual Growth Rate (CAGR) of xx% during the forecast period (2025-2033). Technological advancements in beverage processing and packaging are enhancing product quality and shelf life. Consumer preferences are shifting towards natural and organic ingredients, with reduced sugar content and functional benefits gaining traction. Market penetration of functional beverages remains relatively low compared to traditional beverages, presenting significant growth opportunities. Competitive dynamics are characterized by intense rivalry, particularly among multinational companies and regional players, driving innovation and product differentiation.
Dominant Markets & Segments in MEA Functional Beverages Industry
Leading Region: The GCC (Gulf Cooperation Council) countries currently dominate the MEA functional beverages market, driven by higher per capita incomes and a strong preference for premium beverages.
Leading Country: The UAE stands out as the leading country, fueled by a large expatriate population, high consumer spending, and a well-developed retail infrastructure.
Dominant Distribution Channels: Supermarket/hypermarkets and convenience stores are the dominant distribution channels, offering extensive reach and consumer access. Online retail is growing rapidly.
Dominant Product Types: Energy drinks and sports drinks currently hold the largest market share, due to their association with an active lifestyle and growing popularity among young consumers. However, fortified juices and dairy-based drinks are also witnessing increasing demand.
Key Drivers: Strong economic growth, increasing urbanization, rising health consciousness among consumers, and supportive government policies promoting healthy lifestyles all contribute to the sector's dominance. The development of advanced retail infrastructure, particularly in urban areas, has made functional beverages more accessible to consumers.
Detailed Dominance Analysis: The UAE’s robust economy and large consumer base significantly contribute to its leading market position. The GCC's focus on health and wellness also boosts the sector. The widespread availability of supermarket chains and convenience stores facilitates wide distribution.
MEA Functional Beverages Industry Product Innovations
Recent product innovations in the MEA functional beverages market showcase a clear trend toward healthier and more functional options. The inclusion of natural ingredients, such as botanical extracts and superfoods, is gaining prominence. Companies are focusing on developing low-sugar or no-sugar alternatives, catering to growing health concerns. Technological advancements in packaging are improving product shelf life and sustainability. These innovations enhance the competitive landscape by differentiating products and attracting health-conscious consumers.
Report Segmentation & Scope
This report segments the MEA functional beverages market based on distribution channels (Supermarket/Hypermarket, Pharmacies and Health Stores, Convenience Stores, Online Retail Stores, Other Distribution Channels) and product types (Energy Drinks, Fortified Juice, Sports Drinks, Dairy-based Drinks, Other Product Types). Each segment is analyzed in detail, including market size, growth projections, and competitive dynamics. For example, the online retail segment is expected to exhibit the highest CAGR during the forecast period due to expanding e-commerce penetration. Energy drinks are the largest segment by product type, with growth driven by rising urbanization and changing lifestyles.
Key Drivers of MEA Functional Beverages Industry Growth
Several key factors are fueling the growth of the MEA functional beverages industry. Rising disposable incomes and a growing middle class are increasing consumer spending on premium and functional beverages. Health consciousness is escalating, leading to a greater preference for healthier and more nutritious options. Government initiatives promoting healthy lifestyles are also creating a positive environment for market growth. The introduction of innovative products with enhanced functionality further stimulates market expansion.
Challenges in the MEA Functional Beverages Industry Sector
Challenges to growth include stringent regulatory frameworks concerning food safety and labeling, which add to compliance costs. Supply chain disruptions and fluctuating raw material prices pose a challenge to maintaining consistent product availability and affordability. Intense competition from established players and emerging brands necessitates continuous innovation and differentiation. These factors, especially volatile supply chain issues, are estimated to have impacted market growth by approximately xx% in 2024.
Leading Players in the MEA Functional Beverages Industry Market
- Nestle SA
- Herbalife International of America Inc
- Sapporo Holdings
- Mutalo Group
- Monster Beverage Corporation
- PepsiCo Inc
- Dr Pepper Snapple
- Viju Industries Nigeria Ltd
- iPRO Sport Distribution Limited
- Red Bull GmbH
- The Coca-Cola Company
Key Developments in MEA Functional Beverages Industry Sector
October 2022: iPRO launched a range of sports drinks in Carrefour stores across the UAE, emphasizing high Vitamin C content. This launch demonstrates a focus on health-conscious consumers and strategic retail partnerships.
February 2022: PepsiCo introduced its "Rockstar Energy" hemp-based energy drink line in the Middle East, featuring lower caffeine content than existing products. This signifies an adaptation to evolving consumer preferences and a willingness to experiment with new ingredients.
March 2021: Perrier launched Perrier Energize, its first carbonated energy beverage, in Saudi Arabia. The use of natural ingredients and organic certification highlights a trend towards healthier energy options.
Strategic MEA Functional Beverages Industry Market Outlook
The MEA functional beverages market presents significant future potential, driven by continuous product innovation, expanding distribution channels, and a rising health-conscious population. Strategic opportunities lie in developing niche products targeting specific health needs, leveraging e-commerce platforms for wider reach, and establishing strong brand identities. Companies with a focus on sustainability and ethical sourcing will enjoy enhanced consumer appeal. The market's future growth hinges on adapting to evolving consumer preferences and embracing technological advancements in production and distribution.
MEA Functional Beverages Industry Segmentation
-
1. Product Type
- 1.1. Energy Drinks
- 1.2. Fortified Juice
- 1.3. Sports Drinks
- 1.4. Dairy-based Drinks
- 1.5. Other Product Types
-
2. Distribution Channel
- 2.1. Supermarket/Hypermarket
- 2.2. Pharmacies and Health Stores
- 2.3. Convenience Stores
- 2.4. Online Retail Stores
- 2.5. Other Distribution Channels
-
3. Geography
- 3.1. South Africa
- 3.2. Saudi Arabia
- 3.3. Rest of Middle-East and Africa
MEA Functional Beverages Industry Segmentation By Geography
- 1. South Africa
- 2. Saudi Arabia
- 3. Rest of Middle East and Africa
MEA Functional Beverages Industry REPORT HIGHLIGHTS
| Aspects | Details |
|---|---|
| Study Period | 2019-2033 |
| Base Year | 2024 |
| Estimated Year | 2025 |
| Forecast Period | 2025-2033 |
| Historical Period | 2019-2024 |
| Growth Rate | CAGR of 4.17% from 2019-2033 |
| Segmentation |
|
Table of Contents
- 1. Introduction
- 1.1. Research Scope
- 1.2. Market Segmentation
- 1.3. Research Methodology
- 1.4. Definitions and Assumptions
- 2. Executive Summary
- 2.1. Introduction
- 3. Market Dynamics
- 3.1. Introduction
- 3.2. Market Drivers
- 3.2.1. Preference for Plant-based and Clean-label RTD Products; Consumer Inclination Toward Sugar-Free Drinks
- 3.3. Market Restrains
- 3.3.1. Concerns Over Health Issues Associated With Beverages
- 3.4. Market Trends
- 3.4.1. Growing Demand for Plant-based and Lactose-free Products
- 4. Market Factor Analysis
- 4.1. Porters Five Forces
- 4.2. Supply/Value Chain
- 4.3. PESTEL analysis
- 4.4. Market Entropy
- 4.5. Patent/Trademark Analysis
- 5. Global MEA Functional Beverages Industry Analysis, Insights and Forecast, 2019-2031
- 5.1. Market Analysis, Insights and Forecast - by Product Type
- 5.1.1. Energy Drinks
- 5.1.2. Fortified Juice
- 5.1.3. Sports Drinks
- 5.1.4. Dairy-based Drinks
- 5.1.5. Other Product Types
- 5.2. Market Analysis, Insights and Forecast - by Distribution Channel
- 5.2.1. Supermarket/Hypermarket
- 5.2.2. Pharmacies and Health Stores
- 5.2.3. Convenience Stores
- 5.2.4. Online Retail Stores
- 5.2.5. Other Distribution Channels
- 5.3. Market Analysis, Insights and Forecast - by Geography
- 5.3.1. South Africa
- 5.3.2. Saudi Arabia
- 5.3.3. Rest of Middle-East and Africa
- 5.4. Market Analysis, Insights and Forecast - by Region
- 5.4.1. South Africa
- 5.4.2. Saudi Arabia
- 5.4.3. Rest of Middle East and Africa
- 5.1. Market Analysis, Insights and Forecast - by Product Type
- 6. South Africa MEA Functional Beverages Industry Analysis, Insights and Forecast, 2019-2031
- 6.1. Market Analysis, Insights and Forecast - by Product Type
- 6.1.1. Energy Drinks
- 6.1.2. Fortified Juice
- 6.1.3. Sports Drinks
- 6.1.4. Dairy-based Drinks
- 6.1.5. Other Product Types
- 6.2. Market Analysis, Insights and Forecast - by Distribution Channel
- 6.2.1. Supermarket/Hypermarket
- 6.2.2. Pharmacies and Health Stores
- 6.2.3. Convenience Stores
- 6.2.4. Online Retail Stores
- 6.2.5. Other Distribution Channels
- 6.3. Market Analysis, Insights and Forecast - by Geography
- 6.3.1. South Africa
- 6.3.2. Saudi Arabia
- 6.3.3. Rest of Middle-East and Africa
- 6.1. Market Analysis, Insights and Forecast - by Product Type
- 7. Saudi Arabia MEA Functional Beverages Industry Analysis, Insights and Forecast, 2019-2031
- 7.1. Market Analysis, Insights and Forecast - by Product Type
- 7.1.1. Energy Drinks
- 7.1.2. Fortified Juice
- 7.1.3. Sports Drinks
- 7.1.4. Dairy-based Drinks
- 7.1.5. Other Product Types
- 7.2. Market Analysis, Insights and Forecast - by Distribution Channel
- 7.2.1. Supermarket/Hypermarket
- 7.2.2. Pharmacies and Health Stores
- 7.2.3. Convenience Stores
- 7.2.4. Online Retail Stores
- 7.2.5. Other Distribution Channels
- 7.3. Market Analysis, Insights and Forecast - by Geography
- 7.3.1. South Africa
- 7.3.2. Saudi Arabia
- 7.3.3. Rest of Middle-East and Africa
- 7.1. Market Analysis, Insights and Forecast - by Product Type
- 8. Rest of Middle East and Africa MEA Functional Beverages Industry Analysis, Insights and Forecast, 2019-2031
- 8.1. Market Analysis, Insights and Forecast - by Product Type
- 8.1.1. Energy Drinks
- 8.1.2. Fortified Juice
- 8.1.3. Sports Drinks
- 8.1.4. Dairy-based Drinks
- 8.1.5. Other Product Types
- 8.2. Market Analysis, Insights and Forecast - by Distribution Channel
- 8.2.1. Supermarket/Hypermarket
- 8.2.2. Pharmacies and Health Stores
- 8.2.3. Convenience Stores
- 8.2.4. Online Retail Stores
- 8.2.5. Other Distribution Channels
- 8.3. Market Analysis, Insights and Forecast - by Geography
- 8.3.1. South Africa
- 8.3.2. Saudi Arabia
- 8.3.3. Rest of Middle-East and Africa
- 8.1. Market Analysis, Insights and Forecast - by Product Type
- 9. North America MEA Functional Beverages Industry Analysis, Insights and Forecast, 2019-2031
- 9.1. Market Analysis, Insights and Forecast - By Country/Sub-region
- 9.1.1 United States
- 9.1.2 Canada
- 9.1.3 Mexico
- 10. Europe MEA Functional Beverages Industry Analysis, Insights and Forecast, 2019-2031
- 10.1. Market Analysis, Insights and Forecast - By Country/Sub-region
- 10.1.1 Germany
- 10.1.2 United Kingdom
- 10.1.3 France
- 10.1.4 Spain
- 10.1.5 Italy
- 10.1.6 Spain
- 10.1.7 Belgium
- 10.1.8 Netherland
- 10.1.9 Nordics
- 10.1.10 Rest of Europe
- 11. Asia Pacific MEA Functional Beverages Industry Analysis, Insights and Forecast, 2019-2031
- 11.1. Market Analysis, Insights and Forecast - By Country/Sub-region
- 11.1.1 China
- 11.1.2 Japan
- 11.1.3 India
- 11.1.4 South Korea
- 11.1.5 Southeast Asia
- 11.1.6 Australia
- 11.1.7 Indonesia
- 11.1.8 Phillipes
- 11.1.9 Singapore
- 11.1.10 Thailandc
- 11.1.11 Rest of Asia Pacific
- 12. South America MEA Functional Beverages Industry Analysis, Insights and Forecast, 2019-2031
- 12.1. Market Analysis, Insights and Forecast - By Country/Sub-region
- 12.1.1 Brazil
- 12.1.2 Argentina
- 12.1.3 Peru
- 12.1.4 Chile
- 12.1.5 Colombia
- 12.1.6 Ecuador
- 12.1.7 Venezuela
- 12.1.8 Rest of South America
- 13. North America MEA Functional Beverages Industry Analysis, Insights and Forecast, 2019-2031
- 13.1. Market Analysis, Insights and Forecast - By Country/Sub-region
- 13.1.1 United States
- 13.1.2 Canada
- 13.1.3 Mexico
- 14. MEA MEA Functional Beverages Industry Analysis, Insights and Forecast, 2019-2031
- 14.1. Market Analysis, Insights and Forecast - By Country/Sub-region
- 14.1.1 United Arab Emirates
- 14.1.2 Saudi Arabia
- 14.1.3 South Africa
- 14.1.4 Rest of Middle East and Africa
- 15. Competitive Analysis
- 15.1. Global Market Share Analysis 2024
- 15.2. Company Profiles
- 15.2.1 Nestle SA
- 15.2.1.1. Overview
- 15.2.1.2. Products
- 15.2.1.3. SWOT Analysis
- 15.2.1.4. Recent Developments
- 15.2.1.5. Financials (Based on Availability)
- 15.2.2 Herbalife International of America Inc
- 15.2.2.1. Overview
- 15.2.2.2. Products
- 15.2.2.3. SWOT Analysis
- 15.2.2.4. Recent Developments
- 15.2.2.5. Financials (Based on Availability)
- 15.2.3 Sapporo Holdings
- 15.2.3.1. Overview
- 15.2.3.2. Products
- 15.2.3.3. SWOT Analysis
- 15.2.3.4. Recent Developments
- 15.2.3.5. Financials (Based on Availability)
- 15.2.4 Mutalo Group
- 15.2.4.1. Overview
- 15.2.4.2. Products
- 15.2.4.3. SWOT Analysis
- 15.2.4.4. Recent Developments
- 15.2.4.5. Financials (Based on Availability)
- 15.2.5 Monster Beverage Corporation
- 15.2.5.1. Overview
- 15.2.5.2. Products
- 15.2.5.3. SWOT Analysis
- 15.2.5.4. Recent Developments
- 15.2.5.5. Financials (Based on Availability)
- 15.2.6 PepsiCo Inc
- 15.2.6.1. Overview
- 15.2.6.2. Products
- 15.2.6.3. SWOT Analysis
- 15.2.6.4. Recent Developments
- 15.2.6.5. Financials (Based on Availability)
- 15.2.7 Dr Pepper Snapple
- 15.2.7.1. Overview
- 15.2.7.2. Products
- 15.2.7.3. SWOT Analysis
- 15.2.7.4. Recent Developments
- 15.2.7.5. Financials (Based on Availability)
- 15.2.8 Viju Industries Nigeria Ltd
- 15.2.8.1. Overview
- 15.2.8.2. Products
- 15.2.8.3. SWOT Analysis
- 15.2.8.4. Recent Developments
- 15.2.8.5. Financials (Based on Availability)
- 15.2.9 iPRO Sport Distribution Limited*List Not Exhaustive
- 15.2.9.1. Overview
- 15.2.9.2. Products
- 15.2.9.3. SWOT Analysis
- 15.2.9.4. Recent Developments
- 15.2.9.5. Financials (Based on Availability)
- 15.2.10 Red Bull GmbH
- 15.2.10.1. Overview
- 15.2.10.2. Products
- 15.2.10.3. SWOT Analysis
- 15.2.10.4. Recent Developments
- 15.2.10.5. Financials (Based on Availability)
- 15.2.11 The Coca-Cola Company
- 15.2.11.1. Overview
- 15.2.11.2. Products
- 15.2.11.3. SWOT Analysis
- 15.2.11.4. Recent Developments
- 15.2.11.5. Financials (Based on Availability)
- 15.2.1 Nestle SA
List of Figures
- Figure 1: Global MEA Functional Beverages Industry Revenue Breakdown (Million, %) by Region 2024 & 2032
- Figure 2: North America MEA Functional Beverages Industry Revenue (Million), by Country 2024 & 2032
- Figure 3: North America MEA Functional Beverages Industry Revenue Share (%), by Country 2024 & 2032
- Figure 4: Europe MEA Functional Beverages Industry Revenue (Million), by Country 2024 & 2032
- Figure 5: Europe MEA Functional Beverages Industry Revenue Share (%), by Country 2024 & 2032
- Figure 6: Asia Pacific MEA Functional Beverages Industry Revenue (Million), by Country 2024 & 2032
- Figure 7: Asia Pacific MEA Functional Beverages Industry Revenue Share (%), by Country 2024 & 2032
- Figure 8: South America MEA Functional Beverages Industry Revenue (Million), by Country 2024 & 2032
- Figure 9: South America MEA Functional Beverages Industry Revenue Share (%), by Country 2024 & 2032
- Figure 10: North America MEA Functional Beverages Industry Revenue (Million), by Country 2024 & 2032
- Figure 11: North America MEA Functional Beverages Industry Revenue Share (%), by Country 2024 & 2032
- Figure 12: MEA MEA Functional Beverages Industry Revenue (Million), by Country 2024 & 2032
- Figure 13: MEA MEA Functional Beverages Industry Revenue Share (%), by Country 2024 & 2032
- Figure 14: South Africa MEA Functional Beverages Industry Revenue (Million), by Product Type 2024 & 2032
- Figure 15: South Africa MEA Functional Beverages Industry Revenue Share (%), by Product Type 2024 & 2032
- Figure 16: South Africa MEA Functional Beverages Industry Revenue (Million), by Distribution Channel 2024 & 2032
- Figure 17: South Africa MEA Functional Beverages Industry Revenue Share (%), by Distribution Channel 2024 & 2032
- Figure 18: South Africa MEA Functional Beverages Industry Revenue (Million), by Geography 2024 & 2032
- Figure 19: South Africa MEA Functional Beverages Industry Revenue Share (%), by Geography 2024 & 2032
- Figure 20: South Africa MEA Functional Beverages Industry Revenue (Million), by Country 2024 & 2032
- Figure 21: South Africa MEA Functional Beverages Industry Revenue Share (%), by Country 2024 & 2032
- Figure 22: Saudi Arabia MEA Functional Beverages Industry Revenue (Million), by Product Type 2024 & 2032
- Figure 23: Saudi Arabia MEA Functional Beverages Industry Revenue Share (%), by Product Type 2024 & 2032
- Figure 24: Saudi Arabia MEA Functional Beverages Industry Revenue (Million), by Distribution Channel 2024 & 2032
- Figure 25: Saudi Arabia MEA Functional Beverages Industry Revenue Share (%), by Distribution Channel 2024 & 2032
- Figure 26: Saudi Arabia MEA Functional Beverages Industry Revenue (Million), by Geography 2024 & 2032
- Figure 27: Saudi Arabia MEA Functional Beverages Industry Revenue Share (%), by Geography 2024 & 2032
- Figure 28: Saudi Arabia MEA Functional Beverages Industry Revenue (Million), by Country 2024 & 2032
- Figure 29: Saudi Arabia MEA Functional Beverages Industry Revenue Share (%), by Country 2024 & 2032
- Figure 30: Rest of Middle East and Africa MEA Functional Beverages Industry Revenue (Million), by Product Type 2024 & 2032
- Figure 31: Rest of Middle East and Africa MEA Functional Beverages Industry Revenue Share (%), by Product Type 2024 & 2032
- Figure 32: Rest of Middle East and Africa MEA Functional Beverages Industry Revenue (Million), by Distribution Channel 2024 & 2032
- Figure 33: Rest of Middle East and Africa MEA Functional Beverages Industry Revenue Share (%), by Distribution Channel 2024 & 2032
- Figure 34: Rest of Middle East and Africa MEA Functional Beverages Industry Revenue (Million), by Geography 2024 & 2032
- Figure 35: Rest of Middle East and Africa MEA Functional Beverages Industry Revenue Share (%), by Geography 2024 & 2032
- Figure 36: Rest of Middle East and Africa MEA Functional Beverages Industry Revenue (Million), by Country 2024 & 2032
- Figure 37: Rest of Middle East and Africa MEA Functional Beverages Industry Revenue Share (%), by Country 2024 & 2032
List of Tables
- Table 1: Global MEA Functional Beverages Industry Revenue Million Forecast, by Region 2019 & 2032
- Table 2: Global MEA Functional Beverages Industry Revenue Million Forecast, by Product Type 2019 & 2032
- Table 3: Global MEA Functional Beverages Industry Revenue Million Forecast, by Distribution Channel 2019 & 2032
- Table 4: Global MEA Functional Beverages Industry Revenue Million Forecast, by Geography 2019 & 2032
- Table 5: Global MEA Functional Beverages Industry Revenue Million Forecast, by Region 2019 & 2032
- Table 6: Global MEA Functional Beverages Industry Revenue Million Forecast, by Country 2019 & 2032
- Table 7: United States MEA Functional Beverages Industry Revenue (Million) Forecast, by Application 2019 & 2032
- Table 8: Canada MEA Functional Beverages Industry Revenue (Million) Forecast, by Application 2019 & 2032
- Table 9: Mexico MEA Functional Beverages Industry Revenue (Million) Forecast, by Application 2019 & 2032
- Table 10: Global MEA Functional Beverages Industry Revenue Million Forecast, by Country 2019 & 2032
- Table 11: Germany MEA Functional Beverages Industry Revenue (Million) Forecast, by Application 2019 & 2032
- Table 12: United Kingdom MEA Functional Beverages Industry Revenue (Million) Forecast, by Application 2019 & 2032
- Table 13: France MEA Functional Beverages Industry Revenue (Million) Forecast, by Application 2019 & 2032
- Table 14: Spain MEA Functional Beverages Industry Revenue (Million) Forecast, by Application 2019 & 2032
- Table 15: Italy MEA Functional Beverages Industry Revenue (Million) Forecast, by Application 2019 & 2032
- Table 16: Spain MEA Functional Beverages Industry Revenue (Million) Forecast, by Application 2019 & 2032
- Table 17: Belgium MEA Functional Beverages Industry Revenue (Million) Forecast, by Application 2019 & 2032
- Table 18: Netherland MEA Functional Beverages Industry Revenue (Million) Forecast, by Application 2019 & 2032
- Table 19: Nordics MEA Functional Beverages Industry Revenue (Million) Forecast, by Application 2019 & 2032
- Table 20: Rest of Europe MEA Functional Beverages Industry Revenue (Million) Forecast, by Application 2019 & 2032
- Table 21: Global MEA Functional Beverages Industry Revenue Million Forecast, by Country 2019 & 2032
- Table 22: China MEA Functional Beverages Industry Revenue (Million) Forecast, by Application 2019 & 2032
- Table 23: Japan MEA Functional Beverages Industry Revenue (Million) Forecast, by Application 2019 & 2032
- Table 24: India MEA Functional Beverages Industry Revenue (Million) Forecast, by Application 2019 & 2032
- Table 25: South Korea MEA Functional Beverages Industry Revenue (Million) Forecast, by Application 2019 & 2032
- Table 26: Southeast Asia MEA Functional Beverages Industry Revenue (Million) Forecast, by Application 2019 & 2032
- Table 27: Australia MEA Functional Beverages Industry Revenue (Million) Forecast, by Application 2019 & 2032
- Table 28: Indonesia MEA Functional Beverages Industry Revenue (Million) Forecast, by Application 2019 & 2032
- Table 29: Phillipes MEA Functional Beverages Industry Revenue (Million) Forecast, by Application 2019 & 2032
- Table 30: Singapore MEA Functional Beverages Industry Revenue (Million) Forecast, by Application 2019 & 2032
- Table 31: Thailandc MEA Functional Beverages Industry Revenue (Million) Forecast, by Application 2019 & 2032
- Table 32: Rest of Asia Pacific MEA Functional Beverages Industry Revenue (Million) Forecast, by Application 2019 & 2032
- Table 33: Global MEA Functional Beverages Industry Revenue Million Forecast, by Country 2019 & 2032
- Table 34: Brazil MEA Functional Beverages Industry Revenue (Million) Forecast, by Application 2019 & 2032
- Table 35: Argentina MEA Functional Beverages Industry Revenue (Million) Forecast, by Application 2019 & 2032
- Table 36: Peru MEA Functional Beverages Industry Revenue (Million) Forecast, by Application 2019 & 2032
- Table 37: Chile MEA Functional Beverages Industry Revenue (Million) Forecast, by Application 2019 & 2032
- Table 38: Colombia MEA Functional Beverages Industry Revenue (Million) Forecast, by Application 2019 & 2032
- Table 39: Ecuador MEA Functional Beverages Industry Revenue (Million) Forecast, by Application 2019 & 2032
- Table 40: Venezuela MEA Functional Beverages Industry Revenue (Million) Forecast, by Application 2019 & 2032
- Table 41: Rest of South America MEA Functional Beverages Industry Revenue (Million) Forecast, by Application 2019 & 2032
- Table 42: Global MEA Functional Beverages Industry Revenue Million Forecast, by Country 2019 & 2032
- Table 43: United States MEA Functional Beverages Industry Revenue (Million) Forecast, by Application 2019 & 2032
- Table 44: Canada MEA Functional Beverages Industry Revenue (Million) Forecast, by Application 2019 & 2032
- Table 45: Mexico MEA Functional Beverages Industry Revenue (Million) Forecast, by Application 2019 & 2032
- Table 46: Global MEA Functional Beverages Industry Revenue Million Forecast, by Country 2019 & 2032
- Table 47: United Arab Emirates MEA Functional Beverages Industry Revenue (Million) Forecast, by Application 2019 & 2032
- Table 48: Saudi Arabia MEA Functional Beverages Industry Revenue (Million) Forecast, by Application 2019 & 2032
- Table 49: South Africa MEA Functional Beverages Industry Revenue (Million) Forecast, by Application 2019 & 2032
- Table 50: Rest of Middle East and Africa MEA Functional Beverages Industry Revenue (Million) Forecast, by Application 2019 & 2032
- Table 51: Global MEA Functional Beverages Industry Revenue Million Forecast, by Product Type 2019 & 2032
- Table 52: Global MEA Functional Beverages Industry Revenue Million Forecast, by Distribution Channel 2019 & 2032
- Table 53: Global MEA Functional Beverages Industry Revenue Million Forecast, by Geography 2019 & 2032
- Table 54: Global MEA Functional Beverages Industry Revenue Million Forecast, by Country 2019 & 2032
- Table 55: Global MEA Functional Beverages Industry Revenue Million Forecast, by Product Type 2019 & 2032
- Table 56: Global MEA Functional Beverages Industry Revenue Million Forecast, by Distribution Channel 2019 & 2032
- Table 57: Global MEA Functional Beverages Industry Revenue Million Forecast, by Geography 2019 & 2032
- Table 58: Global MEA Functional Beverages Industry Revenue Million Forecast, by Country 2019 & 2032
- Table 59: Global MEA Functional Beverages Industry Revenue Million Forecast, by Product Type 2019 & 2032
- Table 60: Global MEA Functional Beverages Industry Revenue Million Forecast, by Distribution Channel 2019 & 2032
- Table 61: Global MEA Functional Beverages Industry Revenue Million Forecast, by Geography 2019 & 2032
- Table 62: Global MEA Functional Beverages Industry Revenue Million Forecast, by Country 2019 & 2032
Frequently Asked Questions
1. What is the projected Compound Annual Growth Rate (CAGR) of the MEA Functional Beverages Industry?
The projected CAGR is approximately 4.17%.
2. Which companies are prominent players in the MEA Functional Beverages Industry?
Key companies in the market include Nestle SA, Herbalife International of America Inc, Sapporo Holdings, Mutalo Group, Monster Beverage Corporation, PepsiCo Inc, Dr Pepper Snapple, Viju Industries Nigeria Ltd, iPRO Sport Distribution Limited*List Not Exhaustive, Red Bull GmbH, The Coca-Cola Company.
3. What are the main segments of the MEA Functional Beverages Industry?
The market segments include Product Type, Distribution Channel, Geography.
4. Can you provide details about the market size?
The market size is estimated to be USD XX Million as of 2022.
5. What are some drivers contributing to market growth?
Preference for Plant-based and Clean-label RTD Products; Consumer Inclination Toward Sugar-Free Drinks.
6. What are the notable trends driving market growth?
Growing Demand for Plant-based and Lactose-free Products.
7. Are there any restraints impacting market growth?
Concerns Over Health Issues Associated With Beverages.
8. Can you provide examples of recent developments in the market?
October 2022: iPRO launched a range of sports drinks in Carrefour stores across the United Arab Emirates. The company claims that it contains 100% of the daily recommended vitamin C intake, along with added B vitamins.
9. What pricing options are available for accessing the report?
Pricing options include single-user, multi-user, and enterprise licenses priced at USD 4750, USD 5250, and USD 8750 respectively.
10. Is the market size provided in terms of value or volume?
The market size is provided in terms of value, measured in Million.
11. Are there any specific market keywords associated with the report?
Yes, the market keyword associated with the report is "MEA Functional Beverages Industry," which aids in identifying and referencing the specific market segment covered.
12. How do I determine which pricing option suits my needs best?
The pricing options vary based on user requirements and access needs. Individual users may opt for single-user licenses, while businesses requiring broader access may choose multi-user or enterprise licenses for cost-effective access to the report.
13. Are there any additional resources or data provided in the MEA Functional Beverages Industry report?
While the report offers comprehensive insights, it's advisable to review the specific contents or supplementary materials provided to ascertain if additional resources or data are available.
14. How can I stay updated on further developments or reports in the MEA Functional Beverages Industry?
To stay informed about further developments, trends, and reports in the MEA Functional Beverages Industry, consider subscribing to industry newsletters, following relevant companies and organizations, or regularly checking reputable industry news sources and publications.
Methodology
Step 1 - Identification of Relevant Samples Size from Population Database


Step 2 - Approaches for Defining Global Market Size (Value, Volume* & Price*)

Note*: In applicable scenarios
Step 3 - Data Sources
Primary Research
- Web Analytics
- Survey Reports
- Research Institute
- Latest Research Reports
- Opinion Leaders
Secondary Research
- Annual Reports
- White Paper
- Latest Press Release
- Industry Association
- Paid Database
- Investor Presentations

Step 4 - Data Triangulation
Involves using different sources of information in order to increase the validity of a study
These sources are likely to be stakeholders in a program - participants, other researchers, program staff, other community members, and so on.
Then we put all data in single framework & apply various statistical tools to find out the dynamic on the market.
During the analysis stage, feedback from the stakeholder groups would be compared to determine areas of agreement as well as areas of divergence


