
Key Insights
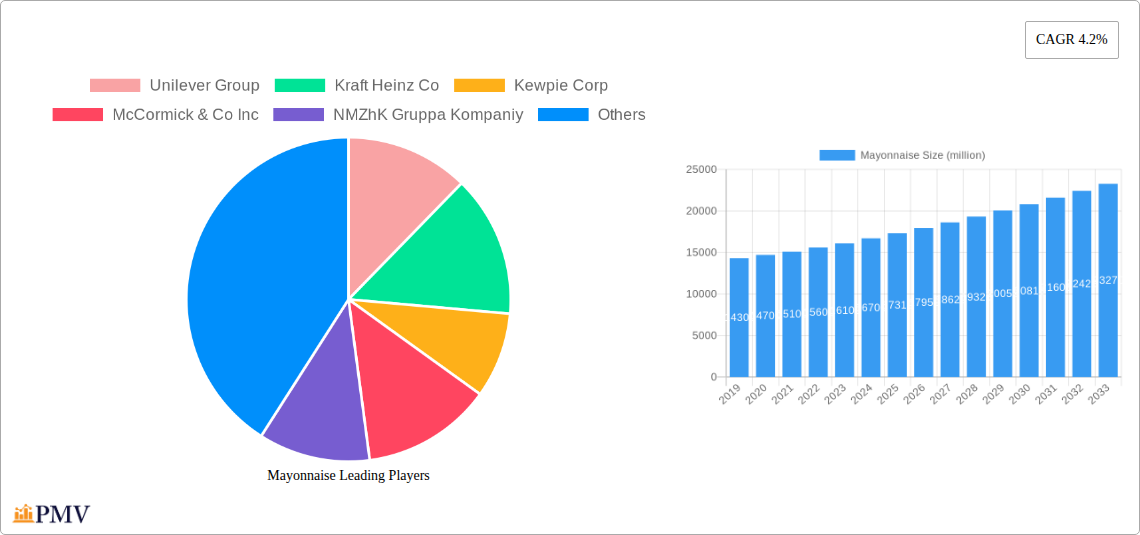
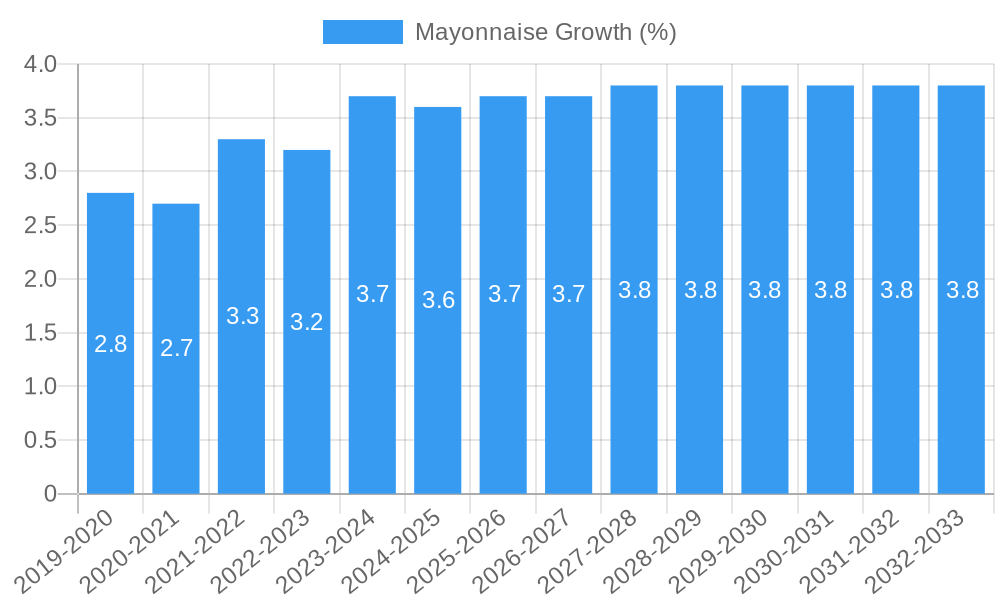
The global mayonnaise market is poised for robust growth, projected to reach a valuation of approximately $17,310 million by 2025, with a Compound Annual Growth Rate (CAGR) of 4.2% anticipated to sustain its expansion through 2033. This upward trajectory is primarily fueled by evolving consumer preferences towards convenient and versatile food options, coupled with a growing demand for innovative flavor profiles and premium ingredients. The retail sector serves as the dominant application segment, driven by increasing urbanization and the rising disposable incomes that empower consumers to opt for value-added food products. Furthermore, the food service industry, encompassing restaurants, cafes, and catering services, continues to be a significant contributor, leveraging mayonnaise as a staple ingredient in a wide array of dishes, from sandwiches and salads to dips and dressings. The "Unflavored Mayonnaise" segment commands a substantial market share due to its widespread use as a base ingredient, while "Flavored Mayonnaise" is experiencing considerable traction, with manufacturers introducing novel variants like sriracha, garlic aioli, and truffle to cater to adventurous palates.
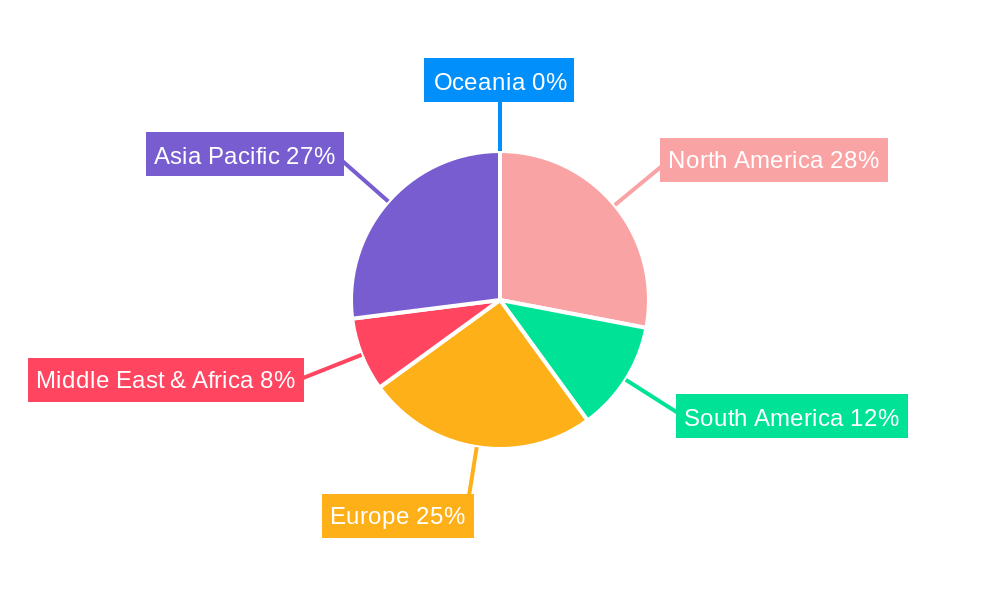
This dynamic market landscape is shaped by several key drivers and trends. The increasing focus on health and wellness is prompting the development of reduced-fat, low-calorie, and plant-based mayonnaise alternatives, appealing to a health-conscious demographic. Innovations in packaging, such as single-serve sachets and squeeze bottles, are enhancing convenience and shelf appeal, particularly within the retail space. Key players like Unilever Group, Kraft Heinz Co, and Kewpie Corp are actively investing in product development and strategic acquisitions to expand their market presence and cater to diverse consumer needs. However, the market also faces certain restraints, including fluctuations in the prices of raw materials like eggs and vegetable oils, which can impact production costs and profit margins. Geographically, the Asia Pacific region is expected to witness the highest growth due to its large population, increasing urbanization, and a burgeoning middle class with a growing appetite for Westernized food products.
Comprehensive Mayonnaise Market Report: Analysis, Trends, and Future Outlook (2019–2033)
This in-depth report provides a detailed analysis of the global mayonnaise market, covering historical trends, current dynamics, and future projections. With a study period from 2019 to 2033, a base year of 2025, and a forecast period of 2025–2033, this report is an essential resource for understanding market nuances, competitive landscapes, and emerging opportunities in the mayonnaise industry. Our analysis utilizes high-ranking SEO keywords to ensure maximum visibility and engagement for industry professionals, manufacturers, distributors, and investors.
Mayonnaise Market Structure & Competitive Dynamics
The global mayonnaise market is characterized by a moderate to high level of concentration, with a few dominant players holding significant market share, estimated to be in the billions of dollars. Key companies such as Unilever Group, Kraft Heinz Co, Kewpie Corp, and McCormick & Co Inc exert considerable influence through extensive distribution networks and strong brand recognition. Innovation ecosystems are actively nurtured, with companies investing in research and development to cater to evolving consumer preferences, including demands for healthier options and novel flavor profiles. Regulatory frameworks, primarily concerning food safety and labeling standards, are generally well-established but can vary across different regions, impacting market entry and product formulation. Product substitutes, including other salad dressings and sauces, present a competitive challenge, although mayonnaise’s unique texture and flavor profile maintain its strong market position. End-user trends are shifting towards convenience, premiumization, and plant-based alternatives, driving product innovation. Mergers and acquisition (M&A) activities, with deal values potentially reaching hundreds of millions, are strategic moves to consolidate market share, acquire innovative technologies, or expand geographical reach. For instance, recent M&A activity has focused on integrating companies with strong regional presence or those specializing in niche mayonnaise varieties. The overall market value is projected to exceed a trillion dollars by the end of the forecast period.
- Market Concentration: Moderate to High, driven by a few major global players.
- Innovation Ecosystems: Focused on R&D for healthier ingredients, unique flavors, and sustainable packaging.
- Regulatory Frameworks: Primarily focused on food safety, labeling, and ingredient transparency.
- Product Substitutes: Various salad dressings, sauces, and dips.
- End-User Trends: Growing demand for organic, vegan, low-fat, and gourmet mayonnaise options.
- M&A Activities: Strategic acquisitions to enhance market share and product portfolios, with significant financial transactions.
Mayonnaise Industry Trends & Insights
The mayonnaise industry is experiencing robust growth, projected to expand at a Compound Annual Growth Rate (CAGR) of approximately 5-7% throughout the forecast period. This upward trajectory is primarily fueled by several key market growth drivers. The increasing global population and rising disposable incomes, particularly in emerging economies, are expanding the consumer base for processed foods, with mayonnaise being a staple condiment and ingredient. Technological disruptions are playing a crucial role, with advancements in food processing, preservation techniques, and packaging technologies enabling the development of shelf-stable, convenient, and aesthetically appealing mayonnaise products. Furthermore, the rise of e-commerce platforms has significantly broadened market access for both manufacturers and consumers, facilitating the penetration of niche and premium mayonnaise varieties.
Consumer preferences are undergoing a significant transformation. There is a pronounced shift towards healthier lifestyle choices, leading to a surge in demand for low-fat, low-calorie, and plant-based mayonnaise options. Consumers are also showing a greater inclination towards premium and artisanal mayonnaise products, driven by a desire for unique flavors, high-quality ingredients, and sophisticated culinary experiences. This trend is particularly evident in Western markets, but its influence is spreading globally. The convenience factor remains paramount, with consumers seeking ready-to-use condiments that simplify meal preparation.
Competitive dynamics within the mayonnaise sector are intensifying. Established global players are focusing on product diversification and market penetration strategies, while smaller, niche brands are leveraging their agility to cater to specific consumer demands, such as organic, gluten-free, or allergen-free mayonnaise. The competitive landscape is also being shaped by strategic partnerships and collaborations aimed at expanding distribution channels and enhancing product offerings. The market penetration for mayonnaise remains high in developed regions, with significant growth opportunities in developing markets due to increasing urbanization and Westernization of food habits. The global market value is on track to reach trillions, with an estimated market size of over a trillion dollars by 2025 and projected to grow substantially over the next decade.
Dominant Markets & Segments in Mayonnaise
The global mayonnaise market exhibits distinct regional dominance and segment leadership, driven by a confluence of economic policies, consumer behavior, and infrastructural development.
Dominant Region & Key Markets: North America and Europe currently represent the largest and most mature markets for mayonnaise, with a market size in the hundreds of billions of dollars for each region. This dominance is attributed to deeply ingrained culinary traditions that heavily feature mayonnaise in various dishes, high disposable incomes, and well-established retail and food service infrastructures. The United States and Western European countries like Germany, France, and the United Kingdom are significant contributors. Asia Pacific is emerging as a rapid growth region, with countries like China, Japan, and India showing substantial market expansion, driven by increasing urbanization, a growing middle class, and the adoption of Western dietary habits. Latin America also presents considerable potential, with Mexico and Brazil leading the charge.
- Key Drivers of Regional Dominance:
- Economic Policies: Favorable trade agreements and supportive policies for the food processing industry.
- Infrastructure: Advanced logistics and cold chain facilities enabling efficient distribution.
- Consumer Habits: Strong traditional consumption patterns and increasing adoption of Western diets.
- Disposable Income: Higher purchasing power for premium and convenience food products.
Dominant Application Segment: The Retail application segment holds the largest market share, accounting for over sixty percent of the total market value, estimated to be in the hundreds of billions of dollars. This is driven by household consumption, where mayonnaise is a staple in refrigerators for sandwiches, salads, dips, and as a cooking ingredient. The accessibility of supermarkets, hypermarkets, and convenience stores ensures widespread availability. The Food Service segment follows closely, with a significant market share in the tens of billions of dollars, encompassing restaurants, cafes, fast-food chains, and catering services. The growing HORECA (Hotel, Restaurant, and Catering) sector globally fuels demand from this segment. The Others segment, which includes industrial applications and private label manufacturing, also contributes to the overall market.
- Key Drivers of Application Dominance (Retail):
- Household Penetration: Mayonnaise is a pantry staple in many households.
- Convenience: Ready-to-use nature simplifies meal preparation.
- Versatility: Used in a wide array of culinary applications.
- Retail Infrastructure: Extensive network of grocery stores and online platforms.
Dominant Type Segment: Unflavored Mayonnaise is the leading segment by market volume and value, with a market share estimated to be in the hundreds of billions of dollars. This classic variant serves as a base for numerous recipes and culinary creations. However, Flavored Mayonnaise is experiencing robust growth, driven by consumer demand for diverse taste profiles. Varieties such as garlic, sriracha, chipotle, and herb-infused mayonnaise are gaining popularity, contributing a significant portion, estimated in the tens of billions of dollars, to the overall market. The Others segment, encompassing specialized mayonnaise products like egg-free or vegan mayonnaise, is also a rapidly expanding niche.
- Key Drivers of Type Dominance (Unflavored):
- Versatility: Acts as a foundational ingredient and condiment.
- Consumer Familiarity: Long-standing preference for the classic taste.
- Cost-Effectiveness: Generally more affordable than specialty variants.
- Key Drivers of Type Growth (Flavored):
- Consumer Curiosity: Desire for novel and exciting flavor experiences.
- Culinary Trends: Influence of global cuisines and fusion dishes.
- Product Differentiation: Manufacturers offering unique flavor combinations.
Mayonnaise Product Innovations
Mayonnaise product innovations are largely centered on addressing evolving consumer demands for health, taste, and convenience. Key developments include the introduction of plant-based and vegan mayonnaise options utilizing ingredients like aquafaba and soy, catering to a growing vegan and vegetarian population. Low-fat and reduced-calorie formulations are increasingly prevalent, often employing natural sweeteners or alternative emulsifiers. Furthermore, manufacturers are expanding the spectrum of flavored mayonnaise, introducing gourmet and exotic profiles that cater to adventurous palates. These innovations aim to differentiate brands, capture niche markets, and enhance competitive advantage by offering superior taste, healthier alternatives, and unique culinary solutions. The market is witnessing the rise of premium, artisanal mayonnaise made with high-quality oils and natural ingredients, further pushing the boundaries of product offerings.
Report Segmentation & Scope
This comprehensive report segments the global mayonnaise market across key parameters to provide granular insights. The Application segmentation includes:
- Retail: Covering household consumption through grocery stores, hypermarkets, and online retail. Projected market size in the hundreds of billions of dollars, with steady growth.
- Food Service: Encompassing restaurants, catering, and institutional use, with a projected market size in the tens of billions of dollars and significant growth driven by the HORECA sector.
- Others: Including industrial uses and private label manufacturing, with a smaller but developing market share.
The Type segmentation details:
- Unflavored Mayonnaise: The dominant segment, with a projected market size in the hundreds of billions of dollars, characterized by stable demand.
- Flavored Mayonnaise: A rapidly growing segment, with a projected market size in the tens of billions of dollars, driven by consumer preference for variety and innovation.
- Others: Including specialized variants like egg-free, vegan, and low-sodium mayonnaise, representing a niche but high-growth area.
The scope of this report covers global and regional market dynamics, competitive analysis, trend identification, and future outlook for the period 2019–2033.
Key Drivers of Mayonnaise Growth
Several interconnected factors are propelling the growth of the global mayonnaise market. The increasing global population and rising urbanization contribute to a larger consumer base and greater demand for convenient food products. Economic development and increasing disposable incomes, especially in emerging economies, enable consumers to purchase more processed foods and premium condiments. Technological advancements in food processing and preservation are leading to the development of higher-quality, longer-shelf-life, and more diverse mayonnaise products. Furthermore, evolving consumer preferences for healthier options, such as plant-based and low-fat alternatives, are creating new market segments and driving innovation. The growing popularity of international cuisines and fusion food trends also fuels demand for flavored and specialty mayonnaise varieties.
- Demographic Shifts: Population growth and urbanization.
- Economic Factors: Rising disposable incomes and expanding middle class.
- Technological Innovations: Improved processing and product development.
- Consumer Lifestyle: Demand for convenience and healthier alternatives.
- Culinary Trends: Growing interest in global flavors and food experimentation.
Challenges in the Mayonnaise Sector
Despite its growth, the mayonnaise sector faces several challenges that can impact market expansion. Intense competition from established brands and new entrants can lead to price wars and reduced profit margins. Fluctuations in the prices of key raw materials, such as eggs and vegetable oils, can affect production costs and overall profitability. Stringent food safety regulations and evolving labeling requirements across different countries can increase compliance costs and necessitate product reformulation. Consumer perception regarding the healthiness of mayonnaise, particularly traditional varieties, can be a barrier, necessitating continuous efforts in product innovation towards healthier formulations. Supply chain disruptions, as witnessed in recent global events, can affect the availability and cost of raw materials and finished products.
- Intense Competition: Price pressures and market saturation.
- Raw Material Volatility: Fluctuations in egg and oil prices.
- Regulatory Compliance: Varying food safety and labeling standards.
- Health Perceptions: Consumer concerns about fat and calorie content.
- Supply Chain Vulnerabilities: Risks of disruption and increased logistics costs.
Leading Players in the Mayonnaise Market
- Unilever Group
- Kraft Heinz Co
- Kewpie Corp
- McCormick & Co Inc
- NMZhK Gruppa Kompaniy
- Essen Production AG ZAO
- Efko OAO
- Nestlé SA
- Rusagro GK
- Aceitera General Deheza SA
- Nefis Group
- Ajinomoto Co Inc
- Foodcorp (Pty) Ltd
- Cargill Inc
- Oetker-Gruppe
- VRB Consumer Products Pvt Ltd
- Skit OOO
- Agra Industrier AS
- Tiger Brands Ltd
- Schedro TM
- Wilmar International Ltd
- Agrolimen SA
- Avril Group
- Viktor & PP
- Bunge Ltd
- Conservas La Costeña SA de CV
- Lasalle Food Indonesia PT
- Grupo Ybarra Alimentacion SL
- WSP Spolem Kielce
- Alicorp SAA
- Ottogi Foods Co Ltd
- Del Monte Pacific Ltd
- Van Wijngaarden BV
- Olis Ltd TOV
- Basamh Trading Co
Key Developments in Mayonnaise Sector
- 2023/01: Unilever launches a new range of plant-based mayonnaise in North America, tapping into the vegan trend.
- 2022/07: Kraft Heinz Co acquires a specialty sauce manufacturer, expanding its portfolio of flavored condiments.
- 2022/03: Kewpie Corp introduces reduced-fat mayonnaise in key Asian markets, responding to growing health consciousness.
- 2021/11: McCormick & Co Inc announces strategic partnerships with several regional food distributors to enhance its market reach.
- 2021/05: Efko OAO invests heavily in advanced production technology to improve the quality and efficiency of its mayonnaise output.
- 2020/09: Rusagro GK expands its product line with organic mayonnaise options, catering to a premium segment of consumers.
- 2020/02: Nestlé SA innovates with a new packaging solution for mayonnaise, focusing on enhanced convenience and sustainability.
Strategic Mayonnaise Market Outlook
The strategic outlook for the mayonnaise market remains highly promising, with significant growth accelerators expected to shape its future. The increasing demand for health-conscious and sustainable food options will continue to drive innovation in plant-based, organic, and low-calorie mayonnaise. Emerging markets, with their expanding middle class and evolving food habits, present substantial untapped potential for market penetration. The consolidation of retail channels, including the burgeoning e-commerce landscape, will offer greater accessibility and new avenues for product promotion. Manufacturers focusing on product diversification, including unique flavor profiles and premium offerings, will be well-positioned to capture higher market shares. Strategic collaborations and mergers will likely continue to shape the competitive landscape, enabling companies to leverage synergies and expand their global footprint. The overall market trajectory suggests sustained growth, driven by a dynamic interplay of consumer preferences, technological advancements, and global economic trends.
Mayonnaise Segmentation
-
1. Application
- 1.1. Retail
- 1.2. Food Service
- 1.3. Others
-
2. Type
- 2.1. Unflavored Mayonnaise
- 2.2. Flavored Mayonnaise
- 2.3. Others
Mayonnaise Segmentation By Geography
-
1. North America
- 1.1. United States
- 1.2. Canada
- 1.3. Mexico
-
2. South America
- 2.1. Brazil
- 2.2. Argentina
- 2.3. Rest of South America
-
3. Europe
- 3.1. United Kingdom
- 3.2. Germany
- 3.3. France
- 3.4. Italy
- 3.5. Spain
- 3.6. Russia
- 3.7. Benelux
- 3.8. Nordics
- 3.9. Rest of Europe
-
4. Middle East & Africa
- 4.1. Turkey
- 4.2. Israel
- 4.3. GCC
- 4.4. North Africa
- 4.5. South Africa
- 4.6. Rest of Middle East & Africa
-
5. Asia Pacific
- 5.1. China
- 5.2. India
- 5.3. Japan
- 5.4. South Korea
- 5.5. ASEAN
- 5.6. Oceania
- 5.7. Rest of Asia Pacific
Mayonnaise REPORT HIGHLIGHTS
| Aspects | Details |
|---|---|
| Study Period | 2019-2033 |
| Base Year | 2024 |
| Estimated Year | 2025 |
| Forecast Period | 2025-2033 |
| Historical Period | 2019-2024 |
| Growth Rate | CAGR of 4.2% from 2019-2033 |
| Segmentation |
|
Table of Contents
- 1. Introduction
- 1.1. Research Scope
- 1.2. Market Segmentation
- 1.3. Research Methodology
- 1.4. Definitions and Assumptions
- 2. Executive Summary
- 2.1. Introduction
- 3. Market Dynamics
- 3.1. Introduction
- 3.2. Market Drivers
- 3.3. Market Restrains
- 3.4. Market Trends
- 4. Market Factor Analysis
- 4.1. Porters Five Forces
- 4.2. Supply/Value Chain
- 4.3. PESTEL analysis
- 4.4. Market Entropy
- 4.5. Patent/Trademark Analysis
- 5. Global Mayonnaise Analysis, Insights and Forecast, 2019-2031
- 5.1. Market Analysis, Insights and Forecast - by Application
- 5.1.1. Retail
- 5.1.2. Food Service
- 5.1.3. Others
- 5.2. Market Analysis, Insights and Forecast - by Type
- 5.2.1. Unflavored Mayonnaise
- 5.2.2. Flavored Mayonnaise
- 5.2.3. Others
- 5.3. Market Analysis, Insights and Forecast - by Region
- 5.3.1. North America
- 5.3.2. South America
- 5.3.3. Europe
- 5.3.4. Middle East & Africa
- 5.3.5. Asia Pacific
- 5.1. Market Analysis, Insights and Forecast - by Application
- 6. North America Mayonnaise Analysis, Insights and Forecast, 2019-2031
- 6.1. Market Analysis, Insights and Forecast - by Application
- 6.1.1. Retail
- 6.1.2. Food Service
- 6.1.3. Others
- 6.2. Market Analysis, Insights and Forecast - by Type
- 6.2.1. Unflavored Mayonnaise
- 6.2.2. Flavored Mayonnaise
- 6.2.3. Others
- 6.1. Market Analysis, Insights and Forecast - by Application
- 7. South America Mayonnaise Analysis, Insights and Forecast, 2019-2031
- 7.1. Market Analysis, Insights and Forecast - by Application
- 7.1.1. Retail
- 7.1.2. Food Service
- 7.1.3. Others
- 7.2. Market Analysis, Insights and Forecast - by Type
- 7.2.1. Unflavored Mayonnaise
- 7.2.2. Flavored Mayonnaise
- 7.2.3. Others
- 7.1. Market Analysis, Insights and Forecast - by Application
- 8. Europe Mayonnaise Analysis, Insights and Forecast, 2019-2031
- 8.1. Market Analysis, Insights and Forecast - by Application
- 8.1.1. Retail
- 8.1.2. Food Service
- 8.1.3. Others
- 8.2. Market Analysis, Insights and Forecast - by Type
- 8.2.1. Unflavored Mayonnaise
- 8.2.2. Flavored Mayonnaise
- 8.2.3. Others
- 8.1. Market Analysis, Insights and Forecast - by Application
- 9. Middle East & Africa Mayonnaise Analysis, Insights and Forecast, 2019-2031
- 9.1. Market Analysis, Insights and Forecast - by Application
- 9.1.1. Retail
- 9.1.2. Food Service
- 9.1.3. Others
- 9.2. Market Analysis, Insights and Forecast - by Type
- 9.2.1. Unflavored Mayonnaise
- 9.2.2. Flavored Mayonnaise
- 9.2.3. Others
- 9.1. Market Analysis, Insights and Forecast - by Application
- 10. Asia Pacific Mayonnaise Analysis, Insights and Forecast, 2019-2031
- 10.1. Market Analysis, Insights and Forecast - by Application
- 10.1.1. Retail
- 10.1.2. Food Service
- 10.1.3. Others
- 10.2. Market Analysis, Insights and Forecast - by Type
- 10.2.1. Unflavored Mayonnaise
- 10.2.2. Flavored Mayonnaise
- 10.2.3. Others
- 10.1. Market Analysis, Insights and Forecast - by Application
- 11. Competitive Analysis
- 11.1. Global Market Share Analysis 2024
- 11.2. Company Profiles
- 11.2.1 Unilever Group
- 11.2.1.1. Overview
- 11.2.1.2. Products
- 11.2.1.3. SWOT Analysis
- 11.2.1.4. Recent Developments
- 11.2.1.5. Financials (Based on Availability)
- 11.2.2 Kraft Heinz Co
- 11.2.2.1. Overview
- 11.2.2.2. Products
- 11.2.2.3. SWOT Analysis
- 11.2.2.4. Recent Developments
- 11.2.2.5. Financials (Based on Availability)
- 11.2.3 Kewpie Corp
- 11.2.3.1. Overview
- 11.2.3.2. Products
- 11.2.3.3. SWOT Analysis
- 11.2.3.4. Recent Developments
- 11.2.3.5. Financials (Based on Availability)
- 11.2.4 McCormick & Co Inc
- 11.2.4.1. Overview
- 11.2.4.2. Products
- 11.2.4.3. SWOT Analysis
- 11.2.4.4. Recent Developments
- 11.2.4.5. Financials (Based on Availability)
- 11.2.5 NMZhK Gruppa Kompaniy
- 11.2.5.1. Overview
- 11.2.5.2. Products
- 11.2.5.3. SWOT Analysis
- 11.2.5.4. Recent Developments
- 11.2.5.5. Financials (Based on Availability)
- 11.2.6 Essen Production AG ZAO
- 11.2.6.1. Overview
- 11.2.6.2. Products
- 11.2.6.3. SWOT Analysis
- 11.2.6.4. Recent Developments
- 11.2.6.5. Financials (Based on Availability)
- 11.2.7 Efko OAO
- 11.2.7.1. Overview
- 11.2.7.2. Products
- 11.2.7.3. SWOT Analysis
- 11.2.7.4. Recent Developments
- 11.2.7.5. Financials (Based on Availability)
- 11.2.8 Nestlé SA
- 11.2.8.1. Overview
- 11.2.8.2. Products
- 11.2.8.3. SWOT Analysis
- 11.2.8.4. Recent Developments
- 11.2.8.5. Financials (Based on Availability)
- 11.2.9 Rusagro GK
- 11.2.9.1. Overview
- 11.2.9.2. Products
- 11.2.9.3. SWOT Analysis
- 11.2.9.4. Recent Developments
- 11.2.9.5. Financials (Based on Availability)
- 11.2.10 Aceitera General Deheza SA
- 11.2.10.1. Overview
- 11.2.10.2. Products
- 11.2.10.3. SWOT Analysis
- 11.2.10.4. Recent Developments
- 11.2.10.5. Financials (Based on Availability)
- 11.2.11 Nefis Group
- 11.2.11.1. Overview
- 11.2.11.2. Products
- 11.2.11.3. SWOT Analysis
- 11.2.11.4. Recent Developments
- 11.2.11.5. Financials (Based on Availability)
- 11.2.12 Ajinomoto Co Inc
- 11.2.12.1. Overview
- 11.2.12.2. Products
- 11.2.12.3. SWOT Analysis
- 11.2.12.4. Recent Developments
- 11.2.12.5. Financials (Based on Availability)
- 11.2.13 Foodcorp (Pty) Ltd
- 11.2.13.1. Overview
- 11.2.13.2. Products
- 11.2.13.3. SWOT Analysis
- 11.2.13.4. Recent Developments
- 11.2.13.5. Financials (Based on Availability)
- 11.2.14 Cargill Inc
- 11.2.14.1. Overview
- 11.2.14.2. Products
- 11.2.14.3. SWOT Analysis
- 11.2.14.4. Recent Developments
- 11.2.14.5. Financials (Based on Availability)
- 11.2.15 Oetker-Gruppe
- 11.2.15.1. Overview
- 11.2.15.2. Products
- 11.2.15.3. SWOT Analysis
- 11.2.15.4. Recent Developments
- 11.2.15.5. Financials (Based on Availability)
- 11.2.16 VRB Consumer Products Pvt Ltd
- 11.2.16.1. Overview
- 11.2.16.2. Products
- 11.2.16.3. SWOT Analysis
- 11.2.16.4. Recent Developments
- 11.2.16.5. Financials (Based on Availability)
- 11.2.17 Skit OOO
- 11.2.17.1. Overview
- 11.2.17.2. Products
- 11.2.17.3. SWOT Analysis
- 11.2.17.4. Recent Developments
- 11.2.17.5. Financials (Based on Availability)
- 11.2.18 Agra Industrier AS
- 11.2.18.1. Overview
- 11.2.18.2. Products
- 11.2.18.3. SWOT Analysis
- 11.2.18.4. Recent Developments
- 11.2.18.5. Financials (Based on Availability)
- 11.2.19 Tiger Brands Ltd
- 11.2.19.1. Overview
- 11.2.19.2. Products
- 11.2.19.3. SWOT Analysis
- 11.2.19.4. Recent Developments
- 11.2.19.5. Financials (Based on Availability)
- 11.2.20 Schedro TM
- 11.2.20.1. Overview
- 11.2.20.2. Products
- 11.2.20.3. SWOT Analysis
- 11.2.20.4. Recent Developments
- 11.2.20.5. Financials (Based on Availability)
- 11.2.21 Wilmar International Ltd
- 11.2.21.1. Overview
- 11.2.21.2. Products
- 11.2.21.3. SWOT Analysis
- 11.2.21.4. Recent Developments
- 11.2.21.5. Financials (Based on Availability)
- 11.2.22 Agrolimen SA
- 11.2.22.1. Overview
- 11.2.22.2. Products
- 11.2.22.3. SWOT Analysis
- 11.2.22.4. Recent Developments
- 11.2.22.5. Financials (Based on Availability)
- 11.2.23 Avril Group
- 11.2.23.1. Overview
- 11.2.23.2. Products
- 11.2.23.3. SWOT Analysis
- 11.2.23.4. Recent Developments
- 11.2.23.5. Financials (Based on Availability)
- 11.2.24 Viktor & K PP
- 11.2.24.1. Overview
- 11.2.24.2. Products
- 11.2.24.3. SWOT Analysis
- 11.2.24.4. Recent Developments
- 11.2.24.5. Financials (Based on Availability)
- 11.2.25 Bunge Ltd
- 11.2.25.1. Overview
- 11.2.25.2. Products
- 11.2.25.3. SWOT Analysis
- 11.2.25.4. Recent Developments
- 11.2.25.5. Financials (Based on Availability)
- 11.2.26 Conservas La Costeña SA de CV
- 11.2.26.1. Overview
- 11.2.26.2. Products
- 11.2.26.3. SWOT Analysis
- 11.2.26.4. Recent Developments
- 11.2.26.5. Financials (Based on Availability)
- 11.2.27 Lasalle Food Indonesia PT
- 11.2.27.1. Overview
- 11.2.27.2. Products
- 11.2.27.3. SWOT Analysis
- 11.2.27.4. Recent Developments
- 11.2.27.5. Financials (Based on Availability)
- 11.2.28 Grupo Ybarra Alimentacion SL
- 11.2.28.1. Overview
- 11.2.28.2. Products
- 11.2.28.3. SWOT Analysis
- 11.2.28.4. Recent Developments
- 11.2.28.5. Financials (Based on Availability)
- 11.2.29 WSP Spolem Kielce
- 11.2.29.1. Overview
- 11.2.29.2. Products
- 11.2.29.3. SWOT Analysis
- 11.2.29.4. Recent Developments
- 11.2.29.5. Financials (Based on Availability)
- 11.2.30 Alicorp SAA
- 11.2.30.1. Overview
- 11.2.30.2. Products
- 11.2.30.3. SWOT Analysis
- 11.2.30.4. Recent Developments
- 11.2.30.5. Financials (Based on Availability)
- 11.2.31 Ottogi Foods Co Ltd
- 11.2.31.1. Overview
- 11.2.31.2. Products
- 11.2.31.3. SWOT Analysis
- 11.2.31.4. Recent Developments
- 11.2.31.5. Financials (Based on Availability)
- 11.2.32 Del Monte Pacific Ltd
- 11.2.32.1. Overview
- 11.2.32.2. Products
- 11.2.32.3. SWOT Analysis
- 11.2.32.4. Recent Developments
- 11.2.32.5. Financials (Based on Availability)
- 11.2.33 Van Wijngaarden BV
- 11.2.33.1. Overview
- 11.2.33.2. Products
- 11.2.33.3. SWOT Analysis
- 11.2.33.4. Recent Developments
- 11.2.33.5. Financials (Based on Availability)
- 11.2.34 Olis Ltd TOV
- 11.2.34.1. Overview
- 11.2.34.2. Products
- 11.2.34.3. SWOT Analysis
- 11.2.34.4. Recent Developments
- 11.2.34.5. Financials (Based on Availability)
- 11.2.35 Basamh Trading Co
- 11.2.35.1. Overview
- 11.2.35.2. Products
- 11.2.35.3. SWOT Analysis
- 11.2.35.4. Recent Developments
- 11.2.35.5. Financials (Based on Availability)
- 11.2.1 Unilever Group
List of Figures
- Figure 1: Global Mayonnaise Revenue Breakdown (million, %) by Region 2024 & 2032
- Figure 2: Global Mayonnaise Volume Breakdown (K, %) by Region 2024 & 2032
- Figure 3: North America Mayonnaise Revenue (million), by Application 2024 & 2032
- Figure 4: North America Mayonnaise Volume (K), by Application 2024 & 2032
- Figure 5: North America Mayonnaise Revenue Share (%), by Application 2024 & 2032
- Figure 6: North America Mayonnaise Volume Share (%), by Application 2024 & 2032
- Figure 7: North America Mayonnaise Revenue (million), by Type 2024 & 2032
- Figure 8: North America Mayonnaise Volume (K), by Type 2024 & 2032
- Figure 9: North America Mayonnaise Revenue Share (%), by Type 2024 & 2032
- Figure 10: North America Mayonnaise Volume Share (%), by Type 2024 & 2032
- Figure 11: North America Mayonnaise Revenue (million), by Country 2024 & 2032
- Figure 12: North America Mayonnaise Volume (K), by Country 2024 & 2032
- Figure 13: North America Mayonnaise Revenue Share (%), by Country 2024 & 2032
- Figure 14: North America Mayonnaise Volume Share (%), by Country 2024 & 2032
- Figure 15: South America Mayonnaise Revenue (million), by Application 2024 & 2032
- Figure 16: South America Mayonnaise Volume (K), by Application 2024 & 2032
- Figure 17: South America Mayonnaise Revenue Share (%), by Application 2024 & 2032
- Figure 18: South America Mayonnaise Volume Share (%), by Application 2024 & 2032
- Figure 19: South America Mayonnaise Revenue (million), by Type 2024 & 2032
- Figure 20: South America Mayonnaise Volume (K), by Type 2024 & 2032
- Figure 21: South America Mayonnaise Revenue Share (%), by Type 2024 & 2032
- Figure 22: South America Mayonnaise Volume Share (%), by Type 2024 & 2032
- Figure 23: South America Mayonnaise Revenue (million), by Country 2024 & 2032
- Figure 24: South America Mayonnaise Volume (K), by Country 2024 & 2032
- Figure 25: South America Mayonnaise Revenue Share (%), by Country 2024 & 2032
- Figure 26: South America Mayonnaise Volume Share (%), by Country 2024 & 2032
- Figure 27: Europe Mayonnaise Revenue (million), by Application 2024 & 2032
- Figure 28: Europe Mayonnaise Volume (K), by Application 2024 & 2032
- Figure 29: Europe Mayonnaise Revenue Share (%), by Application 2024 & 2032
- Figure 30: Europe Mayonnaise Volume Share (%), by Application 2024 & 2032
- Figure 31: Europe Mayonnaise Revenue (million), by Type 2024 & 2032
- Figure 32: Europe Mayonnaise Volume (K), by Type 2024 & 2032
- Figure 33: Europe Mayonnaise Revenue Share (%), by Type 2024 & 2032
- Figure 34: Europe Mayonnaise Volume Share (%), by Type 2024 & 2032
- Figure 35: Europe Mayonnaise Revenue (million), by Country 2024 & 2032
- Figure 36: Europe Mayonnaise Volume (K), by Country 2024 & 2032
- Figure 37: Europe Mayonnaise Revenue Share (%), by Country 2024 & 2032
- Figure 38: Europe Mayonnaise Volume Share (%), by Country 2024 & 2032
- Figure 39: Middle East & Africa Mayonnaise Revenue (million), by Application 2024 & 2032
- Figure 40: Middle East & Africa Mayonnaise Volume (K), by Application 2024 & 2032
- Figure 41: Middle East & Africa Mayonnaise Revenue Share (%), by Application 2024 & 2032
- Figure 42: Middle East & Africa Mayonnaise Volume Share (%), by Application 2024 & 2032
- Figure 43: Middle East & Africa Mayonnaise Revenue (million), by Type 2024 & 2032
- Figure 44: Middle East & Africa Mayonnaise Volume (K), by Type 2024 & 2032
- Figure 45: Middle East & Africa Mayonnaise Revenue Share (%), by Type 2024 & 2032
- Figure 46: Middle East & Africa Mayonnaise Volume Share (%), by Type 2024 & 2032
- Figure 47: Middle East & Africa Mayonnaise Revenue (million), by Country 2024 & 2032
- Figure 48: Middle East & Africa Mayonnaise Volume (K), by Country 2024 & 2032
- Figure 49: Middle East & Africa Mayonnaise Revenue Share (%), by Country 2024 & 2032
- Figure 50: Middle East & Africa Mayonnaise Volume Share (%), by Country 2024 & 2032
- Figure 51: Asia Pacific Mayonnaise Revenue (million), by Application 2024 & 2032
- Figure 52: Asia Pacific Mayonnaise Volume (K), by Application 2024 & 2032
- Figure 53: Asia Pacific Mayonnaise Revenue Share (%), by Application 2024 & 2032
- Figure 54: Asia Pacific Mayonnaise Volume Share (%), by Application 2024 & 2032
- Figure 55: Asia Pacific Mayonnaise Revenue (million), by Type 2024 & 2032
- Figure 56: Asia Pacific Mayonnaise Volume (K), by Type 2024 & 2032
- Figure 57: Asia Pacific Mayonnaise Revenue Share (%), by Type 2024 & 2032
- Figure 58: Asia Pacific Mayonnaise Volume Share (%), by Type 2024 & 2032
- Figure 59: Asia Pacific Mayonnaise Revenue (million), by Country 2024 & 2032
- Figure 60: Asia Pacific Mayonnaise Volume (K), by Country 2024 & 2032
- Figure 61: Asia Pacific Mayonnaise Revenue Share (%), by Country 2024 & 2032
- Figure 62: Asia Pacific Mayonnaise Volume Share (%), by Country 2024 & 2032
List of Tables
- Table 1: Global Mayonnaise Revenue million Forecast, by Region 2019 & 2032
- Table 2: Global Mayonnaise Volume K Forecast, by Region 2019 & 2032
- Table 3: Global Mayonnaise Revenue million Forecast, by Application 2019 & 2032
- Table 4: Global Mayonnaise Volume K Forecast, by Application 2019 & 2032
- Table 5: Global Mayonnaise Revenue million Forecast, by Type 2019 & 2032
- Table 6: Global Mayonnaise Volume K Forecast, by Type 2019 & 2032
- Table 7: Global Mayonnaise Revenue million Forecast, by Region 2019 & 2032
- Table 8: Global Mayonnaise Volume K Forecast, by Region 2019 & 2032
- Table 9: Global Mayonnaise Revenue million Forecast, by Application 2019 & 2032
- Table 10: Global Mayonnaise Volume K Forecast, by Application 2019 & 2032
- Table 11: Global Mayonnaise Revenue million Forecast, by Type 2019 & 2032
- Table 12: Global Mayonnaise Volume K Forecast, by Type 2019 & 2032
- Table 13: Global Mayonnaise Revenue million Forecast, by Country 2019 & 2032
- Table 14: Global Mayonnaise Volume K Forecast, by Country 2019 & 2032
- Table 15: United States Mayonnaise Revenue (million) Forecast, by Application 2019 & 2032
- Table 16: United States Mayonnaise Volume (K) Forecast, by Application 2019 & 2032
- Table 17: Canada Mayonnaise Revenue (million) Forecast, by Application 2019 & 2032
- Table 18: Canada Mayonnaise Volume (K) Forecast, by Application 2019 & 2032
- Table 19: Mexico Mayonnaise Revenue (million) Forecast, by Application 2019 & 2032
- Table 20: Mexico Mayonnaise Volume (K) Forecast, by Application 2019 & 2032
- Table 21: Global Mayonnaise Revenue million Forecast, by Application 2019 & 2032
- Table 22: Global Mayonnaise Volume K Forecast, by Application 2019 & 2032
- Table 23: Global Mayonnaise Revenue million Forecast, by Type 2019 & 2032
- Table 24: Global Mayonnaise Volume K Forecast, by Type 2019 & 2032
- Table 25: Global Mayonnaise Revenue million Forecast, by Country 2019 & 2032
- Table 26: Global Mayonnaise Volume K Forecast, by Country 2019 & 2032
- Table 27: Brazil Mayonnaise Revenue (million) Forecast, by Application 2019 & 2032
- Table 28: Brazil Mayonnaise Volume (K) Forecast, by Application 2019 & 2032
- Table 29: Argentina Mayonnaise Revenue (million) Forecast, by Application 2019 & 2032
- Table 30: Argentina Mayonnaise Volume (K) Forecast, by Application 2019 & 2032
- Table 31: Rest of South America Mayonnaise Revenue (million) Forecast, by Application 2019 & 2032
- Table 32: Rest of South America Mayonnaise Volume (K) Forecast, by Application 2019 & 2032
- Table 33: Global Mayonnaise Revenue million Forecast, by Application 2019 & 2032
- Table 34: Global Mayonnaise Volume K Forecast, by Application 2019 & 2032
- Table 35: Global Mayonnaise Revenue million Forecast, by Type 2019 & 2032
- Table 36: Global Mayonnaise Volume K Forecast, by Type 2019 & 2032
- Table 37: Global Mayonnaise Revenue million Forecast, by Country 2019 & 2032
- Table 38: Global Mayonnaise Volume K Forecast, by Country 2019 & 2032
- Table 39: United Kingdom Mayonnaise Revenue (million) Forecast, by Application 2019 & 2032
- Table 40: United Kingdom Mayonnaise Volume (K) Forecast, by Application 2019 & 2032
- Table 41: Germany Mayonnaise Revenue (million) Forecast, by Application 2019 & 2032
- Table 42: Germany Mayonnaise Volume (K) Forecast, by Application 2019 & 2032
- Table 43: France Mayonnaise Revenue (million) Forecast, by Application 2019 & 2032
- Table 44: France Mayonnaise Volume (K) Forecast, by Application 2019 & 2032
- Table 45: Italy Mayonnaise Revenue (million) Forecast, by Application 2019 & 2032
- Table 46: Italy Mayonnaise Volume (K) Forecast, by Application 2019 & 2032
- Table 47: Spain Mayonnaise Revenue (million) Forecast, by Application 2019 & 2032
- Table 48: Spain Mayonnaise Volume (K) Forecast, by Application 2019 & 2032
- Table 49: Russia Mayonnaise Revenue (million) Forecast, by Application 2019 & 2032
- Table 50: Russia Mayonnaise Volume (K) Forecast, by Application 2019 & 2032
- Table 51: Benelux Mayonnaise Revenue (million) Forecast, by Application 2019 & 2032
- Table 52: Benelux Mayonnaise Volume (K) Forecast, by Application 2019 & 2032
- Table 53: Nordics Mayonnaise Revenue (million) Forecast, by Application 2019 & 2032
- Table 54: Nordics Mayonnaise Volume (K) Forecast, by Application 2019 & 2032
- Table 55: Rest of Europe Mayonnaise Revenue (million) Forecast, by Application 2019 & 2032
- Table 56: Rest of Europe Mayonnaise Volume (K) Forecast, by Application 2019 & 2032
- Table 57: Global Mayonnaise Revenue million Forecast, by Application 2019 & 2032
- Table 58: Global Mayonnaise Volume K Forecast, by Application 2019 & 2032
- Table 59: Global Mayonnaise Revenue million Forecast, by Type 2019 & 2032
- Table 60: Global Mayonnaise Volume K Forecast, by Type 2019 & 2032
- Table 61: Global Mayonnaise Revenue million Forecast, by Country 2019 & 2032
- Table 62: Global Mayonnaise Volume K Forecast, by Country 2019 & 2032
- Table 63: Turkey Mayonnaise Revenue (million) Forecast, by Application 2019 & 2032
- Table 64: Turkey Mayonnaise Volume (K) Forecast, by Application 2019 & 2032
- Table 65: Israel Mayonnaise Revenue (million) Forecast, by Application 2019 & 2032
- Table 66: Israel Mayonnaise Volume (K) Forecast, by Application 2019 & 2032
- Table 67: GCC Mayonnaise Revenue (million) Forecast, by Application 2019 & 2032
- Table 68: GCC Mayonnaise Volume (K) Forecast, by Application 2019 & 2032
- Table 69: North Africa Mayonnaise Revenue (million) Forecast, by Application 2019 & 2032
- Table 70: North Africa Mayonnaise Volume (K) Forecast, by Application 2019 & 2032
- Table 71: South Africa Mayonnaise Revenue (million) Forecast, by Application 2019 & 2032
- Table 72: South Africa Mayonnaise Volume (K) Forecast, by Application 2019 & 2032
- Table 73: Rest of Middle East & Africa Mayonnaise Revenue (million) Forecast, by Application 2019 & 2032
- Table 74: Rest of Middle East & Africa Mayonnaise Volume (K) Forecast, by Application 2019 & 2032
- Table 75: Global Mayonnaise Revenue million Forecast, by Application 2019 & 2032
- Table 76: Global Mayonnaise Volume K Forecast, by Application 2019 & 2032
- Table 77: Global Mayonnaise Revenue million Forecast, by Type 2019 & 2032
- Table 78: Global Mayonnaise Volume K Forecast, by Type 2019 & 2032
- Table 79: Global Mayonnaise Revenue million Forecast, by Country 2019 & 2032
- Table 80: Global Mayonnaise Volume K Forecast, by Country 2019 & 2032
- Table 81: China Mayonnaise Revenue (million) Forecast, by Application 2019 & 2032
- Table 82: China Mayonnaise Volume (K) Forecast, by Application 2019 & 2032
- Table 83: India Mayonnaise Revenue (million) Forecast, by Application 2019 & 2032
- Table 84: India Mayonnaise Volume (K) Forecast, by Application 2019 & 2032
- Table 85: Japan Mayonnaise Revenue (million) Forecast, by Application 2019 & 2032
- Table 86: Japan Mayonnaise Volume (K) Forecast, by Application 2019 & 2032
- Table 87: South Korea Mayonnaise Revenue (million) Forecast, by Application 2019 & 2032
- Table 88: South Korea Mayonnaise Volume (K) Forecast, by Application 2019 & 2032
- Table 89: ASEAN Mayonnaise Revenue (million) Forecast, by Application 2019 & 2032
- Table 90: ASEAN Mayonnaise Volume (K) Forecast, by Application 2019 & 2032
- Table 91: Oceania Mayonnaise Revenue (million) Forecast, by Application 2019 & 2032
- Table 92: Oceania Mayonnaise Volume (K) Forecast, by Application 2019 & 2032
- Table 93: Rest of Asia Pacific Mayonnaise Revenue (million) Forecast, by Application 2019 & 2032
- Table 94: Rest of Asia Pacific Mayonnaise Volume (K) Forecast, by Application 2019 & 2032
Frequently Asked Questions
1. What is the projected Compound Annual Growth Rate (CAGR) of the Mayonnaise?
The projected CAGR is approximately 4.2%.
2. Which companies are prominent players in the Mayonnaise?
Key companies in the market include Unilever Group, Kraft Heinz Co, Kewpie Corp, McCormick & Co Inc, NMZhK Gruppa Kompaniy, Essen Production AG ZAO, Efko OAO, Nestlé SA, Rusagro GK, Aceitera General Deheza SA, Nefis Group, Ajinomoto Co Inc, Foodcorp (Pty) Ltd, Cargill Inc, Oetker-Gruppe, VRB Consumer Products Pvt Ltd, Skit OOO, Agra Industrier AS, Tiger Brands Ltd, Schedro TM, Wilmar International Ltd, Agrolimen SA, Avril Group, Viktor & K PP, Bunge Ltd, Conservas La Costeña SA de CV, Lasalle Food Indonesia PT, Grupo Ybarra Alimentacion SL, WSP Spolem Kielce, Alicorp SAA, Ottogi Foods Co Ltd, Del Monte Pacific Ltd, Van Wijngaarden BV, Olis Ltd TOV, Basamh Trading Co.
3. What are the main segments of the Mayonnaise?
The market segments include Application, Type.
4. Can you provide details about the market size?
The market size is estimated to be USD 17310 million as of 2022.
5. What are some drivers contributing to market growth?
N/A
6. What are the notable trends driving market growth?
N/A
7. Are there any restraints impacting market growth?
N/A
8. Can you provide examples of recent developments in the market?
N/A
9. What pricing options are available for accessing the report?
Pricing options include single-user, multi-user, and enterprise licenses priced at USD 3950.00, USD 5925.00, and USD 7900.00 respectively.
10. Is the market size provided in terms of value or volume?
The market size is provided in terms of value, measured in million and volume, measured in K.
11. Are there any specific market keywords associated with the report?
Yes, the market keyword associated with the report is "Mayonnaise," which aids in identifying and referencing the specific market segment covered.
12. How do I determine which pricing option suits my needs best?
The pricing options vary based on user requirements and access needs. Individual users may opt for single-user licenses, while businesses requiring broader access may choose multi-user or enterprise licenses for cost-effective access to the report.
13. Are there any additional resources or data provided in the Mayonnaise report?
While the report offers comprehensive insights, it's advisable to review the specific contents or supplementary materials provided to ascertain if additional resources or data are available.
14. How can I stay updated on further developments or reports in the Mayonnaise?
To stay informed about further developments, trends, and reports in the Mayonnaise, consider subscribing to industry newsletters, following relevant companies and organizations, or regularly checking reputable industry news sources and publications.
Methodology
Step 1 - Identification of Relevant Samples Size from Population Database


Step 2 - Approaches for Defining Global Market Size (Value, Volume* & Price*)

Note*: In applicable scenarios
Step 3 - Data Sources
Primary Research
- Web Analytics
- Survey Reports
- Research Institute
- Latest Research Reports
- Opinion Leaders
Secondary Research
- Annual Reports
- White Paper
- Latest Press Release
- Industry Association
- Paid Database
- Investor Presentations

Step 4 - Data Triangulation
Involves using different sources of information in order to increase the validity of a study
These sources are likely to be stakeholders in a program - participants, other researchers, program staff, other community members, and so on.
Then we put all data in single framework & apply various statistical tools to find out the dynamic on the market.
During the analysis stage, feedback from the stakeholder groups would be compared to determine areas of agreement as well as areas of divergence


