
Key Insights
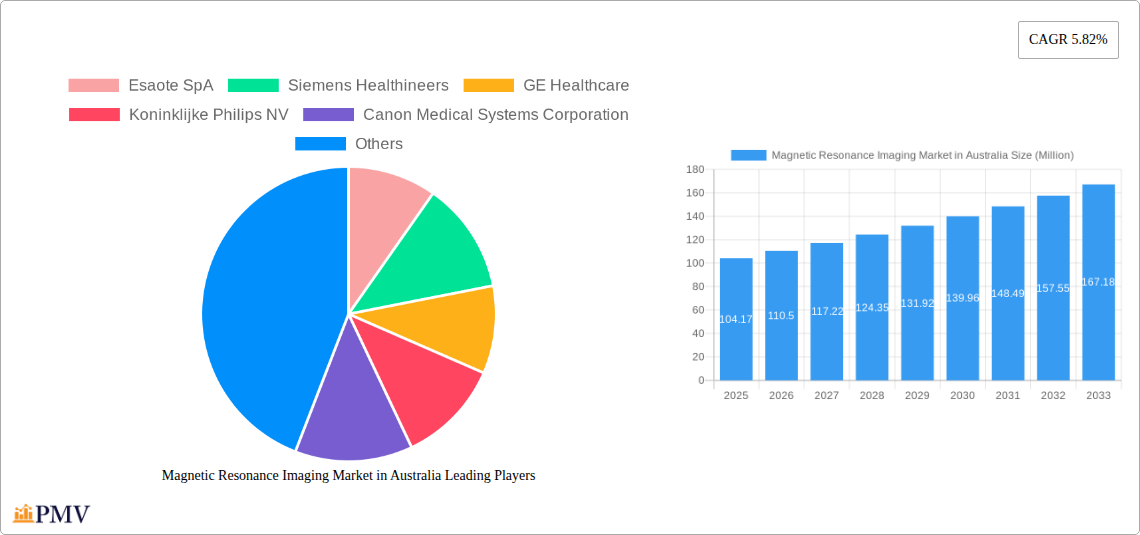
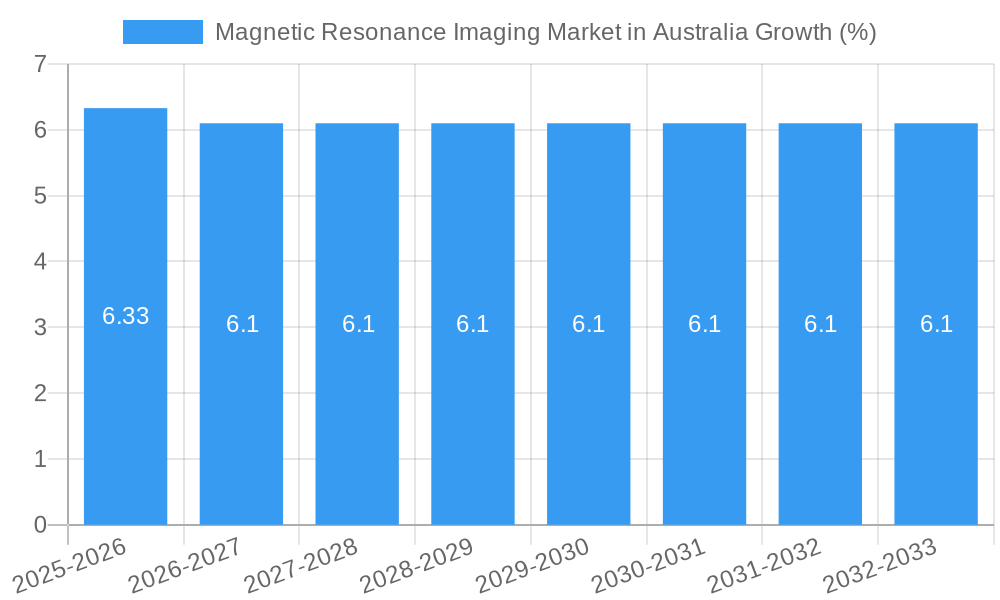
The Australian Magnetic Resonance Imaging (MRI) market, valued at approximately $104.17 million in 2025, is projected to experience robust growth, driven by a rising prevalence of chronic diseases necessitating advanced diagnostic tools and increasing government healthcare expenditure. Technological advancements, such as the development of higher-field strength MRI systems (including very high and ultra-high field systems) offering improved image quality and diagnostic capabilities, are key market drivers. Furthermore, the growing adoption of open MRI systems to enhance patient comfort and reduce claustrophobia contributes to market expansion. While the market faces constraints such as high equipment costs and limited reimbursement policies in some sectors, the increasing demand for accurate and early diagnoses is expected to offset these challenges. Market segmentation reveals a significant share held by high-field MRI systems due to their superior image resolution, while oncology and neurology applications dominate in terms of therapeutic applications. Leading players like Siemens Healthineers, GE Healthcare, and Philips are strategically investing in technological innovation and expanding their service networks to maintain their market leadership. The consistent CAGR of 5.82% from 2019-2033 reflects a healthy growth trajectory with strong future prospects.
The forecast period (2025-2033) anticipates sustained growth fueled by technological improvements in MRI technology and applications, alongside the increasing geriatric population necessitating increased diagnostic imaging. Specific growth within segments will likely be influenced by factors such as technological advancements in specific applications (e.g., advanced neuroimaging techniques), government initiatives supporting healthcare infrastructure, and the evolution of reimbursement policies. The continued expansion of private healthcare providers could also contribute significantly to market growth. Competition among key players will remain intense, driving innovation and potentially resulting in price adjustments and enhanced service offerings. The Australian MRI market’s future success hinges on balancing the need for advanced technology with affordability and accessibility.
This in-depth report provides a comprehensive analysis of the Magnetic Resonance Imaging (MRI) market in Australia, offering valuable insights into market size, growth drivers, competitive landscape, and future trends. The study period covers 2019-2033, with 2025 as the base year and a forecast period of 2025-2033. This report is essential for stakeholders, investors, and industry professionals seeking to understand and capitalize on the opportunities within this dynamic market. The Australian MRI market is projected to reach xx Million by 2033, exhibiting a CAGR of xx% during the forecast period.
Magnetic Resonance Imaging Market in Australia Market Structure & Competitive Dynamics
The Australian MRI market exhibits a moderately concentrated structure, with key players holding significant market share. The market is characterized by intense competition driven by technological advancements, regulatory changes, and evolving end-user preferences. Innovation ecosystems are thriving, with collaborations between leading MRI manufacturers, research institutions, and healthcare providers fostering the development of advanced imaging technologies. The regulatory framework, primarily governed by the Therapeutic Goods Administration (TGA), plays a crucial role in shaping market access and product approvals. Product substitutes, such as Computed Tomography (CT) scans, pose a competitive challenge, necessitating continuous innovation to maintain market dominance. M&A activity has been relatively moderate in recent years, with deal values totaling approximately xx Million in the past five years.
- Market Concentration: The top five players account for approximately xx% of the market share.
- Innovation Ecosystems: Strong collaborations exist between manufacturers and research institutions.
- Regulatory Framework: TGA regulations influence market entry and product approvals.
- Product Substitutes: CT scans and other imaging modalities present competitive pressures.
- End-User Trends: Increasing demand for advanced imaging technologies across various applications.
- M&A Activity: Recent M&A deals have focused on enhancing product portfolios and geographical reach. Average deal value: xx Million.
Magnetic Resonance Imaging Market in Australia Industry Trends & Insights
The Australian MRI market is experiencing significant growth driven by several factors. Technological advancements, particularly in high-field and ultra-high-field MRI systems, are enhancing image quality and diagnostic capabilities. This leads to increased demand from healthcare providers seeking to improve patient care and treatment outcomes. The rising prevalence of chronic diseases, such as cancer and neurological disorders, fuels the need for advanced diagnostic tools. Government initiatives promoting healthcare infrastructure development and technological upgrades further contribute to market expansion. However, the high cost of MRI systems and the associated operational expenses pose a challenge to market penetration. Consumer preferences are shifting toward faster, more comfortable, and less claustrophobic MRI experiences, driving demand for open MRI systems and innovative technologies like artificial intelligence-powered image analysis.
Dominant Markets & Segments in Magnetic Resonance Imaging Market in Australia
Architecture: Closed MRI systems currently dominate the market due to their superior image quality and widespread availability. However, open MRI systems are experiencing increased adoption, particularly in applications requiring patient comfort or ease of access.
Field Strength: High-field MRI systems (1.5T and 3T) remain the most prevalent, offering a balance between image quality and cost. Very high-field and ultra-high-field systems are gaining traction for specialized applications, driven by advancements in technology and increased funding for research.
Application: Oncology and Neurology are the leading application segments, driven by high prevalence of related diseases and increasing adoption of advanced MRI techniques for early detection and diagnosis. Musculoskeletal applications are also growing significantly due to the aging population.
- Key Drivers for Oncology Segment: Rising cancer incidence, government funding for cancer research and treatment.
- Key Drivers for Neurology Segment: Increased prevalence of neurological disorders (e.g., stroke, Alzheimer's disease), demand for early diagnosis and intervention.
- Key Drivers for Musculoskeletal Segment: Aging population, increasing incidence of musculoskeletal injuries and conditions.
Magnetic Resonance Imaging Market in Australia Product Innovations
Recent product innovations focus on enhancing image quality, reducing scan times, improving patient comfort, and expanding applications. Manufacturers are incorporating advanced technologies like artificial intelligence (AI) and machine learning (ML) for automated image analysis, improving diagnostic accuracy and workflow efficiency. The development of intraoperative MRI systems, such as the Philips Ingenia MR-OR, signifies a significant advancement, enabling real-time imaging during surgical procedures. This reduces surgical times and enhances patient outcomes.
Report Segmentation & Scope
This report segments the Australian MRI market based on architecture (closed vs. open), field strength (low, high, very high, ultra-high), and application (oncology, neurology, cardiology, gastroenterology, musculoskeletal, other). Growth projections are provided for each segment, reflecting market size, competitive intensity, and projected adoption rates.
Key Drivers of Magnetic Resonance Imaging Market in Australia Growth
The Australian MRI market's growth is propelled by several key drivers: rising prevalence of chronic diseases, government initiatives supporting healthcare infrastructure upgrades, technological advancements (such as AI integration and improved image quality), and increasing demand for advanced diagnostic capabilities in healthcare facilities. These drivers create a positive outlook for the sector.
Challenges in the Magnetic Resonance Imaging Market in Australia Sector
Challenges include the high cost of MRI systems, stringent regulatory approvals, competition from other imaging modalities, and the need for skilled personnel to operate and interpret MRI scans. Supply chain disruptions and workforce shortages can also impact market growth. These factors can limit market penetration and profitability.
Leading Players in the Magnetic Resonance Imaging Market in Australia Market
- Esaote SpA
- Siemens Healthineers
- GE Healthcare
- Koninklijke Philips NV
- Canon Medical Systems Corporation
- Sonologic Inc
- United Imaging Healthcare Co Ltd
- Fujifilm Holdings Corporation
Key Developments in Magnetic Resonance Imaging Market in Australia Sector
- March 2022: Siemens MRI scanner installed at North Eastern Community Hospital in South Australia.
- April 2021: Philips installed cutting-edge digital imaging technologies at Westmead Hospital in Sydney. First Philips Ingenia MR-OR intraoperative devices installed in Australia and New Zealand.
Strategic Magnetic Resonance Imaging Market in Australia Market Outlook
The Australian MRI market is poised for continued growth, driven by technological innovations, increasing healthcare expenditure, and a growing need for advanced diagnostic solutions. Strategic opportunities exist for manufacturers to focus on developing cost-effective, patient-friendly MRI systems and integrating AI capabilities to improve workflow efficiency and diagnostic accuracy. Expansion into underserved regional areas and strategic partnerships with healthcare providers will also be critical for success.
Magnetic Resonance Imaging Market in Australia Segmentation
-
1. Architecture
- 1.1. Closed MRI Systems
- 1.2. Open MRI Systems
-
2. Field Strength
- 2.1. Low Field MRI Systems
- 2.2. High Field MRI Systems
- 2.3. Very Hig
-
3. Application
- 3.1. Oncology
- 3.2. Neurology
- 3.3. Cardiology
- 3.4. Gastroenterology
- 3.5. Musculoskeletal
- 3.6. Other Applications
Magnetic Resonance Imaging Market in Australia Segmentation By Geography
-
1. North America
- 1.1. United States
- 1.2. Canada
- 1.3. Mexico
-
2. South America
- 2.1. Brazil
- 2.2. Argentina
- 2.3. Rest of South America
-
3. Europe
- 3.1. United Kingdom
- 3.2. Germany
- 3.3. France
- 3.4. Italy
- 3.5. Spain
- 3.6. Russia
- 3.7. Benelux
- 3.8. Nordics
- 3.9. Rest of Europe
-
4. Middle East & Africa
- 4.1. Turkey
- 4.2. Israel
- 4.3. GCC
- 4.4. North Africa
- 4.5. South Africa
- 4.6. Rest of Middle East & Africa
-
5. Asia Pacific
- 5.1. China
- 5.2. India
- 5.3. Japan
- 5.4. South Korea
- 5.5. ASEAN
- 5.6. Oceania
- 5.7. Rest of Asia Pacific
Magnetic Resonance Imaging Market in Australia REPORT HIGHLIGHTS
| Aspects | Details |
|---|---|
| Study Period | 2019-2033 |
| Base Year | 2024 |
| Estimated Year | 2025 |
| Forecast Period | 2025-2033 |
| Historical Period | 2019-2024 |
| Growth Rate | CAGR of 5.82% from 2019-2033 |
| Segmentation |
|
Table of Contents
- 1. Introduction
- 1.1. Research Scope
- 1.2. Market Segmentation
- 1.3. Research Methodology
- 1.4. Definitions and Assumptions
- 2. Executive Summary
- 2.1. Introduction
- 3. Market Dynamics
- 3.1. Introduction
- 3.2. Market Drivers
- 3.2.1. Introduction of Hybrid MRI Systems; Availability of Universal Health Coverage
- 3.3. Market Restrains
- 3.3.1. High Cost of MRI Systems
- 3.4. Market Trends
- 3.4.1. Neurology is Expected to Witness Steady Growth Over the Forecast Period
- 4. Market Factor Analysis
- 4.1. Porters Five Forces
- 4.2. Supply/Value Chain
- 4.3. PESTEL analysis
- 4.4. Market Entropy
- 4.5. Patent/Trademark Analysis
- 5. Global Magnetic Resonance Imaging Market in Australia Analysis, Insights and Forecast, 2019-2031
- 5.1. Market Analysis, Insights and Forecast - by Architecture
- 5.1.1. Closed MRI Systems
- 5.1.2. Open MRI Systems
- 5.2. Market Analysis, Insights and Forecast - by Field Strength
- 5.2.1. Low Field MRI Systems
- 5.2.2. High Field MRI Systems
- 5.2.3. Very Hig
- 5.3. Market Analysis, Insights and Forecast - by Application
- 5.3.1. Oncology
- 5.3.2. Neurology
- 5.3.3. Cardiology
- 5.3.4. Gastroenterology
- 5.3.5. Musculoskeletal
- 5.3.6. Other Applications
- 5.4. Market Analysis, Insights and Forecast - by Region
- 5.4.1. North America
- 5.4.2. South America
- 5.4.3. Europe
- 5.4.4. Middle East & Africa
- 5.4.5. Asia Pacific
- 5.1. Market Analysis, Insights and Forecast - by Architecture
- 6. North America Magnetic Resonance Imaging Market in Australia Analysis, Insights and Forecast, 2019-2031
- 6.1. Market Analysis, Insights and Forecast - by Architecture
- 6.1.1. Closed MRI Systems
- 6.1.2. Open MRI Systems
- 6.2. Market Analysis, Insights and Forecast - by Field Strength
- 6.2.1. Low Field MRI Systems
- 6.2.2. High Field MRI Systems
- 6.2.3. Very Hig
- 6.3. Market Analysis, Insights and Forecast - by Application
- 6.3.1. Oncology
- 6.3.2. Neurology
- 6.3.3. Cardiology
- 6.3.4. Gastroenterology
- 6.3.5. Musculoskeletal
- 6.3.6. Other Applications
- 6.1. Market Analysis, Insights and Forecast - by Architecture
- 7. South America Magnetic Resonance Imaging Market in Australia Analysis, Insights and Forecast, 2019-2031
- 7.1. Market Analysis, Insights and Forecast - by Architecture
- 7.1.1. Closed MRI Systems
- 7.1.2. Open MRI Systems
- 7.2. Market Analysis, Insights and Forecast - by Field Strength
- 7.2.1. Low Field MRI Systems
- 7.2.2. High Field MRI Systems
- 7.2.3. Very Hig
- 7.3. Market Analysis, Insights and Forecast - by Application
- 7.3.1. Oncology
- 7.3.2. Neurology
- 7.3.3. Cardiology
- 7.3.4. Gastroenterology
- 7.3.5. Musculoskeletal
- 7.3.6. Other Applications
- 7.1. Market Analysis, Insights and Forecast - by Architecture
- 8. Europe Magnetic Resonance Imaging Market in Australia Analysis, Insights and Forecast, 2019-2031
- 8.1. Market Analysis, Insights and Forecast - by Architecture
- 8.1.1. Closed MRI Systems
- 8.1.2. Open MRI Systems
- 8.2. Market Analysis, Insights and Forecast - by Field Strength
- 8.2.1. Low Field MRI Systems
- 8.2.2. High Field MRI Systems
- 8.2.3. Very Hig
- 8.3. Market Analysis, Insights and Forecast - by Application
- 8.3.1. Oncology
- 8.3.2. Neurology
- 8.3.3. Cardiology
- 8.3.4. Gastroenterology
- 8.3.5. Musculoskeletal
- 8.3.6. Other Applications
- 8.1. Market Analysis, Insights and Forecast - by Architecture
- 9. Middle East & Africa Magnetic Resonance Imaging Market in Australia Analysis, Insights and Forecast, 2019-2031
- 9.1. Market Analysis, Insights and Forecast - by Architecture
- 9.1.1. Closed MRI Systems
- 9.1.2. Open MRI Systems
- 9.2. Market Analysis, Insights and Forecast - by Field Strength
- 9.2.1. Low Field MRI Systems
- 9.2.2. High Field MRI Systems
- 9.2.3. Very Hig
- 9.3. Market Analysis, Insights and Forecast - by Application
- 9.3.1. Oncology
- 9.3.2. Neurology
- 9.3.3. Cardiology
- 9.3.4. Gastroenterology
- 9.3.5. Musculoskeletal
- 9.3.6. Other Applications
- 9.1. Market Analysis, Insights and Forecast - by Architecture
- 10. Asia Pacific Magnetic Resonance Imaging Market in Australia Analysis, Insights and Forecast, 2019-2031
- 10.1. Market Analysis, Insights and Forecast - by Architecture
- 10.1.1. Closed MRI Systems
- 10.1.2. Open MRI Systems
- 10.2. Market Analysis, Insights and Forecast - by Field Strength
- 10.2.1. Low Field MRI Systems
- 10.2.2. High Field MRI Systems
- 10.2.3. Very Hig
- 10.3. Market Analysis, Insights and Forecast - by Application
- 10.3.1. Oncology
- 10.3.2. Neurology
- 10.3.3. Cardiology
- 10.3.4. Gastroenterology
- 10.3.5. Musculoskeletal
- 10.3.6. Other Applications
- 10.1. Market Analysis, Insights and Forecast - by Architecture
- 11. Competitive Analysis
- 11.1. Global Market Share Analysis 2024
- 11.2. Company Profiles
- 11.2.1 Esaote SpA
- 11.2.1.1. Overview
- 11.2.1.2. Products
- 11.2.1.3. SWOT Analysis
- 11.2.1.4. Recent Developments
- 11.2.1.5. Financials (Based on Availability)
- 11.2.2 Siemens Healthineers
- 11.2.2.1. Overview
- 11.2.2.2. Products
- 11.2.2.3. SWOT Analysis
- 11.2.2.4. Recent Developments
- 11.2.2.5. Financials (Based on Availability)
- 11.2.3 GE Healthcare
- 11.2.3.1. Overview
- 11.2.3.2. Products
- 11.2.3.3. SWOT Analysis
- 11.2.3.4. Recent Developments
- 11.2.3.5. Financials (Based on Availability)
- 11.2.4 Koninklijke Philips NV
- 11.2.4.1. Overview
- 11.2.4.2. Products
- 11.2.4.3. SWOT Analysis
- 11.2.4.4. Recent Developments
- 11.2.4.5. Financials (Based on Availability)
- 11.2.5 Canon Medical Systems Corporation
- 11.2.5.1. Overview
- 11.2.5.2. Products
- 11.2.5.3. SWOT Analysis
- 11.2.5.4. Recent Developments
- 11.2.5.5. Financials (Based on Availability)
- 11.2.6 Sonologic Inc
- 11.2.6.1. Overview
- 11.2.6.2. Products
- 11.2.6.3. SWOT Analysis
- 11.2.6.4. Recent Developments
- 11.2.6.5. Financials (Based on Availability)
- 11.2.7 United Imaging Healthcare Co Ltd
- 11.2.7.1. Overview
- 11.2.7.2. Products
- 11.2.7.3. SWOT Analysis
- 11.2.7.4. Recent Developments
- 11.2.7.5. Financials (Based on Availability)
- 11.2.8 Fujifilm Holdings Corporation
- 11.2.8.1. Overview
- 11.2.8.2. Products
- 11.2.8.3. SWOT Analysis
- 11.2.8.4. Recent Developments
- 11.2.8.5. Financials (Based on Availability)
- 11.2.1 Esaote SpA
List of Figures
- Figure 1: Global Magnetic Resonance Imaging Market in Australia Revenue Breakdown (Million, %) by Region 2024 & 2032
- Figure 2: Australia Magnetic Resonance Imaging Market in Australia Revenue (Million), by Country 2024 & 2032
- Figure 3: Australia Magnetic Resonance Imaging Market in Australia Revenue Share (%), by Country 2024 & 2032
- Figure 4: North America Magnetic Resonance Imaging Market in Australia Revenue (Million), by Architecture 2024 & 2032
- Figure 5: North America Magnetic Resonance Imaging Market in Australia Revenue Share (%), by Architecture 2024 & 2032
- Figure 6: North America Magnetic Resonance Imaging Market in Australia Revenue (Million), by Field Strength 2024 & 2032
- Figure 7: North America Magnetic Resonance Imaging Market in Australia Revenue Share (%), by Field Strength 2024 & 2032
- Figure 8: North America Magnetic Resonance Imaging Market in Australia Revenue (Million), by Application 2024 & 2032
- Figure 9: North America Magnetic Resonance Imaging Market in Australia Revenue Share (%), by Application 2024 & 2032
- Figure 10: North America Magnetic Resonance Imaging Market in Australia Revenue (Million), by Country 2024 & 2032
- Figure 11: North America Magnetic Resonance Imaging Market in Australia Revenue Share (%), by Country 2024 & 2032
- Figure 12: South America Magnetic Resonance Imaging Market in Australia Revenue (Million), by Architecture 2024 & 2032
- Figure 13: South America Magnetic Resonance Imaging Market in Australia Revenue Share (%), by Architecture 2024 & 2032
- Figure 14: South America Magnetic Resonance Imaging Market in Australia Revenue (Million), by Field Strength 2024 & 2032
- Figure 15: South America Magnetic Resonance Imaging Market in Australia Revenue Share (%), by Field Strength 2024 & 2032
- Figure 16: South America Magnetic Resonance Imaging Market in Australia Revenue (Million), by Application 2024 & 2032
- Figure 17: South America Magnetic Resonance Imaging Market in Australia Revenue Share (%), by Application 2024 & 2032
- Figure 18: South America Magnetic Resonance Imaging Market in Australia Revenue (Million), by Country 2024 & 2032
- Figure 19: South America Magnetic Resonance Imaging Market in Australia Revenue Share (%), by Country 2024 & 2032
- Figure 20: Europe Magnetic Resonance Imaging Market in Australia Revenue (Million), by Architecture 2024 & 2032
- Figure 21: Europe Magnetic Resonance Imaging Market in Australia Revenue Share (%), by Architecture 2024 & 2032
- Figure 22: Europe Magnetic Resonance Imaging Market in Australia Revenue (Million), by Field Strength 2024 & 2032
- Figure 23: Europe Magnetic Resonance Imaging Market in Australia Revenue Share (%), by Field Strength 2024 & 2032
- Figure 24: Europe Magnetic Resonance Imaging Market in Australia Revenue (Million), by Application 2024 & 2032
- Figure 25: Europe Magnetic Resonance Imaging Market in Australia Revenue Share (%), by Application 2024 & 2032
- Figure 26: Europe Magnetic Resonance Imaging Market in Australia Revenue (Million), by Country 2024 & 2032
- Figure 27: Europe Magnetic Resonance Imaging Market in Australia Revenue Share (%), by Country 2024 & 2032
- Figure 28: Middle East & Africa Magnetic Resonance Imaging Market in Australia Revenue (Million), by Architecture 2024 & 2032
- Figure 29: Middle East & Africa Magnetic Resonance Imaging Market in Australia Revenue Share (%), by Architecture 2024 & 2032
- Figure 30: Middle East & Africa Magnetic Resonance Imaging Market in Australia Revenue (Million), by Field Strength 2024 & 2032
- Figure 31: Middle East & Africa Magnetic Resonance Imaging Market in Australia Revenue Share (%), by Field Strength 2024 & 2032
- Figure 32: Middle East & Africa Magnetic Resonance Imaging Market in Australia Revenue (Million), by Application 2024 & 2032
- Figure 33: Middle East & Africa Magnetic Resonance Imaging Market in Australia Revenue Share (%), by Application 2024 & 2032
- Figure 34: Middle East & Africa Magnetic Resonance Imaging Market in Australia Revenue (Million), by Country 2024 & 2032
- Figure 35: Middle East & Africa Magnetic Resonance Imaging Market in Australia Revenue Share (%), by Country 2024 & 2032
- Figure 36: Asia Pacific Magnetic Resonance Imaging Market in Australia Revenue (Million), by Architecture 2024 & 2032
- Figure 37: Asia Pacific Magnetic Resonance Imaging Market in Australia Revenue Share (%), by Architecture 2024 & 2032
- Figure 38: Asia Pacific Magnetic Resonance Imaging Market in Australia Revenue (Million), by Field Strength 2024 & 2032
- Figure 39: Asia Pacific Magnetic Resonance Imaging Market in Australia Revenue Share (%), by Field Strength 2024 & 2032
- Figure 40: Asia Pacific Magnetic Resonance Imaging Market in Australia Revenue (Million), by Application 2024 & 2032
- Figure 41: Asia Pacific Magnetic Resonance Imaging Market in Australia Revenue Share (%), by Application 2024 & 2032
- Figure 42: Asia Pacific Magnetic Resonance Imaging Market in Australia Revenue (Million), by Country 2024 & 2032
- Figure 43: Asia Pacific Magnetic Resonance Imaging Market in Australia Revenue Share (%), by Country 2024 & 2032
List of Tables
- Table 1: Global Magnetic Resonance Imaging Market in Australia Revenue Million Forecast, by Region 2019 & 2032
- Table 2: Global Magnetic Resonance Imaging Market in Australia Revenue Million Forecast, by Architecture 2019 & 2032
- Table 3: Global Magnetic Resonance Imaging Market in Australia Revenue Million Forecast, by Field Strength 2019 & 2032
- Table 4: Global Magnetic Resonance Imaging Market in Australia Revenue Million Forecast, by Application 2019 & 2032
- Table 5: Global Magnetic Resonance Imaging Market in Australia Revenue Million Forecast, by Region 2019 & 2032
- Table 6: Global Magnetic Resonance Imaging Market in Australia Revenue Million Forecast, by Country 2019 & 2032
- Table 7: Global Magnetic Resonance Imaging Market in Australia Revenue Million Forecast, by Architecture 2019 & 2032
- Table 8: Global Magnetic Resonance Imaging Market in Australia Revenue Million Forecast, by Field Strength 2019 & 2032
- Table 9: Global Magnetic Resonance Imaging Market in Australia Revenue Million Forecast, by Application 2019 & 2032
- Table 10: Global Magnetic Resonance Imaging Market in Australia Revenue Million Forecast, by Country 2019 & 2032
- Table 11: United States Magnetic Resonance Imaging Market in Australia Revenue (Million) Forecast, by Application 2019 & 2032
- Table 12: Canada Magnetic Resonance Imaging Market in Australia Revenue (Million) Forecast, by Application 2019 & 2032
- Table 13: Mexico Magnetic Resonance Imaging Market in Australia Revenue (Million) Forecast, by Application 2019 & 2032
- Table 14: Global Magnetic Resonance Imaging Market in Australia Revenue Million Forecast, by Architecture 2019 & 2032
- Table 15: Global Magnetic Resonance Imaging Market in Australia Revenue Million Forecast, by Field Strength 2019 & 2032
- Table 16: Global Magnetic Resonance Imaging Market in Australia Revenue Million Forecast, by Application 2019 & 2032
- Table 17: Global Magnetic Resonance Imaging Market in Australia Revenue Million Forecast, by Country 2019 & 2032
- Table 18: Brazil Magnetic Resonance Imaging Market in Australia Revenue (Million) Forecast, by Application 2019 & 2032
- Table 19: Argentina Magnetic Resonance Imaging Market in Australia Revenue (Million) Forecast, by Application 2019 & 2032
- Table 20: Rest of South America Magnetic Resonance Imaging Market in Australia Revenue (Million) Forecast, by Application 2019 & 2032
- Table 21: Global Magnetic Resonance Imaging Market in Australia Revenue Million Forecast, by Architecture 2019 & 2032
- Table 22: Global Magnetic Resonance Imaging Market in Australia Revenue Million Forecast, by Field Strength 2019 & 2032
- Table 23: Global Magnetic Resonance Imaging Market in Australia Revenue Million Forecast, by Application 2019 & 2032
- Table 24: Global Magnetic Resonance Imaging Market in Australia Revenue Million Forecast, by Country 2019 & 2032
- Table 25: United Kingdom Magnetic Resonance Imaging Market in Australia Revenue (Million) Forecast, by Application 2019 & 2032
- Table 26: Germany Magnetic Resonance Imaging Market in Australia Revenue (Million) Forecast, by Application 2019 & 2032
- Table 27: France Magnetic Resonance Imaging Market in Australia Revenue (Million) Forecast, by Application 2019 & 2032
- Table 28: Italy Magnetic Resonance Imaging Market in Australia Revenue (Million) Forecast, by Application 2019 & 2032
- Table 29: Spain Magnetic Resonance Imaging Market in Australia Revenue (Million) Forecast, by Application 2019 & 2032
- Table 30: Russia Magnetic Resonance Imaging Market in Australia Revenue (Million) Forecast, by Application 2019 & 2032
- Table 31: Benelux Magnetic Resonance Imaging Market in Australia Revenue (Million) Forecast, by Application 2019 & 2032
- Table 32: Nordics Magnetic Resonance Imaging Market in Australia Revenue (Million) Forecast, by Application 2019 & 2032
- Table 33: Rest of Europe Magnetic Resonance Imaging Market in Australia Revenue (Million) Forecast, by Application 2019 & 2032
- Table 34: Global Magnetic Resonance Imaging Market in Australia Revenue Million Forecast, by Architecture 2019 & 2032
- Table 35: Global Magnetic Resonance Imaging Market in Australia Revenue Million Forecast, by Field Strength 2019 & 2032
- Table 36: Global Magnetic Resonance Imaging Market in Australia Revenue Million Forecast, by Application 2019 & 2032
- Table 37: Global Magnetic Resonance Imaging Market in Australia Revenue Million Forecast, by Country 2019 & 2032
- Table 38: Turkey Magnetic Resonance Imaging Market in Australia Revenue (Million) Forecast, by Application 2019 & 2032
- Table 39: Israel Magnetic Resonance Imaging Market in Australia Revenue (Million) Forecast, by Application 2019 & 2032
- Table 40: GCC Magnetic Resonance Imaging Market in Australia Revenue (Million) Forecast, by Application 2019 & 2032
- Table 41: North Africa Magnetic Resonance Imaging Market in Australia Revenue (Million) Forecast, by Application 2019 & 2032
- Table 42: South Africa Magnetic Resonance Imaging Market in Australia Revenue (Million) Forecast, by Application 2019 & 2032
- Table 43: Rest of Middle East & Africa Magnetic Resonance Imaging Market in Australia Revenue (Million) Forecast, by Application 2019 & 2032
- Table 44: Global Magnetic Resonance Imaging Market in Australia Revenue Million Forecast, by Architecture 2019 & 2032
- Table 45: Global Magnetic Resonance Imaging Market in Australia Revenue Million Forecast, by Field Strength 2019 & 2032
- Table 46: Global Magnetic Resonance Imaging Market in Australia Revenue Million Forecast, by Application 2019 & 2032
- Table 47: Global Magnetic Resonance Imaging Market in Australia Revenue Million Forecast, by Country 2019 & 2032
- Table 48: China Magnetic Resonance Imaging Market in Australia Revenue (Million) Forecast, by Application 2019 & 2032
- Table 49: India Magnetic Resonance Imaging Market in Australia Revenue (Million) Forecast, by Application 2019 & 2032
- Table 50: Japan Magnetic Resonance Imaging Market in Australia Revenue (Million) Forecast, by Application 2019 & 2032
- Table 51: South Korea Magnetic Resonance Imaging Market in Australia Revenue (Million) Forecast, by Application 2019 & 2032
- Table 52: ASEAN Magnetic Resonance Imaging Market in Australia Revenue (Million) Forecast, by Application 2019 & 2032
- Table 53: Oceania Magnetic Resonance Imaging Market in Australia Revenue (Million) Forecast, by Application 2019 & 2032
- Table 54: Rest of Asia Pacific Magnetic Resonance Imaging Market in Australia Revenue (Million) Forecast, by Application 2019 & 2032
Frequently Asked Questions
1. What is the projected Compound Annual Growth Rate (CAGR) of the Magnetic Resonance Imaging Market in Australia?
The projected CAGR is approximately 5.82%.
2. Which companies are prominent players in the Magnetic Resonance Imaging Market in Australia?
Key companies in the market include Esaote SpA, Siemens Healthineers, GE Healthcare, Koninklijke Philips NV, Canon Medical Systems Corporation, Sonologic Inc, United Imaging Healthcare Co Ltd, Fujifilm Holdings Corporation.
3. What are the main segments of the Magnetic Resonance Imaging Market in Australia?
The market segments include Architecture, Field Strength, Application.
4. Can you provide details about the market size?
The market size is estimated to be USD 104.17 Million as of 2022.
5. What are some drivers contributing to market growth?
Introduction of Hybrid MRI Systems; Availability of Universal Health Coverage.
6. What are the notable trends driving market growth?
Neurology is Expected to Witness Steady Growth Over the Forecast Period.
7. Are there any restraints impacting market growth?
High Cost of MRI Systems.
8. Can you provide examples of recent developments in the market?
In March 2022, Siemens MRI Scanner was installed at North Eastern Community Hospital in the Benson Radiology department in South Australia.
9. What pricing options are available for accessing the report?
Pricing options include single-user, multi-user, and enterprise licenses priced at USD 3800, USD 4500, and USD 5800 respectively.
10. Is the market size provided in terms of value or volume?
The market size is provided in terms of value, measured in Million.
11. Are there any specific market keywords associated with the report?
Yes, the market keyword associated with the report is "Magnetic Resonance Imaging Market in Australia," which aids in identifying and referencing the specific market segment covered.
12. How do I determine which pricing option suits my needs best?
The pricing options vary based on user requirements and access needs. Individual users may opt for single-user licenses, while businesses requiring broader access may choose multi-user or enterprise licenses for cost-effective access to the report.
13. Are there any additional resources or data provided in the Magnetic Resonance Imaging Market in Australia report?
While the report offers comprehensive insights, it's advisable to review the specific contents or supplementary materials provided to ascertain if additional resources or data are available.
14. How can I stay updated on further developments or reports in the Magnetic Resonance Imaging Market in Australia?
To stay informed about further developments, trends, and reports in the Magnetic Resonance Imaging Market in Australia, consider subscribing to industry newsletters, following relevant companies and organizations, or regularly checking reputable industry news sources and publications.
Methodology
Step 1 - Identification of Relevant Samples Size from Population Database


Step 2 - Approaches for Defining Global Market Size (Value, Volume* & Price*)

Note*: In applicable scenarios
Step 3 - Data Sources
Primary Research
- Web Analytics
- Survey Reports
- Research Institute
- Latest Research Reports
- Opinion Leaders
Secondary Research
- Annual Reports
- White Paper
- Latest Press Release
- Industry Association
- Paid Database
- Investor Presentations

Step 4 - Data Triangulation
Involves using different sources of information in order to increase the validity of a study
These sources are likely to be stakeholders in a program - participants, other researchers, program staff, other community members, and so on.
Then we put all data in single framework & apply various statistical tools to find out the dynamic on the market.
During the analysis stage, feedback from the stakeholder groups would be compared to determine areas of agreement as well as areas of divergence


