


Key Insights
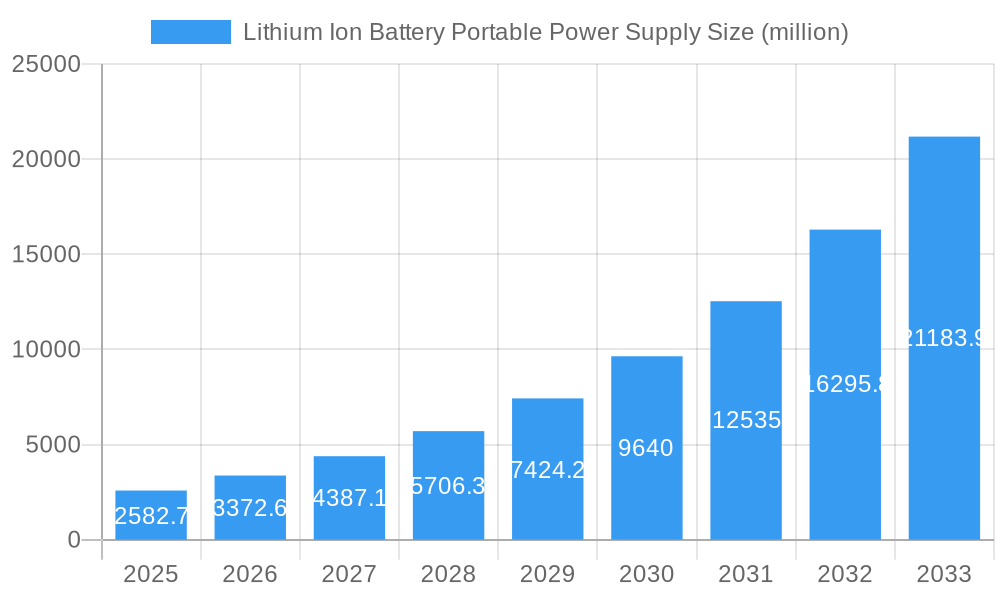
The global market for lithium-ion battery portable power supplies is experiencing robust growth, projected to reach \$2582.7 million in 2025 and maintain a Compound Annual Growth Rate (CAGR) of 30.7% from 2025 to 2033. This expansion is driven by several key factors. The increasing demand for reliable backup power during natural disasters and power outages fuels market growth, particularly in regions prone to such events. Furthermore, the rise of outdoor recreational activities, such as camping and hiking, has significantly boosted the adoption of portable power solutions. Technological advancements leading to increased capacity, improved efficiency, and smaller form factors are also contributing to market expansion. The diverse applications across various sectors, including consumer electronics, emergency preparedness, and professional use (e.g., filmmaking, construction), further broaden the market appeal. The market is segmented by capacity (below 500Wh, 500-1000Wh, 1000-2000Wh, above 2000Wh) and sales channels (online and offline), reflecting varying consumer needs and purchasing preferences. Major players like EcoFlow, Anker, and Jackery are driving innovation and competition, contributing to the market's dynamic nature.
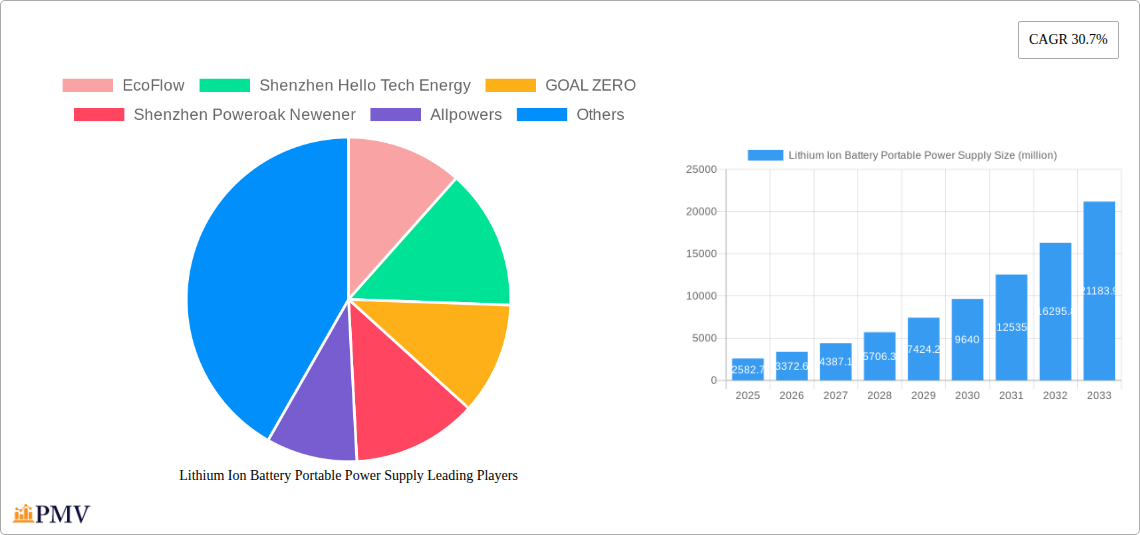
Lithium Ion Battery Portable Power Supply Market Size (In Billion)

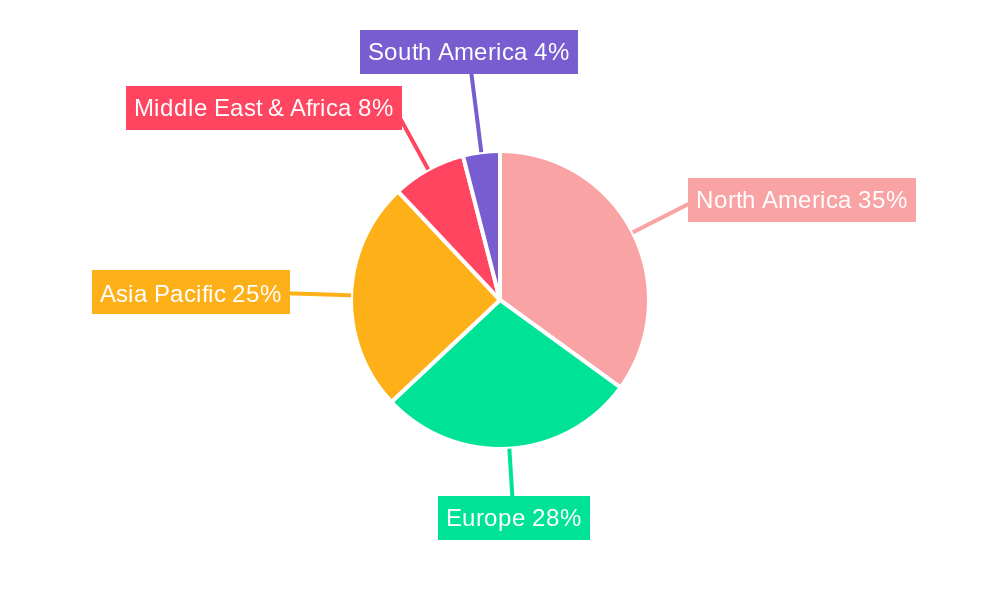
The market's geographical distribution showcases strong growth across various regions. North America and Europe currently hold significant market share, driven by high consumer spending and early adoption of portable power solutions. However, the Asia-Pacific region is expected to witness remarkable growth in the coming years due to increasing urbanization, rising disposable incomes, and expanding infrastructure projects. The increasing focus on sustainable energy solutions and the growing awareness of environmental concerns also contribute to the market's upward trajectory. While challenges such as raw material price fluctuations and potential safety concerns exist, the overall market outlook remains positive, promising significant growth opportunities for existing and new market entrants throughout the forecast period.
Lithium Ion Battery Portable Power Supply Company Market Share
This comprehensive report provides an in-depth analysis of the global Lithium Ion Battery Portable Power Supply market, covering the period from 2019 to 2033. It offers actionable insights into market structure, competitive dynamics, industry trends, and future growth potential, enabling businesses to make informed strategic decisions. The report includes detailed segmentation by application (Offline Sales, Online Sales) and capacity (Below 500Wh, 500-1000Wh, 1000-2000Wh, Above 2000Wh), with a focus on key players like EcoFlow, Anker, and GOAL ZERO. The base year for this analysis is 2025, with an estimated year of 2025 and a forecast period spanning 2025-2033. The historical period analyzed is 2019-2024. The market is projected to reach xx million by 2033.
Lithium Ion Battery Portable Power Supply Market Structure & Competitive Dynamics
The global Lithium Ion Battery Portable Power Supply market exhibits a moderately concentrated structure, with several key players holding significant market share. EcoFlow, Anker, and GOAL ZERO are among the leading brands, competing based on factors such as capacity, features, price, and brand reputation. The market is characterized by a dynamic innovation ecosystem, with continuous advancements in battery technology, power management systems, and design. Regulatory frameworks related to safety, environmental standards, and import/export significantly impact market operations. Product substitutes, such as traditional generators and other power sources, present competition, while end-user trends towards portability and off-grid power solutions drive market expansion. M&A activity in the sector has been moderate, with estimated deal values totaling xx million in the last five years. Key metrics reveal:
- Market Concentration: The top 5 players account for approximately xx% of the market share in 2025.
- Innovation Ecosystem: Significant investments in R&D are focused on increasing energy density, improving safety features, and developing advanced power management capabilities.
- M&A Activity: Consolidation is expected to increase, driven by the need to expand product lines and gain access to new markets.
Lithium Ion Battery Portable Power Supply Industry Trends & Insights
The Lithium Ion Battery Portable Power Supply market is experiencing robust growth, driven by several factors. The increasing adoption of portable electronics, rising demand for backup power solutions during power outages, and the growing popularity of outdoor recreational activities are major growth drivers. Technological advancements, such as the development of higher energy density batteries and improved power management systems, are contributing to enhanced product performance and efficiency. Consumer preference is shifting towards lightweight, compact, and versatile power solutions, fueling demand for innovative product designs. Intense competition among manufacturers leads to continuous improvements in product features, pricing, and customer service. The market is projected to witness a Compound Annual Growth Rate (CAGR) of xx% during the forecast period (2025-2033), with market penetration rates expected to reach xx% by 2033.
Dominant Markets & Segments in Lithium Ion Battery Portable Power Supply
The North American and European markets are currently leading the global Lithium Ion Battery Portable Power Supply market. Within these regions, the online sales channel is showing faster growth compared to offline sales. Segment analysis reveals:
- Application:
- Online Sales: Growing rapidly due to e-commerce expansion and easy accessibility.
- Offline Sales: Retains a significant share, particularly in specialized retail stores and electronics chains.
- Capacity:
- 500-1000Wh: This segment holds the largest market share due to its balance of portability and power capacity.
- 1000-2000Wh: Shows strong growth, driven by increased demand for larger power banks for longer trips and multiple devices.
- Capacity Above 2000Wh: Demonstrates significant growth potential as it caters to energy intensive applications and professional use cases.
- Capacity Below 500Wh: This segment provides a balance between capacity and portability making it very popular among consumers.
Key Drivers for Dominant Segments:
- Economic Policies: Government incentives for renewable energy and energy efficiency initiatives boost demand.
- Infrastructure: Improved logistics and e-commerce infrastructure enhances online sales channel penetration.
Lithium Ion Battery Portable Power Supply Product Innovations
Recent innovations include faster charging technologies, improved battery management systems (BMS) for increased safety and efficiency, and the integration of features like USB-C PD, solar panel compatibility, and built-in inverters for AC power output. These advancements enhance the portability, versatility, and overall user experience of these power supplies, making them suitable for a wide range of applications, from camping and outdoor adventures to emergency backup power during power outages. These innovations also directly address critical consumer needs for reliability, convenience, and long-lasting power.
Report Segmentation & Scope
This report segments the Lithium Ion Battery Portable Power Supply market based on application (Offline Sales and Online Sales) and capacity (Below 500Wh, 500-1000Wh, 1000-2000Wh, and Above 2000Wh). Each segment is analyzed in detail, providing insights into growth projections, market sizes, and competitive dynamics. Detailed forecast data are presented for each segment, projecting growth trajectories and market shares throughout the forecast period. Competitive landscape analysis within each segment identifies leading players and their respective strategies.
Key Drivers of Lithium Ion Battery Portable Power Supply Growth
Several factors contribute to the market's growth. Technological advancements in battery technology, such as higher energy density and faster charging, directly impact product performance and appeal. The increasing demand for portable power solutions, fueled by the proliferation of electronic devices and the need for backup power during outages, drives market expansion. Furthermore, favorable government regulations and incentives promoting renewable energy and energy efficiency play a significant role.
Challenges in the Lithium Ion Battery Portable Power Supply Sector
The sector faces challenges including the volatility of raw material prices (lithium, cobalt), potential supply chain disruptions, and stringent safety regulations impacting manufacturing and distribution costs. Competition from established players and new entrants intensifies pricing pressure, while consumer concerns about battery lifespan and safety also influence purchase decisions. The high initial investment costs for technology development and manufacturing can also present entry barriers.
Leading Players in the Lithium Ion Battery Portable Power Supply Market
- EcoFlow
- Shenzhen Hello Tech Energy
- GOAL ZERO
- Shenzhen Poweroak Newener
- Allpowers
- DBK Electronics
- Westinghouse
- ANKER
- Pisen
- JVC
- SBASE
- Letsolar
- YOOBAO
- Newsmy
- ORICO Technologies
- FlashFish
- Pecron
- Suaoki
Key Developments in Lithium Ion Battery Portable Power Supply Sector
- 2022 Q4: EcoFlow launched its DELTA Max portable power station with increased capacity.
- 2023 Q1: Anker released a new line of solar-powered portable power stations.
- 2023 Q2: GOAL ZERO introduced a more compact and lightweight portable power station. (Further developments can be added here)
Strategic Lithium Ion Battery Portable Power Supply Market Outlook
The future of the Lithium Ion Battery Portable Power Supply market is promising, with ongoing technological advancements, growing consumer demand, and supportive government policies driving significant growth. Strategic opportunities exist for manufacturers to focus on developing innovative products with enhanced features, improving battery efficiency, and expanding distribution channels. The increasing awareness of sustainability and eco-friendly solutions presents opportunities for manufacturers to highlight environmentally conscious design and manufacturing processes. The market is poised for continued expansion, driven by both existing and emerging applications of portable power solutions across various sectors.
Lithium Ion Battery Portable Power Supply Segmentation
-
1. Application
- 1.1. Offline Sales
- 1.2. Online Sales
-
2. Types
- 2.1. Capacity Below 500Wh
- 2.2. 500-1000Wh
- 2.3. 1000-2000Wh
- 2.4. Capacity Above 2000Wh
Lithium Ion Battery Portable Power Supply Segmentation By Geography
-
1. North America
- 1.1. United States
- 1.2. Canada
- 1.3. Mexico
-
2. South America
- 2.1. Brazil
- 2.2. Argentina
- 2.3. Rest of South America
-
3. Europe
- 3.1. United Kingdom
- 3.2. Germany
- 3.3. France
- 3.4. Italy
- 3.5. Spain
- 3.6. Russia
- 3.7. Benelux
- 3.8. Nordics
- 3.9. Rest of Europe
-
4. Middle East & Africa
- 4.1. Turkey
- 4.2. Israel
- 4.3. GCC
- 4.4. North Africa
- 4.5. South Africa
- 4.6. Rest of Middle East & Africa
-
5. Asia Pacific
- 5.1. China
- 5.2. India
- 5.3. Japan
- 5.4. South Korea
- 5.5. ASEAN
- 5.6. Oceania
- 5.7. Rest of Asia Pacific
Lithium Ion Battery Portable Power Supply Regional Market Share
Geographic Coverage of Lithium Ion Battery Portable Power Supply
Lithium Ion Battery Portable Power Supply REPORT HIGHLIGHTS
| Aspects | Details |
|---|---|
| Study Period | 2020-2034 |
| Base Year | 2025 |
| Estimated Year | 2026 |
| Forecast Period | 2026-2034 |
| Historical Period | 2020-2025 |
| Growth Rate | CAGR of 30.7% from 2020-2034 |
| Segmentation |
|
Table of Contents
- 1. Introduction
- 1.1. Research Scope
- 1.2. Market Segmentation
- 1.3. Research Methodology
- 1.4. Definitions and Assumptions
- 2. Executive Summary
- 2.1. Introduction
- 3. Market Dynamics
- 3.1. Introduction
- 3.2. Market Drivers
- 3.3. Market Restrains
- 3.4. Market Trends
- 4. Market Factor Analysis
- 4.1. Porters Five Forces
- 4.2. Supply/Value Chain
- 4.3. PESTEL analysis
- 4.4. Market Entropy
- 4.5. Patent/Trademark Analysis
- 5. Global Lithium Ion Battery Portable Power Supply Analysis, Insights and Forecast, 2020-2032
- 5.1. Market Analysis, Insights and Forecast - by Application
- 5.1.1. Offline Sales
- 5.1.2. Online Sales
- 5.2. Market Analysis, Insights and Forecast - by Types
- 5.2.1. Capacity Below 500Wh
- 5.2.2. 500-1000Wh
- 5.2.3. 1000-2000Wh
- 5.2.4. Capacity Above 2000Wh
- 5.3. Market Analysis, Insights and Forecast - by Region
- 5.3.1. North America
- 5.3.2. South America
- 5.3.3. Europe
- 5.3.4. Middle East & Africa
- 5.3.5. Asia Pacific
- 5.1. Market Analysis, Insights and Forecast - by Application
- 6. North America Lithium Ion Battery Portable Power Supply Analysis, Insights and Forecast, 2020-2032
- 6.1. Market Analysis, Insights and Forecast - by Application
- 6.1.1. Offline Sales
- 6.1.2. Online Sales
- 6.2. Market Analysis, Insights and Forecast - by Types
- 6.2.1. Capacity Below 500Wh
- 6.2.2. 500-1000Wh
- 6.2.3. 1000-2000Wh
- 6.2.4. Capacity Above 2000Wh
- 6.1. Market Analysis, Insights and Forecast - by Application
- 7. South America Lithium Ion Battery Portable Power Supply Analysis, Insights and Forecast, 2020-2032
- 7.1. Market Analysis, Insights and Forecast - by Application
- 7.1.1. Offline Sales
- 7.1.2. Online Sales
- 7.2. Market Analysis, Insights and Forecast - by Types
- 7.2.1. Capacity Below 500Wh
- 7.2.2. 500-1000Wh
- 7.2.3. 1000-2000Wh
- 7.2.4. Capacity Above 2000Wh
- 7.1. Market Analysis, Insights and Forecast - by Application
- 8. Europe Lithium Ion Battery Portable Power Supply Analysis, Insights and Forecast, 2020-2032
- 8.1. Market Analysis, Insights and Forecast - by Application
- 8.1.1. Offline Sales
- 8.1.2. Online Sales
- 8.2. Market Analysis, Insights and Forecast - by Types
- 8.2.1. Capacity Below 500Wh
- 8.2.2. 500-1000Wh
- 8.2.3. 1000-2000Wh
- 8.2.4. Capacity Above 2000Wh
- 8.1. Market Analysis, Insights and Forecast - by Application
- 9. Middle East & Africa Lithium Ion Battery Portable Power Supply Analysis, Insights and Forecast, 2020-2032
- 9.1. Market Analysis, Insights and Forecast - by Application
- 9.1.1. Offline Sales
- 9.1.2. Online Sales
- 9.2. Market Analysis, Insights and Forecast - by Types
- 9.2.1. Capacity Below 500Wh
- 9.2.2. 500-1000Wh
- 9.2.3. 1000-2000Wh
- 9.2.4. Capacity Above 2000Wh
- 9.1. Market Analysis, Insights and Forecast - by Application
- 10. Asia Pacific Lithium Ion Battery Portable Power Supply Analysis, Insights and Forecast, 2020-2032
- 10.1. Market Analysis, Insights and Forecast - by Application
- 10.1.1. Offline Sales
- 10.1.2. Online Sales
- 10.2. Market Analysis, Insights and Forecast - by Types
- 10.2.1. Capacity Below 500Wh
- 10.2.2. 500-1000Wh
- 10.2.3. 1000-2000Wh
- 10.2.4. Capacity Above 2000Wh
- 10.1. Market Analysis, Insights and Forecast - by Application
- 11. Competitive Analysis
- 11.1. Global Market Share Analysis 2025
- 11.2. Company Profiles
- 11.2.1 EcoFlow
- 11.2.1.1. Overview
- 11.2.1.2. Products
- 11.2.1.3. SWOT Analysis
- 11.2.1.4. Recent Developments
- 11.2.1.5. Financials (Based on Availability)
- 11.2.2 Shenzhen Hello Tech Energy
- 11.2.2.1. Overview
- 11.2.2.2. Products
- 11.2.2.3. SWOT Analysis
- 11.2.2.4. Recent Developments
- 11.2.2.5. Financials (Based on Availability)
- 11.2.3 GOAL ZERO
- 11.2.3.1. Overview
- 11.2.3.2. Products
- 11.2.3.3. SWOT Analysis
- 11.2.3.4. Recent Developments
- 11.2.3.5. Financials (Based on Availability)
- 11.2.4 Shenzhen Poweroak Newener
- 11.2.4.1. Overview
- 11.2.4.2. Products
- 11.2.4.3. SWOT Analysis
- 11.2.4.4. Recent Developments
- 11.2.4.5. Financials (Based on Availability)
- 11.2.5 Allpowers
- 11.2.5.1. Overview
- 11.2.5.2. Products
- 11.2.5.3. SWOT Analysis
- 11.2.5.4. Recent Developments
- 11.2.5.5. Financials (Based on Availability)
- 11.2.6 DBK Electronics
- 11.2.6.1. Overview
- 11.2.6.2. Products
- 11.2.6.3. SWOT Analysis
- 11.2.6.4. Recent Developments
- 11.2.6.5. Financials (Based on Availability)
- 11.2.7 Westinghouse
- 11.2.7.1. Overview
- 11.2.7.2. Products
- 11.2.7.3. SWOT Analysis
- 11.2.7.4. Recent Developments
- 11.2.7.5. Financials (Based on Availability)
- 11.2.8 ANKER
- 11.2.8.1. Overview
- 11.2.8.2. Products
- 11.2.8.3. SWOT Analysis
- 11.2.8.4. Recent Developments
- 11.2.8.5. Financials (Based on Availability)
- 11.2.9 Pisen
- 11.2.9.1. Overview
- 11.2.9.2. Products
- 11.2.9.3. SWOT Analysis
- 11.2.9.4. Recent Developments
- 11.2.9.5. Financials (Based on Availability)
- 11.2.10 JVC
- 11.2.10.1. Overview
- 11.2.10.2. Products
- 11.2.10.3. SWOT Analysis
- 11.2.10.4. Recent Developments
- 11.2.10.5. Financials (Based on Availability)
- 11.2.11 SBASE
- 11.2.11.1. Overview
- 11.2.11.2. Products
- 11.2.11.3. SWOT Analysis
- 11.2.11.4. Recent Developments
- 11.2.11.5. Financials (Based on Availability)
- 11.2.12 Letsolar
- 11.2.12.1. Overview
- 11.2.12.2. Products
- 11.2.12.3. SWOT Analysis
- 11.2.12.4. Recent Developments
- 11.2.12.5. Financials (Based on Availability)
- 11.2.13 YOOBAO
- 11.2.13.1. Overview
- 11.2.13.2. Products
- 11.2.13.3. SWOT Analysis
- 11.2.13.4. Recent Developments
- 11.2.13.5. Financials (Based on Availability)
- 11.2.14 Newsmy
- 11.2.14.1. Overview
- 11.2.14.2. Products
- 11.2.14.3. SWOT Analysis
- 11.2.14.4. Recent Developments
- 11.2.14.5. Financials (Based on Availability)
- 11.2.15 ORICO Technologies
- 11.2.15.1. Overview
- 11.2.15.2. Products
- 11.2.15.3. SWOT Analysis
- 11.2.15.4. Recent Developments
- 11.2.15.5. Financials (Based on Availability)
- 11.2.16 FlashFish
- 11.2.16.1. Overview
- 11.2.16.2. Products
- 11.2.16.3. SWOT Analysis
- 11.2.16.4. Recent Developments
- 11.2.16.5. Financials (Based on Availability)
- 11.2.17 Pecron
- 11.2.17.1. Overview
- 11.2.17.2. Products
- 11.2.17.3. SWOT Analysis
- 11.2.17.4. Recent Developments
- 11.2.17.5. Financials (Based on Availability)
- 11.2.18 Suaoki
- 11.2.18.1. Overview
- 11.2.18.2. Products
- 11.2.18.3. SWOT Analysis
- 11.2.18.4. Recent Developments
- 11.2.18.5. Financials (Based on Availability)
- 11.2.1 EcoFlow
List of Figures
- Figure 1: Global Lithium Ion Battery Portable Power Supply Revenue Breakdown (million, %) by Region 2025 & 2033
- Figure 2: Global Lithium Ion Battery Portable Power Supply Volume Breakdown (K, %) by Region 2025 & 2033
- Figure 3: North America Lithium Ion Battery Portable Power Supply Revenue (million), by Application 2025 & 2033
- Figure 4: North America Lithium Ion Battery Portable Power Supply Volume (K), by Application 2025 & 2033
- Figure 5: North America Lithium Ion Battery Portable Power Supply Revenue Share (%), by Application 2025 & 2033
- Figure 6: North America Lithium Ion Battery Portable Power Supply Volume Share (%), by Application 2025 & 2033
- Figure 7: North America Lithium Ion Battery Portable Power Supply Revenue (million), by Types 2025 & 2033
- Figure 8: North America Lithium Ion Battery Portable Power Supply Volume (K), by Types 2025 & 2033
- Figure 9: North America Lithium Ion Battery Portable Power Supply Revenue Share (%), by Types 2025 & 2033
- Figure 10: North America Lithium Ion Battery Portable Power Supply Volume Share (%), by Types 2025 & 2033
- Figure 11: North America Lithium Ion Battery Portable Power Supply Revenue (million), by Country 2025 & 2033
- Figure 12: North America Lithium Ion Battery Portable Power Supply Volume (K), by Country 2025 & 2033
- Figure 13: North America Lithium Ion Battery Portable Power Supply Revenue Share (%), by Country 2025 & 2033
- Figure 14: North America Lithium Ion Battery Portable Power Supply Volume Share (%), by Country 2025 & 2033
- Figure 15: South America Lithium Ion Battery Portable Power Supply Revenue (million), by Application 2025 & 2033
- Figure 16: South America Lithium Ion Battery Portable Power Supply Volume (K), by Application 2025 & 2033
- Figure 17: South America Lithium Ion Battery Portable Power Supply Revenue Share (%), by Application 2025 & 2033
- Figure 18: South America Lithium Ion Battery Portable Power Supply Volume Share (%), by Application 2025 & 2033
- Figure 19: South America Lithium Ion Battery Portable Power Supply Revenue (million), by Types 2025 & 2033
- Figure 20: South America Lithium Ion Battery Portable Power Supply Volume (K), by Types 2025 & 2033
- Figure 21: South America Lithium Ion Battery Portable Power Supply Revenue Share (%), by Types 2025 & 2033
- Figure 22: South America Lithium Ion Battery Portable Power Supply Volume Share (%), by Types 2025 & 2033
- Figure 23: South America Lithium Ion Battery Portable Power Supply Revenue (million), by Country 2025 & 2033
- Figure 24: South America Lithium Ion Battery Portable Power Supply Volume (K), by Country 2025 & 2033
- Figure 25: South America Lithium Ion Battery Portable Power Supply Revenue Share (%), by Country 2025 & 2033
- Figure 26: South America Lithium Ion Battery Portable Power Supply Volume Share (%), by Country 2025 & 2033
- Figure 27: Europe Lithium Ion Battery Portable Power Supply Revenue (million), by Application 2025 & 2033
- Figure 28: Europe Lithium Ion Battery Portable Power Supply Volume (K), by Application 2025 & 2033
- Figure 29: Europe Lithium Ion Battery Portable Power Supply Revenue Share (%), by Application 2025 & 2033
- Figure 30: Europe Lithium Ion Battery Portable Power Supply Volume Share (%), by Application 2025 & 2033
- Figure 31: Europe Lithium Ion Battery Portable Power Supply Revenue (million), by Types 2025 & 2033
- Figure 32: Europe Lithium Ion Battery Portable Power Supply Volume (K), by Types 2025 & 2033
- Figure 33: Europe Lithium Ion Battery Portable Power Supply Revenue Share (%), by Types 2025 & 2033
- Figure 34: Europe Lithium Ion Battery Portable Power Supply Volume Share (%), by Types 2025 & 2033
- Figure 35: Europe Lithium Ion Battery Portable Power Supply Revenue (million), by Country 2025 & 2033
- Figure 36: Europe Lithium Ion Battery Portable Power Supply Volume (K), by Country 2025 & 2033
- Figure 37: Europe Lithium Ion Battery Portable Power Supply Revenue Share (%), by Country 2025 & 2033
- Figure 38: Europe Lithium Ion Battery Portable Power Supply Volume Share (%), by Country 2025 & 2033
- Figure 39: Middle East & Africa Lithium Ion Battery Portable Power Supply Revenue (million), by Application 2025 & 2033
- Figure 40: Middle East & Africa Lithium Ion Battery Portable Power Supply Volume (K), by Application 2025 & 2033
- Figure 41: Middle East & Africa Lithium Ion Battery Portable Power Supply Revenue Share (%), by Application 2025 & 2033
- Figure 42: Middle East & Africa Lithium Ion Battery Portable Power Supply Volume Share (%), by Application 2025 & 2033
- Figure 43: Middle East & Africa Lithium Ion Battery Portable Power Supply Revenue (million), by Types 2025 & 2033
- Figure 44: Middle East & Africa Lithium Ion Battery Portable Power Supply Volume (K), by Types 2025 & 2033
- Figure 45: Middle East & Africa Lithium Ion Battery Portable Power Supply Revenue Share (%), by Types 2025 & 2033
- Figure 46: Middle East & Africa Lithium Ion Battery Portable Power Supply Volume Share (%), by Types 2025 & 2033
- Figure 47: Middle East & Africa Lithium Ion Battery Portable Power Supply Revenue (million), by Country 2025 & 2033
- Figure 48: Middle East & Africa Lithium Ion Battery Portable Power Supply Volume (K), by Country 2025 & 2033
- Figure 49: Middle East & Africa Lithium Ion Battery Portable Power Supply Revenue Share (%), by Country 2025 & 2033
- Figure 50: Middle East & Africa Lithium Ion Battery Portable Power Supply Volume Share (%), by Country 2025 & 2033
- Figure 51: Asia Pacific Lithium Ion Battery Portable Power Supply Revenue (million), by Application 2025 & 2033
- Figure 52: Asia Pacific Lithium Ion Battery Portable Power Supply Volume (K), by Application 2025 & 2033
- Figure 53: Asia Pacific Lithium Ion Battery Portable Power Supply Revenue Share (%), by Application 2025 & 2033
- Figure 54: Asia Pacific Lithium Ion Battery Portable Power Supply Volume Share (%), by Application 2025 & 2033
- Figure 55: Asia Pacific Lithium Ion Battery Portable Power Supply Revenue (million), by Types 2025 & 2033
- Figure 56: Asia Pacific Lithium Ion Battery Portable Power Supply Volume (K), by Types 2025 & 2033
- Figure 57: Asia Pacific Lithium Ion Battery Portable Power Supply Revenue Share (%), by Types 2025 & 2033
- Figure 58: Asia Pacific Lithium Ion Battery Portable Power Supply Volume Share (%), by Types 2025 & 2033
- Figure 59: Asia Pacific Lithium Ion Battery Portable Power Supply Revenue (million), by Country 2025 & 2033
- Figure 60: Asia Pacific Lithium Ion Battery Portable Power Supply Volume (K), by Country 2025 & 2033
- Figure 61: Asia Pacific Lithium Ion Battery Portable Power Supply Revenue Share (%), by Country 2025 & 2033
- Figure 62: Asia Pacific Lithium Ion Battery Portable Power Supply Volume Share (%), by Country 2025 & 2033
List of Tables
- Table 1: Global Lithium Ion Battery Portable Power Supply Revenue million Forecast, by Application 2020 & 2033
- Table 2: Global Lithium Ion Battery Portable Power Supply Volume K Forecast, by Application 2020 & 2033
- Table 3: Global Lithium Ion Battery Portable Power Supply Revenue million Forecast, by Types 2020 & 2033
- Table 4: Global Lithium Ion Battery Portable Power Supply Volume K Forecast, by Types 2020 & 2033
- Table 5: Global Lithium Ion Battery Portable Power Supply Revenue million Forecast, by Region 2020 & 2033
- Table 6: Global Lithium Ion Battery Portable Power Supply Volume K Forecast, by Region 2020 & 2033
- Table 7: Global Lithium Ion Battery Portable Power Supply Revenue million Forecast, by Application 2020 & 2033
- Table 8: Global Lithium Ion Battery Portable Power Supply Volume K Forecast, by Application 2020 & 2033
- Table 9: Global Lithium Ion Battery Portable Power Supply Revenue million Forecast, by Types 2020 & 2033
- Table 10: Global Lithium Ion Battery Portable Power Supply Volume K Forecast, by Types 2020 & 2033
- Table 11: Global Lithium Ion Battery Portable Power Supply Revenue million Forecast, by Country 2020 & 2033
- Table 12: Global Lithium Ion Battery Portable Power Supply Volume K Forecast, by Country 2020 & 2033
- Table 13: United States Lithium Ion Battery Portable Power Supply Revenue (million) Forecast, by Application 2020 & 2033
- Table 14: United States Lithium Ion Battery Portable Power Supply Volume (K) Forecast, by Application 2020 & 2033
- Table 15: Canada Lithium Ion Battery Portable Power Supply Revenue (million) Forecast, by Application 2020 & 2033
- Table 16: Canada Lithium Ion Battery Portable Power Supply Volume (K) Forecast, by Application 2020 & 2033
- Table 17: Mexico Lithium Ion Battery Portable Power Supply Revenue (million) Forecast, by Application 2020 & 2033
- Table 18: Mexico Lithium Ion Battery Portable Power Supply Volume (K) Forecast, by Application 2020 & 2033
- Table 19: Global Lithium Ion Battery Portable Power Supply Revenue million Forecast, by Application 2020 & 2033
- Table 20: Global Lithium Ion Battery Portable Power Supply Volume K Forecast, by Application 2020 & 2033
- Table 21: Global Lithium Ion Battery Portable Power Supply Revenue million Forecast, by Types 2020 & 2033
- Table 22: Global Lithium Ion Battery Portable Power Supply Volume K Forecast, by Types 2020 & 2033
- Table 23: Global Lithium Ion Battery Portable Power Supply Revenue million Forecast, by Country 2020 & 2033
- Table 24: Global Lithium Ion Battery Portable Power Supply Volume K Forecast, by Country 2020 & 2033
- Table 25: Brazil Lithium Ion Battery Portable Power Supply Revenue (million) Forecast, by Application 2020 & 2033
- Table 26: Brazil Lithium Ion Battery Portable Power Supply Volume (K) Forecast, by Application 2020 & 2033
- Table 27: Argentina Lithium Ion Battery Portable Power Supply Revenue (million) Forecast, by Application 2020 & 2033
- Table 28: Argentina Lithium Ion Battery Portable Power Supply Volume (K) Forecast, by Application 2020 & 2033
- Table 29: Rest of South America Lithium Ion Battery Portable Power Supply Revenue (million) Forecast, by Application 2020 & 2033
- Table 30: Rest of South America Lithium Ion Battery Portable Power Supply Volume (K) Forecast, by Application 2020 & 2033
- Table 31: Global Lithium Ion Battery Portable Power Supply Revenue million Forecast, by Application 2020 & 2033
- Table 32: Global Lithium Ion Battery Portable Power Supply Volume K Forecast, by Application 2020 & 2033
- Table 33: Global Lithium Ion Battery Portable Power Supply Revenue million Forecast, by Types 2020 & 2033
- Table 34: Global Lithium Ion Battery Portable Power Supply Volume K Forecast, by Types 2020 & 2033
- Table 35: Global Lithium Ion Battery Portable Power Supply Revenue million Forecast, by Country 2020 & 2033
- Table 36: Global Lithium Ion Battery Portable Power Supply Volume K Forecast, by Country 2020 & 2033
- Table 37: United Kingdom Lithium Ion Battery Portable Power Supply Revenue (million) Forecast, by Application 2020 & 2033
- Table 38: United Kingdom Lithium Ion Battery Portable Power Supply Volume (K) Forecast, by Application 2020 & 2033
- Table 39: Germany Lithium Ion Battery Portable Power Supply Revenue (million) Forecast, by Application 2020 & 2033
- Table 40: Germany Lithium Ion Battery Portable Power Supply Volume (K) Forecast, by Application 2020 & 2033
- Table 41: France Lithium Ion Battery Portable Power Supply Revenue (million) Forecast, by Application 2020 & 2033
- Table 42: France Lithium Ion Battery Portable Power Supply Volume (K) Forecast, by Application 2020 & 2033
- Table 43: Italy Lithium Ion Battery Portable Power Supply Revenue (million) Forecast, by Application 2020 & 2033
- Table 44: Italy Lithium Ion Battery Portable Power Supply Volume (K) Forecast, by Application 2020 & 2033
- Table 45: Spain Lithium Ion Battery Portable Power Supply Revenue (million) Forecast, by Application 2020 & 2033
- Table 46: Spain Lithium Ion Battery Portable Power Supply Volume (K) Forecast, by Application 2020 & 2033
- Table 47: Russia Lithium Ion Battery Portable Power Supply Revenue (million) Forecast, by Application 2020 & 2033
- Table 48: Russia Lithium Ion Battery Portable Power Supply Volume (K) Forecast, by Application 2020 & 2033
- Table 49: Benelux Lithium Ion Battery Portable Power Supply Revenue (million) Forecast, by Application 2020 & 2033
- Table 50: Benelux Lithium Ion Battery Portable Power Supply Volume (K) Forecast, by Application 2020 & 2033
- Table 51: Nordics Lithium Ion Battery Portable Power Supply Revenue (million) Forecast, by Application 2020 & 2033
- Table 52: Nordics Lithium Ion Battery Portable Power Supply Volume (K) Forecast, by Application 2020 & 2033
- Table 53: Rest of Europe Lithium Ion Battery Portable Power Supply Revenue (million) Forecast, by Application 2020 & 2033
- Table 54: Rest of Europe Lithium Ion Battery Portable Power Supply Volume (K) Forecast, by Application 2020 & 2033
- Table 55: Global Lithium Ion Battery Portable Power Supply Revenue million Forecast, by Application 2020 & 2033
- Table 56: Global Lithium Ion Battery Portable Power Supply Volume K Forecast, by Application 2020 & 2033
- Table 57: Global Lithium Ion Battery Portable Power Supply Revenue million Forecast, by Types 2020 & 2033
- Table 58: Global Lithium Ion Battery Portable Power Supply Volume K Forecast, by Types 2020 & 2033
- Table 59: Global Lithium Ion Battery Portable Power Supply Revenue million Forecast, by Country 2020 & 2033
- Table 60: Global Lithium Ion Battery Portable Power Supply Volume K Forecast, by Country 2020 & 2033
- Table 61: Turkey Lithium Ion Battery Portable Power Supply Revenue (million) Forecast, by Application 2020 & 2033
- Table 62: Turkey Lithium Ion Battery Portable Power Supply Volume (K) Forecast, by Application 2020 & 2033
- Table 63: Israel Lithium Ion Battery Portable Power Supply Revenue (million) Forecast, by Application 2020 & 2033
- Table 64: Israel Lithium Ion Battery Portable Power Supply Volume (K) Forecast, by Application 2020 & 2033
- Table 65: GCC Lithium Ion Battery Portable Power Supply Revenue (million) Forecast, by Application 2020 & 2033
- Table 66: GCC Lithium Ion Battery Portable Power Supply Volume (K) Forecast, by Application 2020 & 2033
- Table 67: North Africa Lithium Ion Battery Portable Power Supply Revenue (million) Forecast, by Application 2020 & 2033
- Table 68: North Africa Lithium Ion Battery Portable Power Supply Volume (K) Forecast, by Application 2020 & 2033
- Table 69: South Africa Lithium Ion Battery Portable Power Supply Revenue (million) Forecast, by Application 2020 & 2033
- Table 70: South Africa Lithium Ion Battery Portable Power Supply Volume (K) Forecast, by Application 2020 & 2033
- Table 71: Rest of Middle East & Africa Lithium Ion Battery Portable Power Supply Revenue (million) Forecast, by Application 2020 & 2033
- Table 72: Rest of Middle East & Africa Lithium Ion Battery Portable Power Supply Volume (K) Forecast, by Application 2020 & 2033
- Table 73: Global Lithium Ion Battery Portable Power Supply Revenue million Forecast, by Application 2020 & 2033
- Table 74: Global Lithium Ion Battery Portable Power Supply Volume K Forecast, by Application 2020 & 2033
- Table 75: Global Lithium Ion Battery Portable Power Supply Revenue million Forecast, by Types 2020 & 2033
- Table 76: Global Lithium Ion Battery Portable Power Supply Volume K Forecast, by Types 2020 & 2033
- Table 77: Global Lithium Ion Battery Portable Power Supply Revenue million Forecast, by Country 2020 & 2033
- Table 78: Global Lithium Ion Battery Portable Power Supply Volume K Forecast, by Country 2020 & 2033
- Table 79: China Lithium Ion Battery Portable Power Supply Revenue (million) Forecast, by Application 2020 & 2033
- Table 80: China Lithium Ion Battery Portable Power Supply Volume (K) Forecast, by Application 2020 & 2033
- Table 81: India Lithium Ion Battery Portable Power Supply Revenue (million) Forecast, by Application 2020 & 2033
- Table 82: India Lithium Ion Battery Portable Power Supply Volume (K) Forecast, by Application 2020 & 2033
- Table 83: Japan Lithium Ion Battery Portable Power Supply Revenue (million) Forecast, by Application 2020 & 2033
- Table 84: Japan Lithium Ion Battery Portable Power Supply Volume (K) Forecast, by Application 2020 & 2033
- Table 85: South Korea Lithium Ion Battery Portable Power Supply Revenue (million) Forecast, by Application 2020 & 2033
- Table 86: South Korea Lithium Ion Battery Portable Power Supply Volume (K) Forecast, by Application 2020 & 2033
- Table 87: ASEAN Lithium Ion Battery Portable Power Supply Revenue (million) Forecast, by Application 2020 & 2033
- Table 88: ASEAN Lithium Ion Battery Portable Power Supply Volume (K) Forecast, by Application 2020 & 2033
- Table 89: Oceania Lithium Ion Battery Portable Power Supply Revenue (million) Forecast, by Application 2020 & 2033
- Table 90: Oceania Lithium Ion Battery Portable Power Supply Volume (K) Forecast, by Application 2020 & 2033
- Table 91: Rest of Asia Pacific Lithium Ion Battery Portable Power Supply Revenue (million) Forecast, by Application 2020 & 2033
- Table 92: Rest of Asia Pacific Lithium Ion Battery Portable Power Supply Volume (K) Forecast, by Application 2020 & 2033
Frequently Asked Questions
1. What is the projected Compound Annual Growth Rate (CAGR) of the Lithium Ion Battery Portable Power Supply?
The projected CAGR is approximately 30.7%.
2. Which companies are prominent players in the Lithium Ion Battery Portable Power Supply?
Key companies in the market include EcoFlow, Shenzhen Hello Tech Energy, GOAL ZERO, Shenzhen Poweroak Newener, Allpowers, DBK Electronics, Westinghouse, ANKER, Pisen, JVC, SBASE, Letsolar, YOOBAO, Newsmy, ORICO Technologies, FlashFish, Pecron, Suaoki.
3. What are the main segments of the Lithium Ion Battery Portable Power Supply?
The market segments include Application, Types.
4. Can you provide details about the market size?
The market size is estimated to be USD 2582.7 million as of 2022.
5. What are some drivers contributing to market growth?
N/A
6. What are the notable trends driving market growth?
N/A
7. Are there any restraints impacting market growth?
N/A
8. Can you provide examples of recent developments in the market?
N/A
9. What pricing options are available for accessing the report?
Pricing options include single-user, multi-user, and enterprise licenses priced at USD 3350.00, USD 5025.00, and USD 6700.00 respectively.
10. Is the market size provided in terms of value or volume?
The market size is provided in terms of value, measured in million and volume, measured in K.
11. Are there any specific market keywords associated with the report?
Yes, the market keyword associated with the report is "Lithium Ion Battery Portable Power Supply," which aids in identifying and referencing the specific market segment covered.
12. How do I determine which pricing option suits my needs best?
The pricing options vary based on user requirements and access needs. Individual users may opt for single-user licenses, while businesses requiring broader access may choose multi-user or enterprise licenses for cost-effective access to the report.
13. Are there any additional resources or data provided in the Lithium Ion Battery Portable Power Supply report?
While the report offers comprehensive insights, it's advisable to review the specific contents or supplementary materials provided to ascertain if additional resources or data are available.
14. How can I stay updated on further developments or reports in the Lithium Ion Battery Portable Power Supply?
To stay informed about further developments, trends, and reports in the Lithium Ion Battery Portable Power Supply, consider subscribing to industry newsletters, following relevant companies and organizations, or regularly checking reputable industry news sources and publications.
Methodology
Step 1 - Identification of Relevant Samples Size from Population Database


Step 2 - Approaches for Defining Global Market Size (Value, Volume* & Price*)

Note*: In applicable scenarios
Step 3 - Data Sources
Primary Research
- Web Analytics
- Survey Reports
- Research Institute
- Latest Research Reports
- Opinion Leaders
Secondary Research
- Annual Reports
- White Paper
- Latest Press Release
- Industry Association
- Paid Database
- Investor Presentations

Step 4 - Data Triangulation
Involves using different sources of information in order to increase the validity of a study
These sources are likely to be stakeholders in a program - participants, other researchers, program staff, other community members, and so on.
Then we put all data in single framework & apply various statistical tools to find out the dynamic on the market.
During the analysis stage, feedback from the stakeholder groups would be compared to determine areas of agreement as well as areas of divergence