
Key Insights
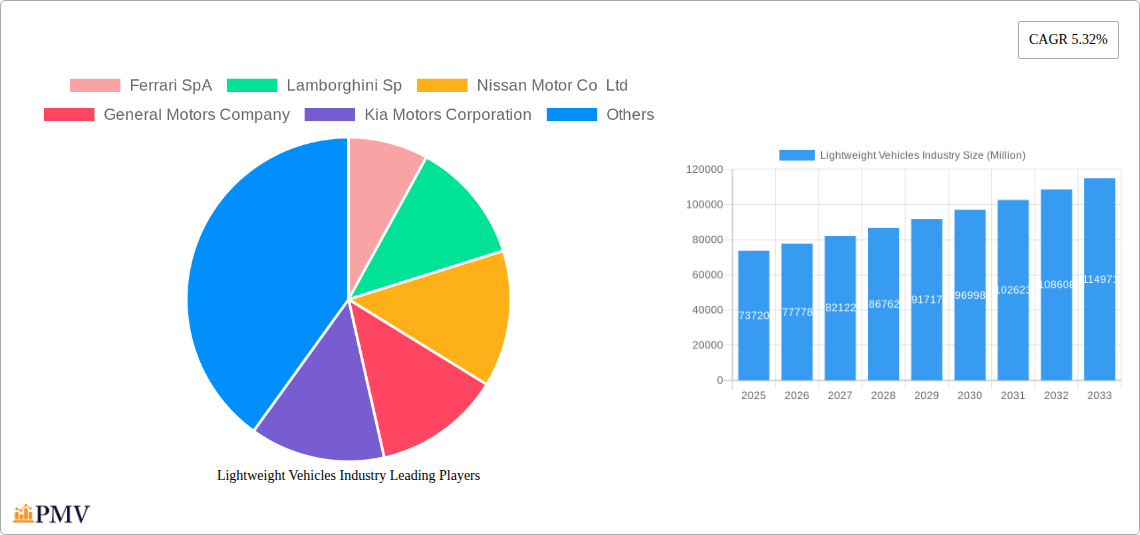
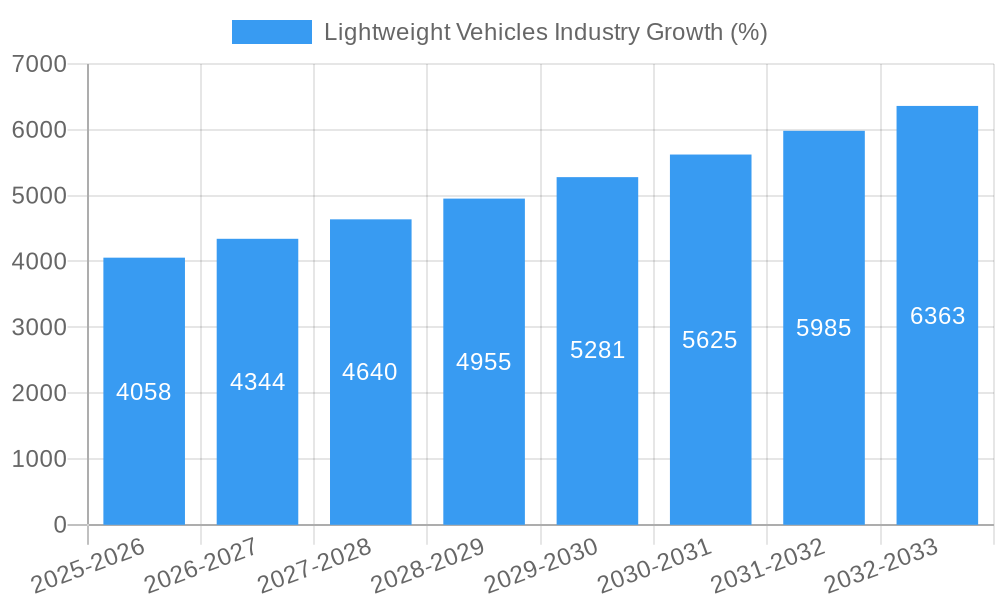
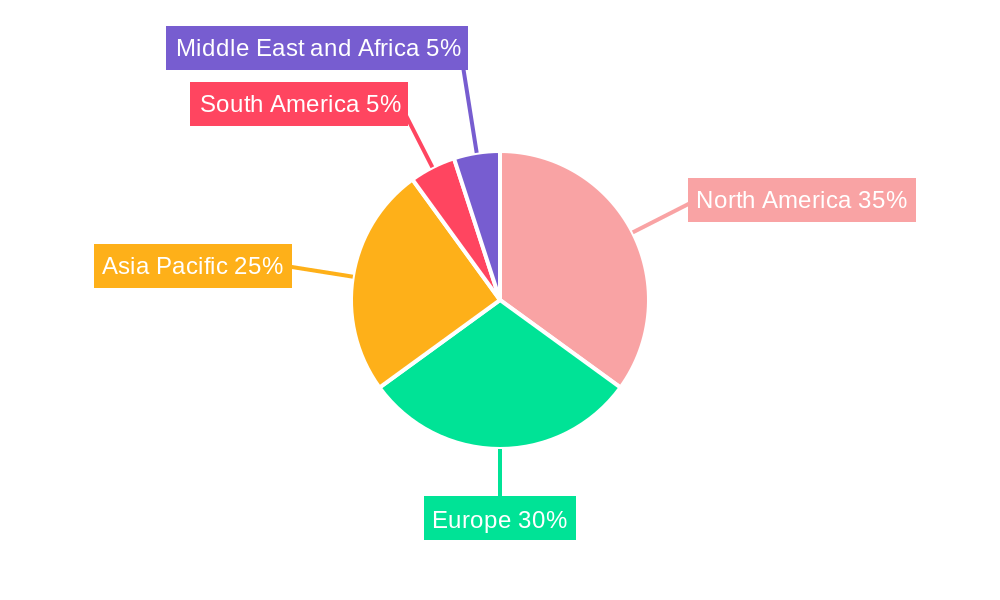
The lightweight vehicles market, valued at $73.72 billion in 2025, is projected to experience robust growth, driven by increasing demand for fuel-efficient vehicles and stringent government regulations aimed at reducing carbon emissions. The market's Compound Annual Growth Rate (CAGR) of 5.32% from 2025 to 2033 indicates a significant expansion over the forecast period. Key growth drivers include the rising adoption of lightweight materials like carbon fiber and high-strength steel in automotive manufacturing, the increasing popularity of electric and hybrid vehicles which benefit significantly from lightweight designs, and advancements in manufacturing technologies leading to cost reductions in lightweight material production. The passenger car segment currently dominates the market, followed by sports cars, reflecting the widespread use of lightweighting techniques in passenger vehicles. Geographic expansion is also a major factor. North America and Europe are currently leading markets due to high vehicle ownership rates and strong regulatory frameworks, but the Asia-Pacific region is poised for significant growth, driven by rising disposable incomes and increasing car sales in countries like China and India.
The market faces some challenges, primarily related to the high initial cost of lightweight materials compared to traditional steel. However, ongoing research and development are focused on reducing production costs and improving the performance characteristics of these materials. Competition among major automotive manufacturers like Ferrari, Lamborghini, Nissan, General Motors, and others is driving innovation and pushing the boundaries of lightweight vehicle design. This competitive landscape is fostering the development of innovative materials and manufacturing processes, which ultimately benefits consumers through improved fuel efficiency, safety, and performance. The segmentation by material type (glass fiber, carbon fiber, high-strength steel, etc.) reveals diverse technological approaches, each offering unique advantages and drawbacks, contributing to the market's complexity and dynamism. Future growth will depend on continued technological advancements, the successful integration of lightweight materials into mass-market vehicles, and the sustained focus on environmental sustainability within the automotive industry.
Lightweight Vehicles Industry: A Comprehensive Market Report (2019-2033)
This in-depth report provides a comprehensive analysis of the Lightweight Vehicles Industry, covering market structure, competitive dynamics, industry trends, and future growth prospects from 2019 to 2033. The report leverages extensive data and analysis to offer actionable insights for stakeholders across the automotive value chain. With a focus on key players like Ferrari SpA, Lamborghini SpA, Nissan Motor Co Ltd, General Motors Company, Kia Motors Corporation, Hyundai Motor Co, Toyota Motor Corporation, Honda Motor Co Ltd, Volkswagen, and Ford Motor Company, this report is an indispensable resource for strategic decision-making. The market is segmented by car type (Passenger Cars, Sports Cars) and material type (Glass Fiber, Carbon Fiber, High-strength Steel, Other Material Types). The report projects a market value of xx Million by 2033.
Lightweight Vehicles Industry Market Structure & Competitive Dynamics
The Lightweight Vehicles Industry is characterized by a moderately concentrated market structure, with a few dominant players holding significant market share. However, the emergence of new technologies and the increasing focus on sustainability are fostering a dynamic competitive landscape. Innovation ecosystems are evolving rapidly, driven by collaborations between established automotive manufacturers and technology companies. Stringent regulatory frameworks focused on fuel efficiency and emission standards are shaping product development and influencing market dynamics. Product substitutes, such as alternative materials and vehicle designs, pose a constant challenge. End-user preferences are shifting towards lightweight vehicles due to their enhanced fuel economy and performance. M&A activity in the sector has been significant, with deal values exceeding xx Million in the historical period (2019-2024).
- Market Concentration: The top 5 players account for approximately xx% of the global market share (2025).
- Innovation Ecosystems: Significant collaboration between automotive OEMs and material suppliers.
- Regulatory Frameworks: Stringent emission and fuel efficiency standards are driving adoption of lightweight materials.
- M&A Activity: Total deal value exceeding xx Million in 2019-2024, with an average deal size of xx Million.
Lightweight Vehicles Industry Industry Trends & Insights
The Lightweight Vehicles Industry is experiencing robust growth, driven by several factors. The increasing demand for fuel-efficient and environmentally friendly vehicles is a primary catalyst, with governments worldwide implementing stringent emission regulations. Technological advancements in lightweight materials, such as carbon fiber and advanced high-strength steels, are enabling the production of lighter and more efficient vehicles. Consumer preferences are shifting towards vehicles that offer better fuel economy, performance, and safety. The competitive landscape is characterized by intense innovation and a push for differentiation through lightweighting strategies. The industry is projected to witness a Compound Annual Growth Rate (CAGR) of xx% during the forecast period (2025-2033), with market penetration of lightweight materials steadily increasing. Specific market segments, like electric vehicles, are showing even faster growth rates, exceeding xx% CAGR.
Dominant Markets & Segments in Lightweight Vehicles Industry
The North American region currently holds a leading position in the Lightweight Vehicles Industry, driven by strong demand from the passenger car segment and significant investments in advanced automotive technologies. This dominance is further strengthened by established automotive manufacturing infrastructure and favorable economic policies. Europe follows as a key market, with strong focus on sustainable mobility solutions and high adoption rates of lightweight materials. The Asia-Pacific region shows substantial growth potential driven by increasing vehicle production and a rising middle class.
- Key Drivers for North America: Strong demand for passenger cars, robust automotive manufacturing base, supportive government policies.
- Key Drivers for Europe: Focus on sustainable mobility, high adoption of lightweight materials in premium vehicles, stringent emission regulations.
- Key Drivers for Asia-Pacific: Increasing vehicle production, rising disposable incomes, strong government initiatives to promote fuel efficiency.
Within material types, Carbon Fiber shows the highest growth potential, driven by its exceptional strength-to-weight ratio. High-strength steel continues to maintain substantial market share due to its cost-effectiveness and widespread applicability.
Lightweight Vehicles Industry Product Innovations
Recent innovations include the development of ultra-lightweight electric drivetrains (ZF's EVbeat), lighter vehicle doors utilizing carbon fiber and thermoplastic resin (Clemson University/Honda), and highly efficient axial flux motors (Mercedes-AMG/YASA). These advancements significantly improve fuel efficiency, performance, and safety while contributing to the reduction of emissions. The industry trend is towards increased integration of lightweight materials and advanced manufacturing processes.
Report Segmentation & Scope
Car Type: The report segments the market by car type into Passenger Cars and Sports Cars. Passenger cars represent a larger market share, however, sports cars exhibit higher growth driven by demand for high-performance, lightweight vehicles. Both segments show positive growth projections throughout the forecast period.
Material Type: The report analyzes the market based on material type: Glass Fiber, Carbon Fiber, High-strength Steel, and Other Material Types. Carbon Fiber is anticipated to witness the most rapid growth due to its superior properties. High-strength steel will continue to maintain its significant market share owing to cost-effectiveness.
Key Drivers of Lightweight Vehicles Industry Growth
Several factors propel the growth of the Lightweight Vehicles Industry. Technological advancements, particularly in materials science and manufacturing processes, are enabling the development of lighter and stronger materials. Stringent government regulations aimed at improving fuel efficiency and reducing emissions are driving the adoption of lightweight vehicles. Growing consumer demand for fuel-efficient and eco-friendly vehicles is also a key growth driver. Furthermore, advancements in electric vehicle technology are boosting the demand for lightweight components to optimize battery range and vehicle performance.
Challenges in the Lightweight Vehicles Industry Sector
The Lightweight Vehicles Industry faces certain challenges. High initial costs associated with some lightweight materials can pose a barrier to widespread adoption. Supply chain disruptions and fluctuations in raw material prices can impact production costs and profitability. Intense competition and the need for continuous innovation present ongoing challenges for market players. Furthermore, meeting stringent safety standards while simultaneously reducing vehicle weight requires sophisticated engineering and testing, adding complexity to the manufacturing process.
Leading Players in the Lightweight Vehicles Industry Market
- Ferrari SpA (Ferrari)
- Lamborghini SpA (Lamborghini)
- Nissan Motor Co Ltd (Nissan)
- General Motors Company (General Motors)
- Kia Motors Corporation (Kia)
- Hyundai Motor Co (Hyundai)
- Toyota Motor Corporation (Toyota)
- Honda Motor Co Ltd (Honda)
- Volkswagen (Volkswagen)
- Ford Motor Company (Ford)
Key Developments in Lightweight Vehicles Industry Sector
- November 2023: Huawei partners with Changan Auto to develop advanced automotive systems.
- August 2023: Clemson University, NETL, and Honda develop a 32% lighter carbon fiber vehicle door.
- June 2023: ZF unveils EVbeat, an ultra-lightweight electric concept vehicle.
- May 2022: Mercedes-AMG unveils Vision AMG, an all-electric concept car with a lightweight axial flux motor.
Strategic Lightweight Vehicles Industry Market Outlook
The Lightweight Vehicles Industry is poised for significant growth in the coming years. Continued advancements in lightweight materials, coupled with rising demand for fuel-efficient and electric vehicles, will drive market expansion. Strategic opportunities exist for companies that can innovate in material science, manufacturing processes, and vehicle design. Collaborations and partnerships will be key to accelerating innovation and achieving economies of scale. The market outlook is positive, with substantial growth potential across various segments and regions.
Lightweight Vehicles Industry Segmentation
-
1. Car Type
- 1.1. Passenger Cars
- 1.2. Sports Cars
-
2. Material Type
- 2.1. Glass Fiber
- 2.2. Carbon Fiber
- 2.3. High-strength Steel
- 2.4. Other Material Types
Lightweight Vehicles Industry Segmentation By Geography
-
1. North America
- 1.1. United States
- 1.2. Canada
- 1.3. Rest of North America
-
2. Europe
- 2.1. Germany
- 2.2. United Kingdom
- 2.3. France
- 2.4. Rest of Europe
-
3. Asia Pacific
- 3.1. China
- 3.2. Japan
- 3.3. India
- 3.4. South Korea
- 3.5. Rest of Asia Pacific
-
4. South America
- 4.1. Brazil
- 4.2. Rest of South America
-
5. Middle East and Africa
- 5.1. United Arab Emirates
- 5.2. South Africa
- 5.3. Rest of Middle East and Africa
Lightweight Vehicles Industry REPORT HIGHLIGHTS
| Aspects | Details |
|---|---|
| Study Period | 2019-2033 |
| Base Year | 2024 |
| Estimated Year | 2025 |
| Forecast Period | 2025-2033 |
| Historical Period | 2019-2024 |
| Growth Rate | CAGR of 5.32% from 2019-2033 |
| Segmentation |
|
Table of Contents
- 1. Introduction
- 1.1. Research Scope
- 1.2. Market Segmentation
- 1.3. Research Methodology
- 1.4. Definitions and Assumptions
- 2. Executive Summary
- 2.1. Introduction
- 3. Market Dynamics
- 3.1. Introduction
- 3.2. Market Drivers
- 3.2.1. Technological Innovations and Material Advancements is Likely to Fuel Demand
- 3.3. Market Restrains
- 3.3.1. High Cost of Lightweight Materials is Anticipated to Restrict the Market Growth Potential
- 3.4. Market Trends
- 3.4.1. Increasing Demand for Lightweight Passenger Cars
- 4. Market Factor Analysis
- 4.1. Porters Five Forces
- 4.2. Supply/Value Chain
- 4.3. PESTEL analysis
- 4.4. Market Entropy
- 4.5. Patent/Trademark Analysis
- 5. Global Lightweight Vehicles Industry Analysis, Insights and Forecast, 2019-2031
- 5.1. Market Analysis, Insights and Forecast - by Car Type
- 5.1.1. Passenger Cars
- 5.1.2. Sports Cars
- 5.2. Market Analysis, Insights and Forecast - by Material Type
- 5.2.1. Glass Fiber
- 5.2.2. Carbon Fiber
- 5.2.3. High-strength Steel
- 5.2.4. Other Material Types
- 5.3. Market Analysis, Insights and Forecast - by Region
- 5.3.1. North America
- 5.3.2. Europe
- 5.3.3. Asia Pacific
- 5.3.4. South America
- 5.3.5. Middle East and Africa
- 5.1. Market Analysis, Insights and Forecast - by Car Type
- 6. North America Lightweight Vehicles Industry Analysis, Insights and Forecast, 2019-2031
- 6.1. Market Analysis, Insights and Forecast - by Car Type
- 6.1.1. Passenger Cars
- 6.1.2. Sports Cars
- 6.2. Market Analysis, Insights and Forecast - by Material Type
- 6.2.1. Glass Fiber
- 6.2.2. Carbon Fiber
- 6.2.3. High-strength Steel
- 6.2.4. Other Material Types
- 6.1. Market Analysis, Insights and Forecast - by Car Type
- 7. Europe Lightweight Vehicles Industry Analysis, Insights and Forecast, 2019-2031
- 7.1. Market Analysis, Insights and Forecast - by Car Type
- 7.1.1. Passenger Cars
- 7.1.2. Sports Cars
- 7.2. Market Analysis, Insights and Forecast - by Material Type
- 7.2.1. Glass Fiber
- 7.2.2. Carbon Fiber
- 7.2.3. High-strength Steel
- 7.2.4. Other Material Types
- 7.1. Market Analysis, Insights and Forecast - by Car Type
- 8. Asia Pacific Lightweight Vehicles Industry Analysis, Insights and Forecast, 2019-2031
- 8.1. Market Analysis, Insights and Forecast - by Car Type
- 8.1.1. Passenger Cars
- 8.1.2. Sports Cars
- 8.2. Market Analysis, Insights and Forecast - by Material Type
- 8.2.1. Glass Fiber
- 8.2.2. Carbon Fiber
- 8.2.3. High-strength Steel
- 8.2.4. Other Material Types
- 8.1. Market Analysis, Insights and Forecast - by Car Type
- 9. South America Lightweight Vehicles Industry Analysis, Insights and Forecast, 2019-2031
- 9.1. Market Analysis, Insights and Forecast - by Car Type
- 9.1.1. Passenger Cars
- 9.1.2. Sports Cars
- 9.2. Market Analysis, Insights and Forecast - by Material Type
- 9.2.1. Glass Fiber
- 9.2.2. Carbon Fiber
- 9.2.3. High-strength Steel
- 9.2.4. Other Material Types
- 9.1. Market Analysis, Insights and Forecast - by Car Type
- 10. Middle East and Africa Lightweight Vehicles Industry Analysis, Insights and Forecast, 2019-2031
- 10.1. Market Analysis, Insights and Forecast - by Car Type
- 10.1.1. Passenger Cars
- 10.1.2. Sports Cars
- 10.2. Market Analysis, Insights and Forecast - by Material Type
- 10.2.1. Glass Fiber
- 10.2.2. Carbon Fiber
- 10.2.3. High-strength Steel
- 10.2.4. Other Material Types
- 10.1. Market Analysis, Insights and Forecast - by Car Type
- 11. North America Lightweight Vehicles Industry Analysis, Insights and Forecast, 2019-2031
- 11.1. Market Analysis, Insights and Forecast - By Country/Sub-region
- 11.1.1 United States
- 11.1.2 Canada
- 11.1.3 Rest of North America
- 12. Europe Lightweight Vehicles Industry Analysis, Insights and Forecast, 2019-2031
- 12.1. Market Analysis, Insights and Forecast - By Country/Sub-region
- 12.1.1 Germany
- 12.1.2 United Kingdom
- 12.1.3 France
- 12.1.4 Rest of Europe
- 13. Asia Pacific Lightweight Vehicles Industry Analysis, Insights and Forecast, 2019-2031
- 13.1. Market Analysis, Insights and Forecast - By Country/Sub-region
- 13.1.1 China
- 13.1.2 Japan
- 13.1.3 India
- 13.1.4 South Korea
- 13.1.5 Rest of Asia Pacific
- 14. South America Lightweight Vehicles Industry Analysis, Insights and Forecast, 2019-2031
- 14.1. Market Analysis, Insights and Forecast - By Country/Sub-region
- 14.1.1 Brazil
- 14.1.2 Rest of South America
- 15. Middle East and Africa Lightweight Vehicles Industry Analysis, Insights and Forecast, 2019-2031
- 15.1. Market Analysis, Insights and Forecast - By Country/Sub-region
- 15.1.1 United Arab Emirates
- 15.1.2 South Africa
- 15.1.3 Rest of Middle East and Africa
- 16. Competitive Analysis
- 16.1. Global Market Share Analysis 2024
- 16.2. Company Profiles
- 16.2.1 Ferrari SpA
- 16.2.1.1. Overview
- 16.2.1.2. Products
- 16.2.1.3. SWOT Analysis
- 16.2.1.4. Recent Developments
- 16.2.1.5. Financials (Based on Availability)
- 16.2.2 Lamborghini Sp
- 16.2.2.1. Overview
- 16.2.2.2. Products
- 16.2.2.3. SWOT Analysis
- 16.2.2.4. Recent Developments
- 16.2.2.5. Financials (Based on Availability)
- 16.2.3 Nissan Motor Co Ltd
- 16.2.3.1. Overview
- 16.2.3.2. Products
- 16.2.3.3. SWOT Analysis
- 16.2.3.4. Recent Developments
- 16.2.3.5. Financials (Based on Availability)
- 16.2.4 General Motors Company
- 16.2.4.1. Overview
- 16.2.4.2. Products
- 16.2.4.3. SWOT Analysis
- 16.2.4.4. Recent Developments
- 16.2.4.5. Financials (Based on Availability)
- 16.2.5 Kia Motors Corporation
- 16.2.5.1. Overview
- 16.2.5.2. Products
- 16.2.5.3. SWOT Analysis
- 16.2.5.4. Recent Developments
- 16.2.5.5. Financials (Based on Availability)
- 16.2.6 Hyundai Motor Co
- 16.2.6.1. Overview
- 16.2.6.2. Products
- 16.2.6.3. SWOT Analysis
- 16.2.6.4. Recent Developments
- 16.2.6.5. Financials (Based on Availability)
- 16.2.7 Toyota Motor Corporation
- 16.2.7.1. Overview
- 16.2.7.2. Products
- 16.2.7.3. SWOT Analysis
- 16.2.7.4. Recent Developments
- 16.2.7.5. Financials (Based on Availability)
- 16.2.8 Honda Motor Co Ltd
- 16.2.8.1. Overview
- 16.2.8.2. Products
- 16.2.8.3. SWOT Analysis
- 16.2.8.4. Recent Developments
- 16.2.8.5. Financials (Based on Availability)
- 16.2.9 Volkswagen
- 16.2.9.1. Overview
- 16.2.9.2. Products
- 16.2.9.3. SWOT Analysis
- 16.2.9.4. Recent Developments
- 16.2.9.5. Financials (Based on Availability)
- 16.2.10 Ford Motor Company
- 16.2.10.1. Overview
- 16.2.10.2. Products
- 16.2.10.3. SWOT Analysis
- 16.2.10.4. Recent Developments
- 16.2.10.5. Financials (Based on Availability)
- 16.2.1 Ferrari SpA
List of Figures
- Figure 1: Global Lightweight Vehicles Industry Revenue Breakdown (Million, %) by Region 2024 & 2032
- Figure 2: North America Lightweight Vehicles Industry Revenue (Million), by Country 2024 & 2032
- Figure 3: North America Lightweight Vehicles Industry Revenue Share (%), by Country 2024 & 2032
- Figure 4: Europe Lightweight Vehicles Industry Revenue (Million), by Country 2024 & 2032
- Figure 5: Europe Lightweight Vehicles Industry Revenue Share (%), by Country 2024 & 2032
- Figure 6: Asia Pacific Lightweight Vehicles Industry Revenue (Million), by Country 2024 & 2032
- Figure 7: Asia Pacific Lightweight Vehicles Industry Revenue Share (%), by Country 2024 & 2032
- Figure 8: South America Lightweight Vehicles Industry Revenue (Million), by Country 2024 & 2032
- Figure 9: South America Lightweight Vehicles Industry Revenue Share (%), by Country 2024 & 2032
- Figure 10: Middle East and Africa Lightweight Vehicles Industry Revenue (Million), by Country 2024 & 2032
- Figure 11: Middle East and Africa Lightweight Vehicles Industry Revenue Share (%), by Country 2024 & 2032
- Figure 12: North America Lightweight Vehicles Industry Revenue (Million), by Car Type 2024 & 2032
- Figure 13: North America Lightweight Vehicles Industry Revenue Share (%), by Car Type 2024 & 2032
- Figure 14: North America Lightweight Vehicles Industry Revenue (Million), by Material Type 2024 & 2032
- Figure 15: North America Lightweight Vehicles Industry Revenue Share (%), by Material Type 2024 & 2032
- Figure 16: North America Lightweight Vehicles Industry Revenue (Million), by Country 2024 & 2032
- Figure 17: North America Lightweight Vehicles Industry Revenue Share (%), by Country 2024 & 2032
- Figure 18: Europe Lightweight Vehicles Industry Revenue (Million), by Car Type 2024 & 2032
- Figure 19: Europe Lightweight Vehicles Industry Revenue Share (%), by Car Type 2024 & 2032
- Figure 20: Europe Lightweight Vehicles Industry Revenue (Million), by Material Type 2024 & 2032
- Figure 21: Europe Lightweight Vehicles Industry Revenue Share (%), by Material Type 2024 & 2032
- Figure 22: Europe Lightweight Vehicles Industry Revenue (Million), by Country 2024 & 2032
- Figure 23: Europe Lightweight Vehicles Industry Revenue Share (%), by Country 2024 & 2032
- Figure 24: Asia Pacific Lightweight Vehicles Industry Revenue (Million), by Car Type 2024 & 2032
- Figure 25: Asia Pacific Lightweight Vehicles Industry Revenue Share (%), by Car Type 2024 & 2032
- Figure 26: Asia Pacific Lightweight Vehicles Industry Revenue (Million), by Material Type 2024 & 2032
- Figure 27: Asia Pacific Lightweight Vehicles Industry Revenue Share (%), by Material Type 2024 & 2032
- Figure 28: Asia Pacific Lightweight Vehicles Industry Revenue (Million), by Country 2024 & 2032
- Figure 29: Asia Pacific Lightweight Vehicles Industry Revenue Share (%), by Country 2024 & 2032
- Figure 30: South America Lightweight Vehicles Industry Revenue (Million), by Car Type 2024 & 2032
- Figure 31: South America Lightweight Vehicles Industry Revenue Share (%), by Car Type 2024 & 2032
- Figure 32: South America Lightweight Vehicles Industry Revenue (Million), by Material Type 2024 & 2032
- Figure 33: South America Lightweight Vehicles Industry Revenue Share (%), by Material Type 2024 & 2032
- Figure 34: South America Lightweight Vehicles Industry Revenue (Million), by Country 2024 & 2032
- Figure 35: South America Lightweight Vehicles Industry Revenue Share (%), by Country 2024 & 2032
- Figure 36: Middle East and Africa Lightweight Vehicles Industry Revenue (Million), by Car Type 2024 & 2032
- Figure 37: Middle East and Africa Lightweight Vehicles Industry Revenue Share (%), by Car Type 2024 & 2032
- Figure 38: Middle East and Africa Lightweight Vehicles Industry Revenue (Million), by Material Type 2024 & 2032
- Figure 39: Middle East and Africa Lightweight Vehicles Industry Revenue Share (%), by Material Type 2024 & 2032
- Figure 40: Middle East and Africa Lightweight Vehicles Industry Revenue (Million), by Country 2024 & 2032
- Figure 41: Middle East and Africa Lightweight Vehicles Industry Revenue Share (%), by Country 2024 & 2032
List of Tables
- Table 1: Global Lightweight Vehicles Industry Revenue Million Forecast, by Region 2019 & 2032
- Table 2: Global Lightweight Vehicles Industry Revenue Million Forecast, by Car Type 2019 & 2032
- Table 3: Global Lightweight Vehicles Industry Revenue Million Forecast, by Material Type 2019 & 2032
- Table 4: Global Lightweight Vehicles Industry Revenue Million Forecast, by Region 2019 & 2032
- Table 5: Global Lightweight Vehicles Industry Revenue Million Forecast, by Country 2019 & 2032
- Table 6: United States Lightweight Vehicles Industry Revenue (Million) Forecast, by Application 2019 & 2032
- Table 7: Canada Lightweight Vehicles Industry Revenue (Million) Forecast, by Application 2019 & 2032
- Table 8: Rest of North America Lightweight Vehicles Industry Revenue (Million) Forecast, by Application 2019 & 2032
- Table 9: Global Lightweight Vehicles Industry Revenue Million Forecast, by Country 2019 & 2032
- Table 10: Germany Lightweight Vehicles Industry Revenue (Million) Forecast, by Application 2019 & 2032
- Table 11: United Kingdom Lightweight Vehicles Industry Revenue (Million) Forecast, by Application 2019 & 2032
- Table 12: France Lightweight Vehicles Industry Revenue (Million) Forecast, by Application 2019 & 2032
- Table 13: Rest of Europe Lightweight Vehicles Industry Revenue (Million) Forecast, by Application 2019 & 2032
- Table 14: Global Lightweight Vehicles Industry Revenue Million Forecast, by Country 2019 & 2032
- Table 15: China Lightweight Vehicles Industry Revenue (Million) Forecast, by Application 2019 & 2032
- Table 16: Japan Lightweight Vehicles Industry Revenue (Million) Forecast, by Application 2019 & 2032
- Table 17: India Lightweight Vehicles Industry Revenue (Million) Forecast, by Application 2019 & 2032
- Table 18: South Korea Lightweight Vehicles Industry Revenue (Million) Forecast, by Application 2019 & 2032
- Table 19: Rest of Asia Pacific Lightweight Vehicles Industry Revenue (Million) Forecast, by Application 2019 & 2032
- Table 20: Global Lightweight Vehicles Industry Revenue Million Forecast, by Country 2019 & 2032
- Table 21: Brazil Lightweight Vehicles Industry Revenue (Million) Forecast, by Application 2019 & 2032
- Table 22: Rest of South America Lightweight Vehicles Industry Revenue (Million) Forecast, by Application 2019 & 2032
- Table 23: Global Lightweight Vehicles Industry Revenue Million Forecast, by Country 2019 & 2032
- Table 24: United Arab Emirates Lightweight Vehicles Industry Revenue (Million) Forecast, by Application 2019 & 2032
- Table 25: South Africa Lightweight Vehicles Industry Revenue (Million) Forecast, by Application 2019 & 2032
- Table 26: Rest of Middle East and Africa Lightweight Vehicles Industry Revenue (Million) Forecast, by Application 2019 & 2032
- Table 27: Global Lightweight Vehicles Industry Revenue Million Forecast, by Car Type 2019 & 2032
- Table 28: Global Lightweight Vehicles Industry Revenue Million Forecast, by Material Type 2019 & 2032
- Table 29: Global Lightweight Vehicles Industry Revenue Million Forecast, by Country 2019 & 2032
- Table 30: United States Lightweight Vehicles Industry Revenue (Million) Forecast, by Application 2019 & 2032
- Table 31: Canada Lightweight Vehicles Industry Revenue (Million) Forecast, by Application 2019 & 2032
- Table 32: Rest of North America Lightweight Vehicles Industry Revenue (Million) Forecast, by Application 2019 & 2032
- Table 33: Global Lightweight Vehicles Industry Revenue Million Forecast, by Car Type 2019 & 2032
- Table 34: Global Lightweight Vehicles Industry Revenue Million Forecast, by Material Type 2019 & 2032
- Table 35: Global Lightweight Vehicles Industry Revenue Million Forecast, by Country 2019 & 2032
- Table 36: Germany Lightweight Vehicles Industry Revenue (Million) Forecast, by Application 2019 & 2032
- Table 37: United Kingdom Lightweight Vehicles Industry Revenue (Million) Forecast, by Application 2019 & 2032
- Table 38: France Lightweight Vehicles Industry Revenue (Million) Forecast, by Application 2019 & 2032
- Table 39: Rest of Europe Lightweight Vehicles Industry Revenue (Million) Forecast, by Application 2019 & 2032
- Table 40: Global Lightweight Vehicles Industry Revenue Million Forecast, by Car Type 2019 & 2032
- Table 41: Global Lightweight Vehicles Industry Revenue Million Forecast, by Material Type 2019 & 2032
- Table 42: Global Lightweight Vehicles Industry Revenue Million Forecast, by Country 2019 & 2032
- Table 43: China Lightweight Vehicles Industry Revenue (Million) Forecast, by Application 2019 & 2032
- Table 44: Japan Lightweight Vehicles Industry Revenue (Million) Forecast, by Application 2019 & 2032
- Table 45: India Lightweight Vehicles Industry Revenue (Million) Forecast, by Application 2019 & 2032
- Table 46: South Korea Lightweight Vehicles Industry Revenue (Million) Forecast, by Application 2019 & 2032
- Table 47: Rest of Asia Pacific Lightweight Vehicles Industry Revenue (Million) Forecast, by Application 2019 & 2032
- Table 48: Global Lightweight Vehicles Industry Revenue Million Forecast, by Car Type 2019 & 2032
- Table 49: Global Lightweight Vehicles Industry Revenue Million Forecast, by Material Type 2019 & 2032
- Table 50: Global Lightweight Vehicles Industry Revenue Million Forecast, by Country 2019 & 2032
- Table 51: Brazil Lightweight Vehicles Industry Revenue (Million) Forecast, by Application 2019 & 2032
- Table 52: Rest of South America Lightweight Vehicles Industry Revenue (Million) Forecast, by Application 2019 & 2032
- Table 53: Global Lightweight Vehicles Industry Revenue Million Forecast, by Car Type 2019 & 2032
- Table 54: Global Lightweight Vehicles Industry Revenue Million Forecast, by Material Type 2019 & 2032
- Table 55: Global Lightweight Vehicles Industry Revenue Million Forecast, by Country 2019 & 2032
- Table 56: United Arab Emirates Lightweight Vehicles Industry Revenue (Million) Forecast, by Application 2019 & 2032
- Table 57: South Africa Lightweight Vehicles Industry Revenue (Million) Forecast, by Application 2019 & 2032
- Table 58: Rest of Middle East and Africa Lightweight Vehicles Industry Revenue (Million) Forecast, by Application 2019 & 2032
Frequently Asked Questions
1. What is the projected Compound Annual Growth Rate (CAGR) of the Lightweight Vehicles Industry?
The projected CAGR is approximately 5.32%.
2. Which companies are prominent players in the Lightweight Vehicles Industry?
Key companies in the market include Ferrari SpA, Lamborghini Sp, Nissan Motor Co Ltd, General Motors Company, Kia Motors Corporation, Hyundai Motor Co, Toyota Motor Corporation, Honda Motor Co Ltd, Volkswagen, Ford Motor Company.
3. What are the main segments of the Lightweight Vehicles Industry?
The market segments include Car Type, Material Type.
4. Can you provide details about the market size?
The market size is estimated to be USD 73.72 Million as of 2022.
5. What are some drivers contributing to market growth?
Technological Innovations and Material Advancements is Likely to Fuel Demand.
6. What are the notable trends driving market growth?
Increasing Demand for Lightweight Passenger Cars.
7. Are there any restraints impacting market growth?
High Cost of Lightweight Materials is Anticipated to Restrict the Market Growth Potential.
8. Can you provide examples of recent developments in the market?
In November 2023, Huawei is partnering with Changan Auto, a Chinese car manufacturer to create a new entity for the development of sophisticated automotive systems and components. In this joint venture, Huawei will hold a significant share with Changan Auto's ownership not surpassing 40%.
9. What pricing options are available for accessing the report?
Pricing options include single-user, multi-user, and enterprise licenses priced at USD 4750, USD 5250, and USD 8750 respectively.
10. Is the market size provided in terms of value or volume?
The market size is provided in terms of value, measured in Million.
11. Are there any specific market keywords associated with the report?
Yes, the market keyword associated with the report is "Lightweight Vehicles Industry," which aids in identifying and referencing the specific market segment covered.
12. How do I determine which pricing option suits my needs best?
The pricing options vary based on user requirements and access needs. Individual users may opt for single-user licenses, while businesses requiring broader access may choose multi-user or enterprise licenses for cost-effective access to the report.
13. Are there any additional resources or data provided in the Lightweight Vehicles Industry report?
While the report offers comprehensive insights, it's advisable to review the specific contents or supplementary materials provided to ascertain if additional resources or data are available.
14. How can I stay updated on further developments or reports in the Lightweight Vehicles Industry?
To stay informed about further developments, trends, and reports in the Lightweight Vehicles Industry, consider subscribing to industry newsletters, following relevant companies and organizations, or regularly checking reputable industry news sources and publications.
Methodology
Step 1 - Identification of Relevant Samples Size from Population Database


Step 2 - Approaches for Defining Global Market Size (Value, Volume* & Price*)

Note*: In applicable scenarios
Step 3 - Data Sources
Primary Research
- Web Analytics
- Survey Reports
- Research Institute
- Latest Research Reports
- Opinion Leaders
Secondary Research
- Annual Reports
- White Paper
- Latest Press Release
- Industry Association
- Paid Database
- Investor Presentations

Step 4 - Data Triangulation
Involves using different sources of information in order to increase the validity of a study
These sources are likely to be stakeholders in a program - participants, other researchers, program staff, other community members, and so on.
Then we put all data in single framework & apply various statistical tools to find out the dynamic on the market.
During the analysis stage, feedback from the stakeholder groups would be compared to determine areas of agreement as well as areas of divergence


