
Key Insights
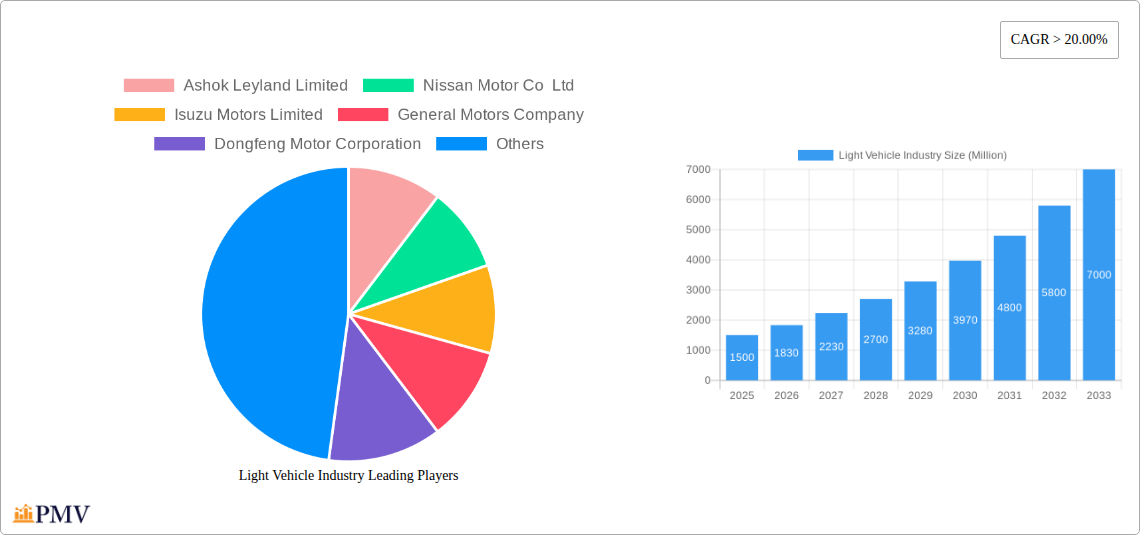
The light vehicle market, encompassing commercial vehicles and passenger cars with LPG and hybrid/electric propulsion, exhibits robust growth potential. A compound annual growth rate (CAGR) exceeding 20% from 2019 to 2033 indicates a rapidly expanding sector driven by several key factors. The increasing adoption of cleaner energy solutions, such as LPG and hybrid/electric vehicles, is a major catalyst, spurred by government regulations aimed at reducing carbon emissions and improving air quality. Furthermore, technological advancements in battery technology and charging infrastructure are making electric vehicles more accessible and attractive to consumers. The growing urbanization and rising disposable incomes in developing economies also contribute significantly to market expansion, increasing demand for personal and commercial vehicles. While supply chain constraints and fluctuating fuel prices could pose some challenges, the overall outlook remains positive. The market is segmented by vehicle type (commercial and passenger) and propulsion type (LPG, hybrid, and electric), with key players like Ashok Leyland, Nissan, Isuzu, and Tata Motors competing for market share. Competition is fierce, driving innovation and the introduction of new, technologically advanced vehicles. The market's expansion is expected to continue at a high rate for the forecast period of 2025-2033 due to the continued growth of developing economies and the increasing adoption of sustainable transportation solutions.
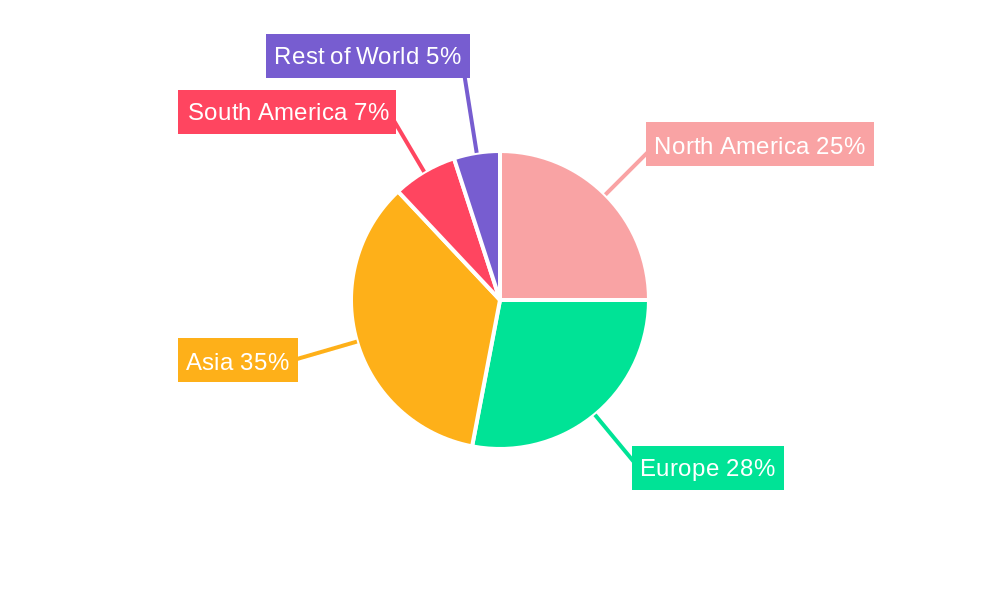
The global light vehicle market is geographically diverse, with regional variations in growth rates influenced by factors such as economic development, government policies, and consumer preferences. North America and Europe currently hold significant market shares, but emerging markets in Asia and South America are demonstrating rapid growth, presenting lucrative opportunities for manufacturers. Strategic partnerships, mergers and acquisitions, and investments in research and development are crucial for companies to maintain their competitive edge. Companies are focusing on enhancing fuel efficiency, safety features, and connectivity capabilities to attract customers. The shift towards electric and hybrid vehicles is transforming the industry landscape, necessitating substantial investments in charging infrastructure and battery technology. The future growth of the market hinges on addressing challenges related to infrastructure development, battery life, and the overall cost of electric vehicles to ensure widespread adoption.
Light Vehicle Industry Market Report: 2019-2033
This comprehensive report provides a detailed analysis of the global light vehicle industry, offering invaluable insights for stakeholders across the value chain. The study period spans from 2019 to 2033, with 2025 serving as the base and estimated year. The report forecasts market trends from 2025 to 2033, leveraging data from the historical period (2019-2024). Key segments analyzed include Commercial Vehicles, LPG vehicles, Hybrid and Electric Vehicles. Leading players such as Ashok Leyland Limited, Nissan Motor Co Ltd, Isuzu Motors Limited, General Motors Company, and many more are profiled, providing a 360-degree view of this dynamic market. The report’s value surpasses $xx Million.
Light Vehicle Industry Market Structure & Competitive Dynamics
The global light vehicle industry is characterized by a complex interplay of factors impacting market concentration, innovation, and competitive dynamics. Market share is highly fragmented, with a few large players dominating specific segments and many smaller players vying for market space. The top 10 players account for approximately xx% of the global market share (2024). The industry exhibits a moderate level of concentration, with the Herfindahl-Hirschman Index (HHI) standing at approximately xx.
- Market Concentration: The market is characterized by a mix of global giants and regional players, leading to varying degrees of concentration across different geographical regions and vehicle segments. The concentration is higher in segments like commercial vehicles than in passenger cars.
- Innovation Ecosystems: Significant investments in R&D and collaborations between OEMs, Tier-1 suppliers, and technology companies are driving innovation in areas like electric vehicles (EVs), autonomous driving, and connected car technologies. The average R&D expenditure for major players is approximately $xx Million annually.
- Regulatory Frameworks: Stringent emission norms, fuel efficiency standards, and safety regulations significantly influence the industry landscape, driving the adoption of cleaner and safer vehicles. These regulatory changes also create opportunities for companies that are early adopters of new technologies.
- Product Substitutes: The rise of alternative transportation modes like ride-sharing services and public transportation poses a moderate threat to light vehicle sales, particularly in urban areas. However, the increasing need for personal mobility and the limitations of public transport in many regions continue to fuel demand for light vehicles.
- End-User Trends: Consumer preferences are shifting towards fuel-efficient, technologically advanced, and safer vehicles, which is driving innovation in areas like hybrid and electric powertrains, advanced driver-assistance systems (ADAS), and infotainment features.
- M&A Activities: The light vehicle industry witnesses significant merger and acquisition (M&A) activity. Deal values vary widely, but major transactions are often in the range of $xx Million to $xx Million, driven by companies seeking to expand their market share, gain access to new technologies, or enhance their geographical footprint. For example, the average M&A deal value in the past five years was approximately $xx Million.
Light Vehicle Industry Industry Trends & Insights
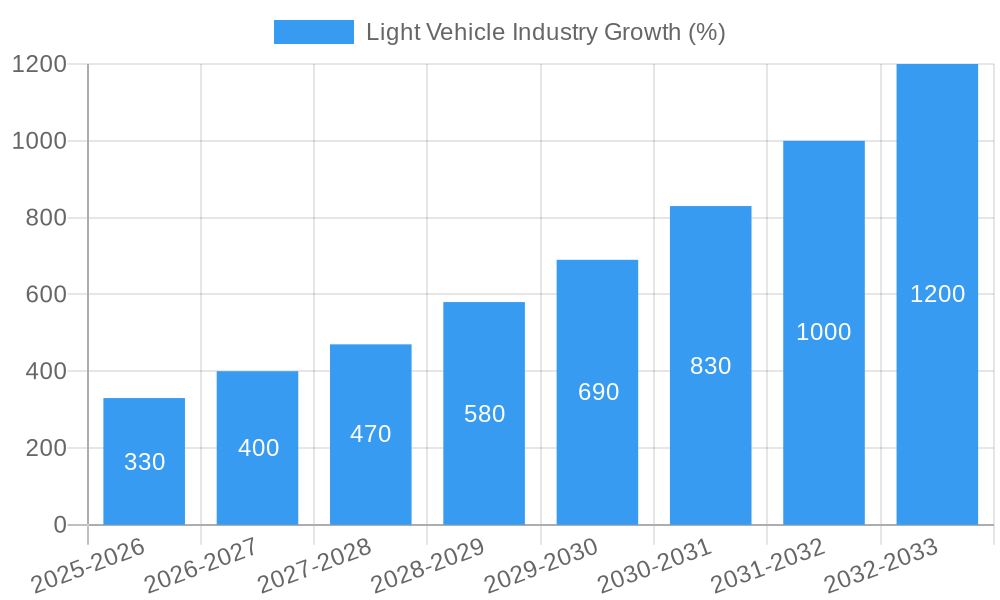
The global light vehicle industry is undergoing a period of significant transformation driven by several key trends. The market is projected to experience a Compound Annual Growth Rate (CAGR) of xx% during the forecast period (2025-2033), reaching a total market value of $xx Million by 2033. This growth is primarily driven by increasing urbanization, rising disposable incomes in emerging economies, and the growing preference for personal mobility.
Technological disruptions, including the rapid advancement of electric vehicles (EVs), autonomous driving technology, and connected car features, are reshaping the industry landscape. The market penetration of EVs is expected to increase significantly from xx% in 2025 to xx% by 2033. Consumer preferences are shifting towards environmentally friendly vehicles, leading to increased demand for hybrid and electric vehicles. The rising popularity of SUVs and crossovers continues to drive market growth in specific segments. Intense competition among major players is fueling innovation and driving down prices. The rising cost of raw materials and supply chain disruptions continue to pose significant challenges to the industry. Government policies, such as incentives for EV adoption and regulations on emissions, play a vital role in shaping market dynamics.
Dominant Markets & Segments in Light Vehicle Industry
The Asia-Pacific region is currently the dominant market for light vehicles, driven by factors such as rapid economic growth, increasing urbanization, and a large and growing middle class. Within this region, China, India and other Southeast Asian countries are key markets.
Key Drivers:
- Economic Policies: Supportive government policies in several Asian countries, including subsidies for EV purchases and tax incentives for automotive manufacturers, are fueling market growth.
- Infrastructure Development: Investments in infrastructure, including road networks and charging stations for EVs, are facilitating the adoption of light vehicles.
- Consumer Preferences: Growing demand for personal vehicles, especially among young adults and middle-class families, is driving sales.
Dominant Segments:
- Commercial Vehicles: This segment is experiencing strong growth, driven by the expansion of e-commerce and the increasing demand for logistics services.
- LPG Vehicles: While currently a niche market, LPG vehicles continue to maintain a segment due to lower running costs in comparison to gasoline and lower emissions compared to diesel.
- Hybrid and Electric Vehicles (HEVs & EVs): This segment is experiencing the fastest growth, driven by government regulations, environmental concerns, and technological advancements. The dominance of this segment is projected to increase dramatically in the coming years.
Detailed analysis reveals that the commercial vehicle segment within the Asia-Pacific region dominates the overall light vehicle market, exhibiting the highest growth rate.
Light Vehicle Industry Product Innovations
Recent innovations in the light vehicle industry focus on enhancing fuel efficiency, safety, and connectivity. Advancements in battery technology and electric motor designs are driving the development of longer-range and more affordable electric vehicles. The integration of advanced driver-assistance systems (ADAS) like lane departure warning and automatic emergency braking is becoming increasingly prevalent. Connectivity features like infotainment systems and over-the-air updates are transforming the user experience. These technological advancements are improving vehicle performance, safety, and convenience, attracting more buyers and driving market growth. The increasing focus on sustainable materials and manufacturing processes is also shaping product development.
Report Segmentation & Scope
This report segments the light vehicle industry based on vehicle type (Commercial Vehicles, Passenger Vehicles), fuel type (LPG, Gasoline, Diesel, Hybrid, Electric), propulsion type (ICE, Hybrid, Electric), and region (North America, Europe, Asia-Pacific, etc.). Each segment provides a detailed market size, growth projections, and competitive landscape analysis. For instance, the electric vehicle segment is expected to experience significant growth over the forecast period, driven by government regulations and increasing consumer demand. The commercial vehicle segment is projected to continue its strong performance, fueled by the growth in e-commerce and logistics. Regional variations in growth rates are also addressed, providing a granular understanding of market dynamics.
Key Drivers of Light Vehicle Industry Growth
Several factors are driving the growth of the light vehicle industry. Technological advancements, particularly in electric and hybrid vehicles, are fueling market expansion. Economic growth and rising disposable incomes in emerging economies are leading to increased vehicle ownership. Government regulations aimed at improving fuel efficiency and reducing emissions are stimulating innovation and driving demand for cleaner vehicles. The increasing urbanization across the globe is augmenting the demand for personal vehicles, while improvements in infrastructure also make vehicle ownership more convenient and appealing.
Challenges in the Light Vehicle Industry Sector
The light vehicle industry faces several challenges. Stringent emission regulations and rising raw material costs are increasing production costs, putting pressure on profit margins. Supply chain disruptions due to geopolitical uncertainties and global pandemics cause production delays and negatively impact deliveries. Intense competition among established and new market entrants creates pricing pressures and necessitates continuous innovation. Furthermore, consumer preference shifts towards electric vehicles (EVs) and other greener technologies necessitate substantial investments in research and development, alongside the development of related infrastructure.
Leading Players in the Light Vehicle Industry Market
- Ashok Leyland Limited
- Nissan Motor Co Ltd
- Isuzu Motors Limited
- General Motors Company
- Dongfeng Motor Corporation
- Volkswagen AG
- Daimler AG (Mercedes-Benz AG)
- Tata Motors Limited
- BAIC Motor Corporation Ltd
- Volvo Group
- Mahindra & Mahindra Limited
- BYD Auto Co Ltd
- Groupe Renault
- Rivian Automotive Inc
- Ford Motor Company
Key Developments in Light Vehicle Industry Sector
- August 2023: General Motors will launch an all-electric Cadillac Escalade in late 2024. This signals a significant commitment to the EV market and could accelerate the adoption of electric luxury vehicles.
- August 2023: General Motors doubles down on plans for an electric future in the Middle East. This highlights the growing importance of the Middle Eastern market for EV manufacturers.
- August 2023: Gabriel India Limited (Gabriel India), a flagship company of Anand Group, announced the development of components for Maruti Suzuki Jimny and Stellantis electric Citroen C3 and is currently developing parts for new models of VW, Tata, Stellantis, Mahindra, and Maruti Suzuki. This signifies the increasing role of Tier-1 suppliers in the development of new light vehicles and the expanding supply chain for electric vehicles.
Strategic Light Vehicle Industry Market Outlook
The light vehicle industry presents significant growth opportunities over the next decade. The increasing adoption of electric and hybrid vehicles, driven by environmental concerns and supportive government policies, is a major growth accelerator. Technological advancements in autonomous driving, connectivity, and safety features will continue to shape the market. The strategic focus should be on innovation, strategic partnerships, and efficient supply chain management to navigate the challenges and capitalize on emerging opportunities. Expanding into new markets, particularly in developing economies, also holds significant potential. The industry’s future depends on effectively addressing sustainability concerns and adopting innovative technologies to meet evolving consumer demands.
Light Vehicle Industry Segmentation
-
1. Vehicle Type
-
1.1. Commercial Vehicles
- 1.1.1. Light Commercial Pick-up Trucks
- 1.1.2. Light Commercial Vans
-
1.1. Commercial Vehicles
-
2. Propulsion Type
-
2.1. Hybrid and Electric Vehicles
-
2.1.1. By Fuel Category
- 2.1.1.1. BEV
- 2.1.1.2. FCEV
- 2.1.1.3. HEV
- 2.1.1.4. PHEV
-
2.1.1. By Fuel Category
-
2.2. ICE
- 2.2.1. CNG
- 2.2.2. Diesel
- 2.2.3. Gasoline
- 2.2.4. LPG
-
2.1. Hybrid and Electric Vehicles
Light Vehicle Industry Segmentation By Geography
-
1. North America
- 1.1. United States
- 1.2. Canada
- 1.3. Mexico
-
2. South America
- 2.1. Brazil
- 2.2. Argentina
- 2.3. Rest of South America
-
3. Europe
- 3.1. United Kingdom
- 3.2. Germany
- 3.3. France
- 3.4. Italy
- 3.5. Spain
- 3.6. Russia
- 3.7. Benelux
- 3.8. Nordics
- 3.9. Rest of Europe
-
4. Middle East & Africa
- 4.1. Turkey
- 4.2. Israel
- 4.3. GCC
- 4.4. North Africa
- 4.5. South Africa
- 4.6. Rest of Middle East & Africa
-
5. Asia Pacific
- 5.1. China
- 5.2. India
- 5.3. Japan
- 5.4. South Korea
- 5.5. ASEAN
- 5.6. Oceania
- 5.7. Rest of Asia Pacific
Light Vehicle Industry REPORT HIGHLIGHTS
| Aspects | Details |
|---|---|
| Study Period | 2019-2033 |
| Base Year | 2024 |
| Estimated Year | 2025 |
| Forecast Period | 2025-2033 |
| Historical Period | 2019-2024 |
| Growth Rate | CAGR of > 20.00% from 2019-2033 |
| Segmentation |
|
Table of Contents
- 1. Introduction
- 1.1. Research Scope
- 1.2. Market Segmentation
- 1.3. Research Methodology
- 1.4. Definitions and Assumptions
- 2. Executive Summary
- 2.1. Introduction
- 3. Market Dynamics
- 3.1. Introduction
- 3.2. Market Drivers
- 3.2.1. Growing Travel and Tourism Industry is Driving the Car Rental Market
- 3.3. Market Restrains
- 3.3.1. Increasing Popularity of Ride-Sharing Services Pose Challenges for the Conventional Car Rental Market
- 3.4. Market Trends
- 3.4.1. OTHER KEY INDUSTRY TRENDS COVERED IN THE REPORT
- 4. Market Factor Analysis
- 4.1. Porters Five Forces
- 4.2. Supply/Value Chain
- 4.3. PESTEL analysis
- 4.4. Market Entropy
- 4.5. Patent/Trademark Analysis
- 5. Global Light Vehicle Industry Analysis, Insights and Forecast, 2019-2031
- 5.1. Market Analysis, Insights and Forecast - by Vehicle Type
- 5.1.1. Commercial Vehicles
- 5.1.1.1. Light Commercial Pick-up Trucks
- 5.1.1.2. Light Commercial Vans
- 5.1.1. Commercial Vehicles
- 5.2. Market Analysis, Insights and Forecast - by Propulsion Type
- 5.2.1. Hybrid and Electric Vehicles
- 5.2.1.1. By Fuel Category
- 5.2.1.1.1. BEV
- 5.2.1.1.2. FCEV
- 5.2.1.1.3. HEV
- 5.2.1.1.4. PHEV
- 5.2.1.1. By Fuel Category
- 5.2.2. ICE
- 5.2.2.1. CNG
- 5.2.2.2. Diesel
- 5.2.2.3. Gasoline
- 5.2.2.4. LPG
- 5.2.1. Hybrid and Electric Vehicles
- 5.3. Market Analysis, Insights and Forecast - by Region
- 5.3.1. North America
- 5.3.2. South America
- 5.3.3. Europe
- 5.3.4. Middle East & Africa
- 5.3.5. Asia Pacific
- 5.1. Market Analysis, Insights and Forecast - by Vehicle Type
- 6. North America Light Vehicle Industry Analysis, Insights and Forecast, 2019-2031
- 6.1. Market Analysis, Insights and Forecast - by Vehicle Type
- 6.1.1. Commercial Vehicles
- 6.1.1.1. Light Commercial Pick-up Trucks
- 6.1.1.2. Light Commercial Vans
- 6.1.1. Commercial Vehicles
- 6.2. Market Analysis, Insights and Forecast - by Propulsion Type
- 6.2.1. Hybrid and Electric Vehicles
- 6.2.1.1. By Fuel Category
- 6.2.1.1.1. BEV
- 6.2.1.1.2. FCEV
- 6.2.1.1.3. HEV
- 6.2.1.1.4. PHEV
- 6.2.1.1. By Fuel Category
- 6.2.2. ICE
- 6.2.2.1. CNG
- 6.2.2.2. Diesel
- 6.2.2.3. Gasoline
- 6.2.2.4. LPG
- 6.2.1. Hybrid and Electric Vehicles
- 6.1. Market Analysis, Insights and Forecast - by Vehicle Type
- 7. South America Light Vehicle Industry Analysis, Insights and Forecast, 2019-2031
- 7.1. Market Analysis, Insights and Forecast - by Vehicle Type
- 7.1.1. Commercial Vehicles
- 7.1.1.1. Light Commercial Pick-up Trucks
- 7.1.1.2. Light Commercial Vans
- 7.1.1. Commercial Vehicles
- 7.2. Market Analysis, Insights and Forecast - by Propulsion Type
- 7.2.1. Hybrid and Electric Vehicles
- 7.2.1.1. By Fuel Category
- 7.2.1.1.1. BEV
- 7.2.1.1.2. FCEV
- 7.2.1.1.3. HEV
- 7.2.1.1.4. PHEV
- 7.2.1.1. By Fuel Category
- 7.2.2. ICE
- 7.2.2.1. CNG
- 7.2.2.2. Diesel
- 7.2.2.3. Gasoline
- 7.2.2.4. LPG
- 7.2.1. Hybrid and Electric Vehicles
- 7.1. Market Analysis, Insights and Forecast - by Vehicle Type
- 8. Europe Light Vehicle Industry Analysis, Insights and Forecast, 2019-2031
- 8.1. Market Analysis, Insights and Forecast - by Vehicle Type
- 8.1.1. Commercial Vehicles
- 8.1.1.1. Light Commercial Pick-up Trucks
- 8.1.1.2. Light Commercial Vans
- 8.1.1. Commercial Vehicles
- 8.2. Market Analysis, Insights and Forecast - by Propulsion Type
- 8.2.1. Hybrid and Electric Vehicles
- 8.2.1.1. By Fuel Category
- 8.2.1.1.1. BEV
- 8.2.1.1.2. FCEV
- 8.2.1.1.3. HEV
- 8.2.1.1.4. PHEV
- 8.2.1.1. By Fuel Category
- 8.2.2. ICE
- 8.2.2.1. CNG
- 8.2.2.2. Diesel
- 8.2.2.3. Gasoline
- 8.2.2.4. LPG
- 8.2.1. Hybrid and Electric Vehicles
- 8.1. Market Analysis, Insights and Forecast - by Vehicle Type
- 9. Middle East & Africa Light Vehicle Industry Analysis, Insights and Forecast, 2019-2031
- 9.1. Market Analysis, Insights and Forecast - by Vehicle Type
- 9.1.1. Commercial Vehicles
- 9.1.1.1. Light Commercial Pick-up Trucks
- 9.1.1.2. Light Commercial Vans
- 9.1.1. Commercial Vehicles
- 9.2. Market Analysis, Insights and Forecast - by Propulsion Type
- 9.2.1. Hybrid and Electric Vehicles
- 9.2.1.1. By Fuel Category
- 9.2.1.1.1. BEV
- 9.2.1.1.2. FCEV
- 9.2.1.1.3. HEV
- 9.2.1.1.4. PHEV
- 9.2.1.1. By Fuel Category
- 9.2.2. ICE
- 9.2.2.1. CNG
- 9.2.2.2. Diesel
- 9.2.2.3. Gasoline
- 9.2.2.4. LPG
- 9.2.1. Hybrid and Electric Vehicles
- 9.1. Market Analysis, Insights and Forecast - by Vehicle Type
- 10. Asia Pacific Light Vehicle Industry Analysis, Insights and Forecast, 2019-2031
- 10.1. Market Analysis, Insights and Forecast - by Vehicle Type
- 10.1.1. Commercial Vehicles
- 10.1.1.1. Light Commercial Pick-up Trucks
- 10.1.1.2. Light Commercial Vans
- 10.1.1. Commercial Vehicles
- 10.2. Market Analysis, Insights and Forecast - by Propulsion Type
- 10.2.1. Hybrid and Electric Vehicles
- 10.2.1.1. By Fuel Category
- 10.2.1.1.1. BEV
- 10.2.1.1.2. FCEV
- 10.2.1.1.3. HEV
- 10.2.1.1.4. PHEV
- 10.2.1.1. By Fuel Category
- 10.2.2. ICE
- 10.2.2.1. CNG
- 10.2.2.2. Diesel
- 10.2.2.3. Gasoline
- 10.2.2.4. LPG
- 10.2.1. Hybrid and Electric Vehicles
- 10.1. Market Analysis, Insights and Forecast - by Vehicle Type
- 11. Competitive Analysis
- 11.1. Global Market Share Analysis 2024
- 11.2. Company Profiles
- 11.2.1 Ashok Leyland Limited
- 11.2.1.1. Overview
- 11.2.1.2. Products
- 11.2.1.3. SWOT Analysis
- 11.2.1.4. Recent Developments
- 11.2.1.5. Financials (Based on Availability)
- 11.2.2 Nissan Motor Co Ltd
- 11.2.2.1. Overview
- 11.2.2.2. Products
- 11.2.2.3. SWOT Analysis
- 11.2.2.4. Recent Developments
- 11.2.2.5. Financials (Based on Availability)
- 11.2.3 Isuzu Motors Limited
- 11.2.3.1. Overview
- 11.2.3.2. Products
- 11.2.3.3. SWOT Analysis
- 11.2.3.4. Recent Developments
- 11.2.3.5. Financials (Based on Availability)
- 11.2.4 General Motors Company
- 11.2.4.1. Overview
- 11.2.4.2. Products
- 11.2.4.3. SWOT Analysis
- 11.2.4.4. Recent Developments
- 11.2.4.5. Financials (Based on Availability)
- 11.2.5 Dongfeng Motor Corporation
- 11.2.5.1. Overview
- 11.2.5.2. Products
- 11.2.5.3. SWOT Analysis
- 11.2.5.4. Recent Developments
- 11.2.5.5. Financials (Based on Availability)
- 11.2.6 Volkswagen AG
- 11.2.6.1. Overview
- 11.2.6.2. Products
- 11.2.6.3. SWOT Analysis
- 11.2.6.4. Recent Developments
- 11.2.6.5. Financials (Based on Availability)
- 11.2.7 Daimler AG (Mercedes-Benz AG)
- 11.2.7.1. Overview
- 11.2.7.2. Products
- 11.2.7.3. SWOT Analysis
- 11.2.7.4. Recent Developments
- 11.2.7.5. Financials (Based on Availability)
- 11.2.8 Tata Motors Limited
- 11.2.8.1. Overview
- 11.2.8.2. Products
- 11.2.8.3. SWOT Analysis
- 11.2.8.4. Recent Developments
- 11.2.8.5. Financials (Based on Availability)
- 11.2.9 BAIC Motor Corporation Ltd
- 11.2.9.1. Overview
- 11.2.9.2. Products
- 11.2.9.3. SWOT Analysis
- 11.2.9.4. Recent Developments
- 11.2.9.5. Financials (Based on Availability)
- 11.2.10 Volvo Grou
- 11.2.10.1. Overview
- 11.2.10.2. Products
- 11.2.10.3. SWOT Analysis
- 11.2.10.4. Recent Developments
- 11.2.10.5. Financials (Based on Availability)
- 11.2.11 Mahindra & Mahindra Limited
- 11.2.11.1. Overview
- 11.2.11.2. Products
- 11.2.11.3. SWOT Analysis
- 11.2.11.4. Recent Developments
- 11.2.11.5. Financials (Based on Availability)
- 11.2.12 BYD Auto Co Ltd
- 11.2.12.1. Overview
- 11.2.12.2. Products
- 11.2.12.3. SWOT Analysis
- 11.2.12.4. Recent Developments
- 11.2.12.5. Financials (Based on Availability)
- 11.2.13 Groupe Renault
- 11.2.13.1. Overview
- 11.2.13.2. Products
- 11.2.13.3. SWOT Analysis
- 11.2.13.4. Recent Developments
- 11.2.13.5. Financials (Based on Availability)
- 11.2.14 Rivian Automotive Inc
- 11.2.14.1. Overview
- 11.2.14.2. Products
- 11.2.14.3. SWOT Analysis
- 11.2.14.4. Recent Developments
- 11.2.14.5. Financials (Based on Availability)
- 11.2.15 Ford Motor Company
- 11.2.15.1. Overview
- 11.2.15.2. Products
- 11.2.15.3. SWOT Analysis
- 11.2.15.4. Recent Developments
- 11.2.15.5. Financials (Based on Availability)
- 11.2.1 Ashok Leyland Limited
List of Figures
- Figure 1: Global Light Vehicle Industry Revenue Breakdown (Million, %) by Region 2024 & 2032
- Figure 2: North America Light Vehicle Industry Revenue (Million), by Vehicle Type 2024 & 2032
- Figure 3: North America Light Vehicle Industry Revenue Share (%), by Vehicle Type 2024 & 2032
- Figure 4: North America Light Vehicle Industry Revenue (Million), by Propulsion Type 2024 & 2032
- Figure 5: North America Light Vehicle Industry Revenue Share (%), by Propulsion Type 2024 & 2032
- Figure 6: North America Light Vehicle Industry Revenue (Million), by Country 2024 & 2032
- Figure 7: North America Light Vehicle Industry Revenue Share (%), by Country 2024 & 2032
- Figure 8: South America Light Vehicle Industry Revenue (Million), by Vehicle Type 2024 & 2032
- Figure 9: South America Light Vehicle Industry Revenue Share (%), by Vehicle Type 2024 & 2032
- Figure 10: South America Light Vehicle Industry Revenue (Million), by Propulsion Type 2024 & 2032
- Figure 11: South America Light Vehicle Industry Revenue Share (%), by Propulsion Type 2024 & 2032
- Figure 12: South America Light Vehicle Industry Revenue (Million), by Country 2024 & 2032
- Figure 13: South America Light Vehicle Industry Revenue Share (%), by Country 2024 & 2032
- Figure 14: Europe Light Vehicle Industry Revenue (Million), by Vehicle Type 2024 & 2032
- Figure 15: Europe Light Vehicle Industry Revenue Share (%), by Vehicle Type 2024 & 2032
- Figure 16: Europe Light Vehicle Industry Revenue (Million), by Propulsion Type 2024 & 2032
- Figure 17: Europe Light Vehicle Industry Revenue Share (%), by Propulsion Type 2024 & 2032
- Figure 18: Europe Light Vehicle Industry Revenue (Million), by Country 2024 & 2032
- Figure 19: Europe Light Vehicle Industry Revenue Share (%), by Country 2024 & 2032
- Figure 20: Middle East & Africa Light Vehicle Industry Revenue (Million), by Vehicle Type 2024 & 2032
- Figure 21: Middle East & Africa Light Vehicle Industry Revenue Share (%), by Vehicle Type 2024 & 2032
- Figure 22: Middle East & Africa Light Vehicle Industry Revenue (Million), by Propulsion Type 2024 & 2032
- Figure 23: Middle East & Africa Light Vehicle Industry Revenue Share (%), by Propulsion Type 2024 & 2032
- Figure 24: Middle East & Africa Light Vehicle Industry Revenue (Million), by Country 2024 & 2032
- Figure 25: Middle East & Africa Light Vehicle Industry Revenue Share (%), by Country 2024 & 2032
- Figure 26: Asia Pacific Light Vehicle Industry Revenue (Million), by Vehicle Type 2024 & 2032
- Figure 27: Asia Pacific Light Vehicle Industry Revenue Share (%), by Vehicle Type 2024 & 2032
- Figure 28: Asia Pacific Light Vehicle Industry Revenue (Million), by Propulsion Type 2024 & 2032
- Figure 29: Asia Pacific Light Vehicle Industry Revenue Share (%), by Propulsion Type 2024 & 2032
- Figure 30: Asia Pacific Light Vehicle Industry Revenue (Million), by Country 2024 & 2032
- Figure 31: Asia Pacific Light Vehicle Industry Revenue Share (%), by Country 2024 & 2032
List of Tables
- Table 1: Global Light Vehicle Industry Revenue Million Forecast, by Region 2019 & 2032
- Table 2: Global Light Vehicle Industry Revenue Million Forecast, by Vehicle Type 2019 & 2032
- Table 3: Global Light Vehicle Industry Revenue Million Forecast, by Propulsion Type 2019 & 2032
- Table 4: Global Light Vehicle Industry Revenue Million Forecast, by Region 2019 & 2032
- Table 5: Global Light Vehicle Industry Revenue Million Forecast, by Vehicle Type 2019 & 2032
- Table 6: Global Light Vehicle Industry Revenue Million Forecast, by Propulsion Type 2019 & 2032
- Table 7: Global Light Vehicle Industry Revenue Million Forecast, by Country 2019 & 2032
- Table 8: United States Light Vehicle Industry Revenue (Million) Forecast, by Application 2019 & 2032
- Table 9: Canada Light Vehicle Industry Revenue (Million) Forecast, by Application 2019 & 2032
- Table 10: Mexico Light Vehicle Industry Revenue (Million) Forecast, by Application 2019 & 2032
- Table 11: Global Light Vehicle Industry Revenue Million Forecast, by Vehicle Type 2019 & 2032
- Table 12: Global Light Vehicle Industry Revenue Million Forecast, by Propulsion Type 2019 & 2032
- Table 13: Global Light Vehicle Industry Revenue Million Forecast, by Country 2019 & 2032
- Table 14: Brazil Light Vehicle Industry Revenue (Million) Forecast, by Application 2019 & 2032
- Table 15: Argentina Light Vehicle Industry Revenue (Million) Forecast, by Application 2019 & 2032
- Table 16: Rest of South America Light Vehicle Industry Revenue (Million) Forecast, by Application 2019 & 2032
- Table 17: Global Light Vehicle Industry Revenue Million Forecast, by Vehicle Type 2019 & 2032
- Table 18: Global Light Vehicle Industry Revenue Million Forecast, by Propulsion Type 2019 & 2032
- Table 19: Global Light Vehicle Industry Revenue Million Forecast, by Country 2019 & 2032
- Table 20: United Kingdom Light Vehicle Industry Revenue (Million) Forecast, by Application 2019 & 2032
- Table 21: Germany Light Vehicle Industry Revenue (Million) Forecast, by Application 2019 & 2032
- Table 22: France Light Vehicle Industry Revenue (Million) Forecast, by Application 2019 & 2032
- Table 23: Italy Light Vehicle Industry Revenue (Million) Forecast, by Application 2019 & 2032
- Table 24: Spain Light Vehicle Industry Revenue (Million) Forecast, by Application 2019 & 2032
- Table 25: Russia Light Vehicle Industry Revenue (Million) Forecast, by Application 2019 & 2032
- Table 26: Benelux Light Vehicle Industry Revenue (Million) Forecast, by Application 2019 & 2032
- Table 27: Nordics Light Vehicle Industry Revenue (Million) Forecast, by Application 2019 & 2032
- Table 28: Rest of Europe Light Vehicle Industry Revenue (Million) Forecast, by Application 2019 & 2032
- Table 29: Global Light Vehicle Industry Revenue Million Forecast, by Vehicle Type 2019 & 2032
- Table 30: Global Light Vehicle Industry Revenue Million Forecast, by Propulsion Type 2019 & 2032
- Table 31: Global Light Vehicle Industry Revenue Million Forecast, by Country 2019 & 2032
- Table 32: Turkey Light Vehicle Industry Revenue (Million) Forecast, by Application 2019 & 2032
- Table 33: Israel Light Vehicle Industry Revenue (Million) Forecast, by Application 2019 & 2032
- Table 34: GCC Light Vehicle Industry Revenue (Million) Forecast, by Application 2019 & 2032
- Table 35: North Africa Light Vehicle Industry Revenue (Million) Forecast, by Application 2019 & 2032
- Table 36: South Africa Light Vehicle Industry Revenue (Million) Forecast, by Application 2019 & 2032
- Table 37: Rest of Middle East & Africa Light Vehicle Industry Revenue (Million) Forecast, by Application 2019 & 2032
- Table 38: Global Light Vehicle Industry Revenue Million Forecast, by Vehicle Type 2019 & 2032
- Table 39: Global Light Vehicle Industry Revenue Million Forecast, by Propulsion Type 2019 & 2032
- Table 40: Global Light Vehicle Industry Revenue Million Forecast, by Country 2019 & 2032
- Table 41: China Light Vehicle Industry Revenue (Million) Forecast, by Application 2019 & 2032
- Table 42: India Light Vehicle Industry Revenue (Million) Forecast, by Application 2019 & 2032
- Table 43: Japan Light Vehicle Industry Revenue (Million) Forecast, by Application 2019 & 2032
- Table 44: South Korea Light Vehicle Industry Revenue (Million) Forecast, by Application 2019 & 2032
- Table 45: ASEAN Light Vehicle Industry Revenue (Million) Forecast, by Application 2019 & 2032
- Table 46: Oceania Light Vehicle Industry Revenue (Million) Forecast, by Application 2019 & 2032
- Table 47: Rest of Asia Pacific Light Vehicle Industry Revenue (Million) Forecast, by Application 2019 & 2032
Frequently Asked Questions
1. What is the projected Compound Annual Growth Rate (CAGR) of the Light Vehicle Industry?
The projected CAGR is approximately > 20.00%.
2. Which companies are prominent players in the Light Vehicle Industry?
Key companies in the market include Ashok Leyland Limited, Nissan Motor Co Ltd, Isuzu Motors Limited, General Motors Company, Dongfeng Motor Corporation, Volkswagen AG, Daimler AG (Mercedes-Benz AG), Tata Motors Limited, BAIC Motor Corporation Ltd, Volvo Grou, Mahindra & Mahindra Limited, BYD Auto Co Ltd, Groupe Renault, Rivian Automotive Inc, Ford Motor Company.
3. What are the main segments of the Light Vehicle Industry?
The market segments include Vehicle Type, Propulsion Type.
4. Can you provide details about the market size?
The market size is estimated to be USD XX Million as of 2022.
5. What are some drivers contributing to market growth?
Growing Travel and Tourism Industry is Driving the Car Rental Market.
6. What are the notable trends driving market growth?
OTHER KEY INDUSTRY TRENDS COVERED IN THE REPORT.
7. Are there any restraints impacting market growth?
Increasing Popularity of Ride-Sharing Services Pose Challenges for the Conventional Car Rental Market.
8. Can you provide examples of recent developments in the market?
August 2023: General Motors will launch an all-electric Cadillac Escalade in late 2024August 2023: General Motors doubles down on plans for an electric future in the Middle East.August 2023: Gabriel India Limited (Gabriel India), a flagship company of Anand Group, announced that during the quarter that ended on June 30, 2023, it has developed components for Maruti Suzuki Jimny and Stellantis electric Citroen C3. At present it is developing parts for new models of VW, Tata, Stellantis, Mahindra, and Maruti Suzuki.
9. What pricing options are available for accessing the report?
Pricing options include single-user, multi-user, and enterprise licenses priced at USD 3800, USD 4500, and USD 5800 respectively.
10. Is the market size provided in terms of value or volume?
The market size is provided in terms of value, measured in Million.
11. Are there any specific market keywords associated with the report?
Yes, the market keyword associated with the report is "Light Vehicle Industry," which aids in identifying and referencing the specific market segment covered.
12. How do I determine which pricing option suits my needs best?
The pricing options vary based on user requirements and access needs. Individual users may opt for single-user licenses, while businesses requiring broader access may choose multi-user or enterprise licenses for cost-effective access to the report.
13. Are there any additional resources or data provided in the Light Vehicle Industry report?
While the report offers comprehensive insights, it's advisable to review the specific contents or supplementary materials provided to ascertain if additional resources or data are available.
14. How can I stay updated on further developments or reports in the Light Vehicle Industry?
To stay informed about further developments, trends, and reports in the Light Vehicle Industry, consider subscribing to industry newsletters, following relevant companies and organizations, or regularly checking reputable industry news sources and publications.
Methodology
Step 1 - Identification of Relevant Samples Size from Population Database


Step 2 - Approaches for Defining Global Market Size (Value, Volume* & Price*)

Note*: In applicable scenarios
Step 3 - Data Sources
Primary Research
- Web Analytics
- Survey Reports
- Research Institute
- Latest Research Reports
- Opinion Leaders
Secondary Research
- Annual Reports
- White Paper
- Latest Press Release
- Industry Association
- Paid Database
- Investor Presentations

Step 4 - Data Triangulation
Involves using different sources of information in order to increase the validity of a study
These sources are likely to be stakeholders in a program - participants, other researchers, program staff, other community members, and so on.
Then we put all data in single framework & apply various statistical tools to find out the dynamic on the market.
During the analysis stage, feedback from the stakeholder groups would be compared to determine areas of agreement as well as areas of divergence


