

Key Insights
The Life Science and Chemical Instrumentation market, projected to reach $62.3 billion by 2025, is poised for significant expansion. Key growth drivers include the escalating demand for sophisticated analytical methods in pharmaceutical research and development, biotechnology, and environmental monitoring. Innovations such as miniaturization, automation, and enhanced instrument sensitivity are significantly improving efficiency and broadening application scope. Increased government investment in scientific research and a growing emphasis on personalized medicine further support market momentum. The competitive environment comprises major players like Thermo Fisher Scientific, Danaher, and Agilent Technologies, alongside innovative emerging companies. Despite potential challenges from supply chain complexities and regulatory landscapes, the market is forecast to achieve a Compound Annual Growth Rate (CAGR) of 8.3% from 2025. This trajectory is further propelled by the increasing adoption of advanced analytical techniques in academic research and contract research organizations.
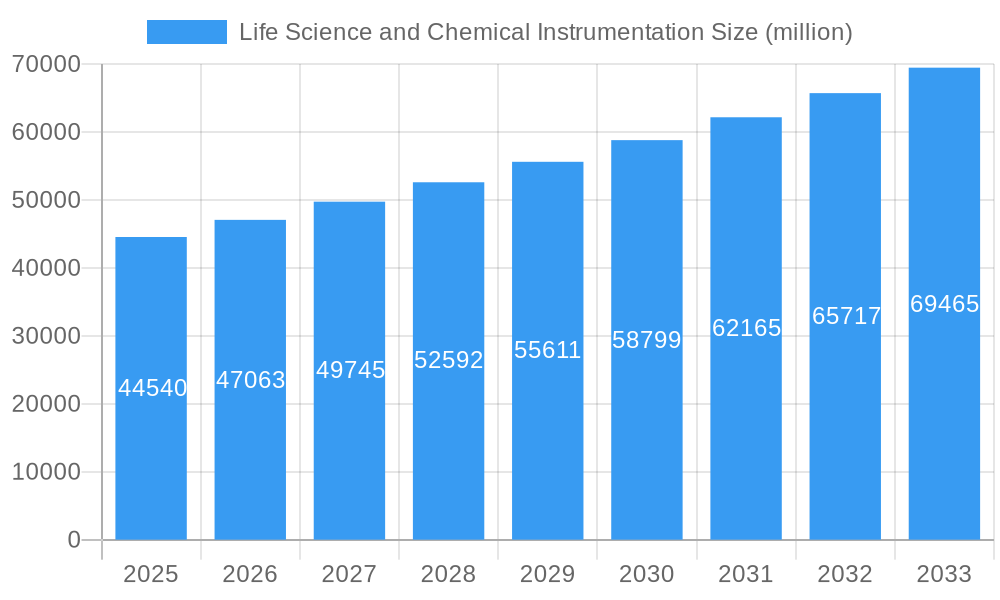
Life Science and Chemical Instrumentation Market Size (In Billion)
Market segmentation highlights robust performance in application areas such as genomics, proteomics, and drug discovery. Geographically, North America and Asia-Pacific are leading growth due to substantial research investments and a burgeoning pharmaceutical and biotechnology sector. Europe remains a critical market, benefiting from supportive regulatory frameworks for scientific progress. The industry is observing a transition towards integrated solutions and software-enabled analytical platforms, optimizing data analysis and workflow management. This trend, amplified by the adoption of cloud-based data solutions, is expected to accelerate market growth. Continued stringent demands for quality control and regulatory adherence across industries also ensure sustained demand for high-performance instrumentation.
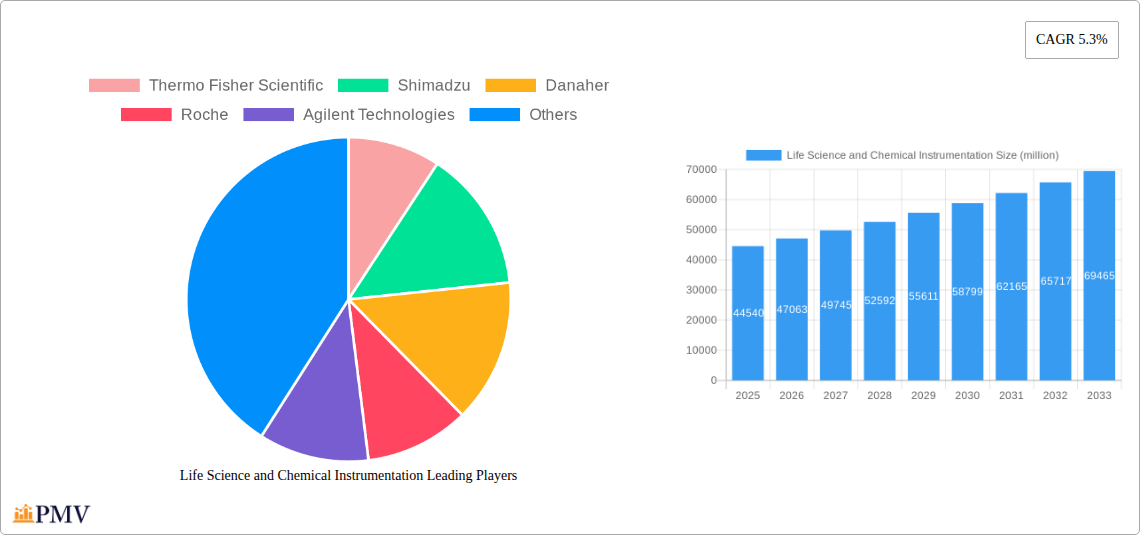
Life Science and Chemical Instrumentation Company Market Share
Life Science and Chemical Instrumentation Market Report: 2019-2033
This comprehensive report provides a detailed analysis of the global Life Science and Chemical Instrumentation market, offering invaluable insights for stakeholders across the industry. The study period covers 2019-2033, with a base year of 2025 and a forecast period of 2025-2033. The report's findings are based on extensive research and data analysis, providing a crucial understanding of market trends, competitive dynamics, and future growth potential. The market size in 2025 is estimated at $xx million, expected to reach $xx million by 2033.
Life Science and Chemical Instrumentation Market Structure & Competitive Dynamics
This section analyzes the competitive landscape of the Life Science and Chemical Instrumentation market, examining market concentration, innovation ecosystems, regulatory frameworks, product substitutes, end-user trends, and mergers & acquisitions (M&A) activities. The market is characterized by a moderately concentrated structure, with several key players holding significant market share.
Market Share: Thermo Fisher Scientific, Danaher, and Agilent Technologies collectively hold approximately xx% of the global market share in 2025. Shimadzu, Roche, and Bruker represent a further xx%. The remaining market share is divided amongst numerous smaller players, including Waters, PerkinElmer, Bio-Rad Laboratories, Mettler Toledo, Illumina, Sartorius, HORIBA, MGI Tech, and JEOL.
Innovation Ecosystems: Significant investments in R&D drive innovation within the sector, with leading companies focusing on developing advanced technologies such as mass spectrometry, chromatography, and next-generation sequencing. Collaborative efforts between academic institutions and industry players further contribute to technological advancements.
Regulatory Frameworks: Stringent regulatory requirements for medical devices and analytical instruments influence product development and market access. Compliance with regulations such as FDA and CE marking is essential for market entry and success.
Product Substitutes: The emergence of alternative technologies and cost-effective solutions presents a competitive challenge to established players.
M&A Activities: The market has witnessed significant M&A activity in recent years, with large companies acquiring smaller players to expand their product portfolios and market reach. The total value of M&A deals in the period 2019-2024 is estimated at $xx million.
End-User Trends: Growing demand from pharmaceutical, biotechnology, and academic research institutions is driving market growth.
Life Science and Chemical Instrumentation Industry Trends & Insights
This section delves into the key trends shaping the Life Science and Chemical Instrumentation market, providing a detailed analysis of market growth drivers, technological disruptions, consumer preferences, and competitive dynamics.
The market is experiencing robust growth, driven primarily by increasing R&D spending in the pharmaceutical and biotechnology sectors, coupled with the rising demand for advanced analytical techniques in various research applications. The adoption of automation and artificial intelligence (AI) in laboratory workflows is also contributing to market expansion.
The compound annual growth rate (CAGR) during the forecast period (2025-2033) is projected to be xx%, driven by factors such as increased investments in life science research, advancements in instrumentation technologies, and the rising adoption of personalized medicine. Market penetration of new technologies such as single-cell analysis and high-throughput screening is also expected to drive significant growth. The increasing demand for higher-throughput and more sensitive instrumentation is fueling innovations in various areas like genomics, proteomics, and metabolomics. Competitive dynamics are characterized by a combination of innovation, strategic partnerships, and mergers and acquisitions, shaping the landscape.
Dominant Markets & Segments in Life Science and Chemical Instrumentation
North America holds a dominant position in the global Life Science and Chemical Instrumentation market, driven by a robust pharmaceutical and biotechnology industry, along with significant investments in research and development. Europe and Asia-Pacific also represent significant markets, experiencing steady growth.
Key Drivers in North America:
- Strong regulatory support for innovation.
- High density of pharmaceutical and biotechnology companies.
- Substantial investments in research and development.
- Well-established healthcare infrastructure.
Dominance Analysis: The dominance of North America can be attributed to the aforementioned factors, along with the presence of several key market players with extensive manufacturing and distribution networks in the region. While Europe and Asia-Pacific lag slightly, they show promising growth trajectories due to increasing investment and technological advancements in the life sciences sector within those regions.
Specific Segment Dominance: While detailed segment information is unavailable for specific report generation without placeholder, chromatography instrumentation (e.g., HPLC, GC) and mass spectrometry currently constitute a significant portion of the market.
Life Science and Chemical Instrumentation Product Innovations
Recent product developments focus on miniaturization, automation, and increased sensitivity and throughput. Advancements in mass spectrometry, next-generation sequencing, and microfluidics are transforming analytical capabilities. These innovations enhance efficiency and reduce costs, attracting a wider range of end-users. The market is seeing a rise in integrated platforms combining multiple analytical techniques.
Report Segmentation & Scope
The report segments the market based on product type (e.g., chromatography, mass spectrometry, spectroscopy), application (e.g., drug discovery, genomics, proteomics), end-user (e.g., pharmaceutical companies, research institutions), and geography (North America, Europe, Asia Pacific, etc.). Each segment's market size and growth projections are analyzed, offering a granular view of market dynamics. Competitive landscape and analysis within each segment are also detailed.
Key Drivers of Life Science and Chemical Instrumentation Growth
Several factors drive the market's growth. Firstly, technological advancements, particularly in areas such as high-throughput screening and next-generation sequencing, constantly improve research capabilities. Secondly, the increase in funding for life science research from both government and private sectors fuels demand for advanced instrumentation. Thirdly, a growing global population and rising prevalence of chronic diseases increase the need for new drug discovery and diagnostics, spurring demand for sophisticated analytical tools.
Challenges in the Life Science and Chemical Instrumentation Sector
The Life Science and Chemical Instrumentation sector faces challenges including the high cost of advanced instruments, stringent regulatory requirements leading to lengthy approval processes, and intense competition among numerous established players and new entrants. Supply chain disruptions and fluctuations in raw material costs further impact profitability and market stability. These challenges contribute to market complexities but also present opportunities for innovation and improved efficiency.
Leading Players in the Life Science and Chemical Instrumentation Market
Key Developments in Life Science and Chemical Instrumentation Sector
- January 2023: Thermo Fisher Scientific launches a new mass spectrometer with enhanced sensitivity.
- March 2023: Danaher acquires a smaller company specializing in chromatography solutions.
- June 2022: Agilent Technologies announces a new partnership for the development of AI-powered analytical tools.
- Further developments: xx
Strategic Life Science and Chemical Instrumentation Market Outlook
The Life Science and Chemical Instrumentation market is poised for continued growth, fueled by ongoing technological advancements, increasing R&D investments, and the growing demand for personalized medicine. Strategic opportunities exist for companies that can effectively innovate, adapt to evolving regulatory landscapes, and capitalize on the rising need for high-throughput, cost-effective analytical solutions. The market's future potential hinges on embracing digital transformation and exploring new applications of existing technologies within the life sciences sector.
Life Science and Chemical Instrumentation Segmentation
-
1. Application
- 1.1. Pharma & Bio
- 1.2. Academic & Government
- 1.3. Healthcare
- 1.4. Industry
- 1.5. Others
-
2. Types
- 2.1. General Instrument
- 2.2. Analytical Instruments
- 2.3. Others
Life Science and Chemical Instrumentation Segmentation By Geography
-
1. North America
- 1.1. United States
- 1.2. Canada
- 1.3. Mexico
-
2. South America
- 2.1. Brazil
- 2.2. Argentina
- 2.3. Rest of South America
-
3. Europe
- 3.1. United Kingdom
- 3.2. Germany
- 3.3. France
- 3.4. Italy
- 3.5. Spain
- 3.6. Russia
- 3.7. Benelux
- 3.8. Nordics
- 3.9. Rest of Europe
-
4. Middle East & Africa
- 4.1. Turkey
- 4.2. Israel
- 4.3. GCC
- 4.4. North Africa
- 4.5. South Africa
- 4.6. Rest of Middle East & Africa
-
5. Asia Pacific
- 5.1. China
- 5.2. India
- 5.3. Japan
- 5.4. South Korea
- 5.5. ASEAN
- 5.6. Oceania
- 5.7. Rest of Asia Pacific
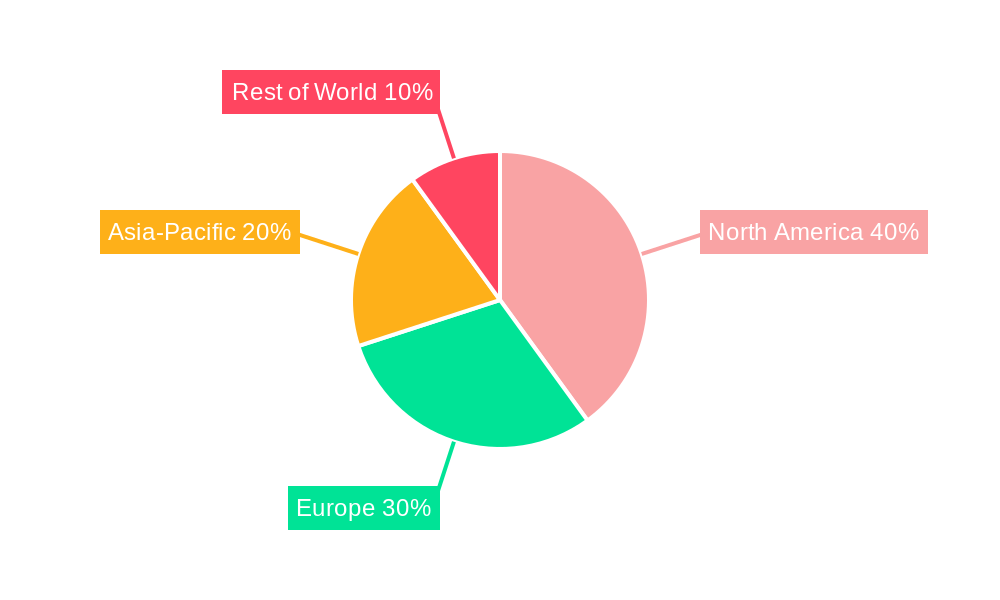
Life Science and Chemical Instrumentation Regional Market Share
Geographic Coverage of Life Science and Chemical Instrumentation
Life Science and Chemical Instrumentation REPORT HIGHLIGHTS
| Aspects | Details |
|---|---|
| Study Period | 2020-2034 |
| Base Year | 2025 |
| Estimated Year | 2026 |
| Forecast Period | 2026-2034 |
| Historical Period | 2020-2025 |
| Growth Rate | CAGR of 8.3% from 2020-2034 |
| Segmentation |
|
Table of Contents
- 1. Introduction
- 1.1. Research Scope
- 1.2. Market Segmentation
- 1.3. Research Objective
- 1.4. Definitions and Assumptions
- 2. Executive Summary
- 2.1. Market Snapshot
- 3. Market Dynamics
- 3.1. Market Drivers
- 3.2. Market Restrains
- 3.3. Market Trends
- 3.4. Market Opportunities
- 4. Market Factor Analysis
- 4.1. Porters Five Forces
- 4.1.1. Bargaining Power of Suppliers
- 4.1.2. Bargaining Power of Buyers
- 4.1.3. Threat of New Entrants
- 4.1.4. Threat of Substitutes
- 4.1.5. Competitive Rivalry
- 4.2. PESTEL analysis
- 4.3. BCG Analysis
- 4.3.1. Stars (High Growth, High Market Share)
- 4.3.2. Cash Cows (Low Growth, High Market Share)
- 4.3.3. Question Mark (High Growth, Low Market Share)
- 4.3.4. Dogs (Low Growth, Low Market Share)
- 4.4. Ansoff Matrix Analysis
- 4.5. Supply Chain Analysis
- 4.6. Regulatory Landscape
- 4.7. Current Market Potential and Opportunity Assessment (TAM–SAM–SOM Framework)
- 4.8. PMV Analyst Note
- 4.1. Porters Five Forces
- 5. Market Analysis, Insights and Forecast 2021-2033
- 5.1. Market Analysis, Insights and Forecast - by Application
- 5.1.1. Pharma & Bio
- 5.1.2. Academic & Government
- 5.1.3. Healthcare
- 5.1.4. Industry
- 5.1.5. Others
- 5.2. Market Analysis, Insights and Forecast - by Types
- 5.2.1. General Instrument
- 5.2.2. Analytical Instruments
- 5.2.3. Others
- 5.3. Market Analysis, Insights and Forecast - by Region
- 5.3.1. North America
- 5.3.2. South America
- 5.3.3. Europe
- 5.3.4. Middle East & Africa
- 5.3.5. Asia Pacific
- 5.1. Market Analysis, Insights and Forecast - by Application
- 6. Global Life Science and Chemical Instrumentation Analysis, Insights and Forecast, 2021-2033
- 6.1. Market Analysis, Insights and Forecast - by Application
- 6.1.1. Pharma & Bio
- 6.1.2. Academic & Government
- 6.1.3. Healthcare
- 6.1.4. Industry
- 6.1.5. Others
- 6.2. Market Analysis, Insights and Forecast - by Types
- 6.2.1. General Instrument
- 6.2.2. Analytical Instruments
- 6.2.3. Others
- 6.1. Market Analysis, Insights and Forecast - by Application
- 7. North America Life Science and Chemical Instrumentation Analysis, Insights and Forecast, 2020-2032
- 7.1. Market Analysis, Insights and Forecast - by Application
- 7.1.1. Pharma & Bio
- 7.1.2. Academic & Government
- 7.1.3. Healthcare
- 7.1.4. Industry
- 7.1.5. Others
- 7.2. Market Analysis, Insights and Forecast - by Types
- 7.2.1. General Instrument
- 7.2.2. Analytical Instruments
- 7.2.3. Others
- 7.1. Market Analysis, Insights and Forecast - by Application
- 8. South America Life Science and Chemical Instrumentation Analysis, Insights and Forecast, 2020-2032
- 8.1. Market Analysis, Insights and Forecast - by Application
- 8.1.1. Pharma & Bio
- 8.1.2. Academic & Government
- 8.1.3. Healthcare
- 8.1.4. Industry
- 8.1.5. Others
- 8.2. Market Analysis, Insights and Forecast - by Types
- 8.2.1. General Instrument
- 8.2.2. Analytical Instruments
- 8.2.3. Others
- 8.1. Market Analysis, Insights and Forecast - by Application
- 9. Europe Life Science and Chemical Instrumentation Analysis, Insights and Forecast, 2020-2032
- 9.1. Market Analysis, Insights and Forecast - by Application
- 9.1.1. Pharma & Bio
- 9.1.2. Academic & Government
- 9.1.3. Healthcare
- 9.1.4. Industry
- 9.1.5. Others
- 9.2. Market Analysis, Insights and Forecast - by Types
- 9.2.1. General Instrument
- 9.2.2. Analytical Instruments
- 9.2.3. Others
- 9.1. Market Analysis, Insights and Forecast - by Application
- 10. Middle East & Africa Life Science and Chemical Instrumentation Analysis, Insights and Forecast, 2020-2032
- 10.1. Market Analysis, Insights and Forecast - by Application
- 10.1.1. Pharma & Bio
- 10.1.2. Academic & Government
- 10.1.3. Healthcare
- 10.1.4. Industry
- 10.1.5. Others
- 10.2. Market Analysis, Insights and Forecast - by Types
- 10.2.1. General Instrument
- 10.2.2. Analytical Instruments
- 10.2.3. Others
- 10.1. Market Analysis, Insights and Forecast - by Application
- 11. Asia Pacific Life Science and Chemical Instrumentation Analysis, Insights and Forecast, 2020-2032
- 11.1. Market Analysis, Insights and Forecast - by Application
- 11.1.1. Pharma & Bio
- 11.1.2. Academic & Government
- 11.1.3. Healthcare
- 11.1.4. Industry
- 11.1.5. Others
- 11.2. Market Analysis, Insights and Forecast - by Types
- 11.2.1. General Instrument
- 11.2.2. Analytical Instruments
- 11.2.3. Others
- 11.1. Market Analysis, Insights and Forecast - by Application
- 12. Competitive Analysis
- 12.1. Company Profiles
- 12.1.1 Thermo Fisher Scientific
- 12.1.1.1. Company Overview
- 12.1.1.2. Products
- 12.1.1.3. Company Financials
- 12.1.1.4. SWOT Analysis
- 12.1.2 Shimadzu
- 12.1.2.1. Company Overview
- 12.1.2.2. Products
- 12.1.2.3. Company Financials
- 12.1.2.4. SWOT Analysis
- 12.1.3 Danaher
- 12.1.3.1. Company Overview
- 12.1.3.2. Products
- 12.1.3.3. Company Financials
- 12.1.3.4. SWOT Analysis
- 12.1.4 Roche
- 12.1.4.1. Company Overview
- 12.1.4.2. Products
- 12.1.4.3. Company Financials
- 12.1.4.4. SWOT Analysis
- 12.1.5 Agilent Technologies
- 12.1.5.1. Company Overview
- 12.1.5.2. Products
- 12.1.5.3. Company Financials
- 12.1.5.4. SWOT Analysis
- 12.1.6 Bruker
- 12.1.6.1. Company Overview
- 12.1.6.2. Products
- 12.1.6.3. Company Financials
- 12.1.6.4. SWOT Analysis
- 12.1.7 Waters
- 12.1.7.1. Company Overview
- 12.1.7.2. Products
- 12.1.7.3. Company Financials
- 12.1.7.4. SWOT Analysis
- 12.1.8 PerkinElmer
- 12.1.8.1. Company Overview
- 12.1.8.2. Products
- 12.1.8.3. Company Financials
- 12.1.8.4. SWOT Analysis
- 12.1.9 Bio-Rad Laboratories
- 12.1.9.1. Company Overview
- 12.1.9.2. Products
- 12.1.9.3. Company Financials
- 12.1.9.4. SWOT Analysis
- 12.1.10 Mettler Toledo
- 12.1.10.1. Company Overview
- 12.1.10.2. Products
- 12.1.10.3. Company Financials
- 12.1.10.4. SWOT Analysis
- 12.1.11 Illumina
- 12.1.11.1. Company Overview
- 12.1.11.2. Products
- 12.1.11.3. Company Financials
- 12.1.11.4. SWOT Analysis
- 12.1.12 Sartorius
- 12.1.12.1. Company Overview
- 12.1.12.2. Products
- 12.1.12.3. Company Financials
- 12.1.12.4. SWOT Analysis
- 12.1.13 HORIBA
- 12.1.13.1. Company Overview
- 12.1.13.2. Products
- 12.1.13.3. Company Financials
- 12.1.13.4. SWOT Analysis
- 12.1.14 MGI Tech
- 12.1.14.1. Company Overview
- 12.1.14.2. Products
- 12.1.14.3. Company Financials
- 12.1.14.4. SWOT Analysis
- 12.1.15 JEOL
- 12.1.15.1. Company Overview
- 12.1.15.2. Products
- 12.1.15.3. Company Financials
- 12.1.15.4. SWOT Analysis
- 12.1.1 Thermo Fisher Scientific
- 12.2. Market Entropy
- 12.2.1 Company's Key Areas Served
- 12.2.2 Recent Developments
- 12.3. Company Market Share Analysis 2025
- 12.3.1 Top 5 Companies Market Share Analysis
- 12.3.2 Top 3 Companies Market Share Analysis
- 12.4. List of Potential Customers
- 13. Research Methodology
List of Figures
- Figure 1: Global Life Science and Chemical Instrumentation Revenue Breakdown (billion, %) by Region 2025 & 2033
- Figure 2: North America Life Science and Chemical Instrumentation Revenue (billion), by Application 2025 & 2033
- Figure 3: North America Life Science and Chemical Instrumentation Revenue Share (%), by Application 2025 & 2033
- Figure 4: North America Life Science and Chemical Instrumentation Revenue (billion), by Types 2025 & 2033
- Figure 5: North America Life Science and Chemical Instrumentation Revenue Share (%), by Types 2025 & 2033
- Figure 6: North America Life Science and Chemical Instrumentation Revenue (billion), by Country 2025 & 2033
- Figure 7: North America Life Science and Chemical Instrumentation Revenue Share (%), by Country 2025 & 2033
- Figure 8: South America Life Science and Chemical Instrumentation Revenue (billion), by Application 2025 & 2033
- Figure 9: South America Life Science and Chemical Instrumentation Revenue Share (%), by Application 2025 & 2033
- Figure 10: South America Life Science and Chemical Instrumentation Revenue (billion), by Types 2025 & 2033
- Figure 11: South America Life Science and Chemical Instrumentation Revenue Share (%), by Types 2025 & 2033
- Figure 12: South America Life Science and Chemical Instrumentation Revenue (billion), by Country 2025 & 2033
- Figure 13: South America Life Science and Chemical Instrumentation Revenue Share (%), by Country 2025 & 2033
- Figure 14: Europe Life Science and Chemical Instrumentation Revenue (billion), by Application 2025 & 2033
- Figure 15: Europe Life Science and Chemical Instrumentation Revenue Share (%), by Application 2025 & 2033
- Figure 16: Europe Life Science and Chemical Instrumentation Revenue (billion), by Types 2025 & 2033
- Figure 17: Europe Life Science and Chemical Instrumentation Revenue Share (%), by Types 2025 & 2033
- Figure 18: Europe Life Science and Chemical Instrumentation Revenue (billion), by Country 2025 & 2033
- Figure 19: Europe Life Science and Chemical Instrumentation Revenue Share (%), by Country 2025 & 2033
- Figure 20: Middle East & Africa Life Science and Chemical Instrumentation Revenue (billion), by Application 2025 & 2033
- Figure 21: Middle East & Africa Life Science and Chemical Instrumentation Revenue Share (%), by Application 2025 & 2033
- Figure 22: Middle East & Africa Life Science and Chemical Instrumentation Revenue (billion), by Types 2025 & 2033
- Figure 23: Middle East & Africa Life Science and Chemical Instrumentation Revenue Share (%), by Types 2025 & 2033
- Figure 24: Middle East & Africa Life Science and Chemical Instrumentation Revenue (billion), by Country 2025 & 2033
- Figure 25: Middle East & Africa Life Science and Chemical Instrumentation Revenue Share (%), by Country 2025 & 2033
- Figure 26: Asia Pacific Life Science and Chemical Instrumentation Revenue (billion), by Application 2025 & 2033
- Figure 27: Asia Pacific Life Science and Chemical Instrumentation Revenue Share (%), by Application 2025 & 2033
- Figure 28: Asia Pacific Life Science and Chemical Instrumentation Revenue (billion), by Types 2025 & 2033
- Figure 29: Asia Pacific Life Science and Chemical Instrumentation Revenue Share (%), by Types 2025 & 2033
- Figure 30: Asia Pacific Life Science and Chemical Instrumentation Revenue (billion), by Country 2025 & 2033
- Figure 31: Asia Pacific Life Science and Chemical Instrumentation Revenue Share (%), by Country 2025 & 2033
List of Tables
- Table 1: Global Life Science and Chemical Instrumentation Revenue billion Forecast, by Application 2020 & 2033
- Table 2: Global Life Science and Chemical Instrumentation Revenue billion Forecast, by Types 2020 & 2033
- Table 3: Global Life Science and Chemical Instrumentation Revenue billion Forecast, by Region 2020 & 2033
- Table 4: Global Life Science and Chemical Instrumentation Revenue billion Forecast, by Application 2020 & 2033
- Table 5: Global Life Science and Chemical Instrumentation Revenue billion Forecast, by Types 2020 & 2033
- Table 6: Global Life Science and Chemical Instrumentation Revenue billion Forecast, by Country 2020 & 2033
- Table 7: United States Life Science and Chemical Instrumentation Revenue (billion) Forecast, by Application 2020 & 2033
- Table 8: Canada Life Science and Chemical Instrumentation Revenue (billion) Forecast, by Application 2020 & 2033
- Table 9: Mexico Life Science and Chemical Instrumentation Revenue (billion) Forecast, by Application 2020 & 2033
- Table 10: Global Life Science and Chemical Instrumentation Revenue billion Forecast, by Application 2020 & 2033
- Table 11: Global Life Science and Chemical Instrumentation Revenue billion Forecast, by Types 2020 & 2033
- Table 12: Global Life Science and Chemical Instrumentation Revenue billion Forecast, by Country 2020 & 2033
- Table 13: Brazil Life Science and Chemical Instrumentation Revenue (billion) Forecast, by Application 2020 & 2033
- Table 14: Argentina Life Science and Chemical Instrumentation Revenue (billion) Forecast, by Application 2020 & 2033
- Table 15: Rest of South America Life Science and Chemical Instrumentation Revenue (billion) Forecast, by Application 2020 & 2033
- Table 16: Global Life Science and Chemical Instrumentation Revenue billion Forecast, by Application 2020 & 2033
- Table 17: Global Life Science and Chemical Instrumentation Revenue billion Forecast, by Types 2020 & 2033
- Table 18: Global Life Science and Chemical Instrumentation Revenue billion Forecast, by Country 2020 & 2033
- Table 19: United Kingdom Life Science and Chemical Instrumentation Revenue (billion) Forecast, by Application 2020 & 2033
- Table 20: Germany Life Science and Chemical Instrumentation Revenue (billion) Forecast, by Application 2020 & 2033
- Table 21: France Life Science and Chemical Instrumentation Revenue (billion) Forecast, by Application 2020 & 2033
- Table 22: Italy Life Science and Chemical Instrumentation Revenue (billion) Forecast, by Application 2020 & 2033
- Table 23: Spain Life Science and Chemical Instrumentation Revenue (billion) Forecast, by Application 2020 & 2033
- Table 24: Russia Life Science and Chemical Instrumentation Revenue (billion) Forecast, by Application 2020 & 2033
- Table 25: Benelux Life Science and Chemical Instrumentation Revenue (billion) Forecast, by Application 2020 & 2033
- Table 26: Nordics Life Science and Chemical Instrumentation Revenue (billion) Forecast, by Application 2020 & 2033
- Table 27: Rest of Europe Life Science and Chemical Instrumentation Revenue (billion) Forecast, by Application 2020 & 2033
- Table 28: Global Life Science and Chemical Instrumentation Revenue billion Forecast, by Application 2020 & 2033
- Table 29: Global Life Science and Chemical Instrumentation Revenue billion Forecast, by Types 2020 & 2033
- Table 30: Global Life Science and Chemical Instrumentation Revenue billion Forecast, by Country 2020 & 2033
- Table 31: Turkey Life Science and Chemical Instrumentation Revenue (billion) Forecast, by Application 2020 & 2033
- Table 32: Israel Life Science and Chemical Instrumentation Revenue (billion) Forecast, by Application 2020 & 2033
- Table 33: GCC Life Science and Chemical Instrumentation Revenue (billion) Forecast, by Application 2020 & 2033
- Table 34: North Africa Life Science and Chemical Instrumentation Revenue (billion) Forecast, by Application 2020 & 2033
- Table 35: South Africa Life Science and Chemical Instrumentation Revenue (billion) Forecast, by Application 2020 & 2033
- Table 36: Rest of Middle East & Africa Life Science and Chemical Instrumentation Revenue (billion) Forecast, by Application 2020 & 2033
- Table 37: Global Life Science and Chemical Instrumentation Revenue billion Forecast, by Application 2020 & 2033
- Table 38: Global Life Science and Chemical Instrumentation Revenue billion Forecast, by Types 2020 & 2033
- Table 39: Global Life Science and Chemical Instrumentation Revenue billion Forecast, by Country 2020 & 2033
- Table 40: China Life Science and Chemical Instrumentation Revenue (billion) Forecast, by Application 2020 & 2033
- Table 41: India Life Science and Chemical Instrumentation Revenue (billion) Forecast, by Application 2020 & 2033
- Table 42: Japan Life Science and Chemical Instrumentation Revenue (billion) Forecast, by Application 2020 & 2033
- Table 43: South Korea Life Science and Chemical Instrumentation Revenue (billion) Forecast, by Application 2020 & 2033
- Table 44: ASEAN Life Science and Chemical Instrumentation Revenue (billion) Forecast, by Application 2020 & 2033
- Table 45: Oceania Life Science and Chemical Instrumentation Revenue (billion) Forecast, by Application 2020 & 2033
- Table 46: Rest of Asia Pacific Life Science and Chemical Instrumentation Revenue (billion) Forecast, by Application 2020 & 2033
Frequently Asked Questions
1. What is the projected Compound Annual Growth Rate (CAGR) of the Life Science and Chemical Instrumentation?
The projected CAGR is approximately 8.3%.
2. Which companies are prominent players in the Life Science and Chemical Instrumentation?
Key companies in the market include Thermo Fisher Scientific, Shimadzu, Danaher, Roche, Agilent Technologies, Bruker, Waters, PerkinElmer, Bio-Rad Laboratories, Mettler Toledo, Illumina, Sartorius, HORIBA, MGI Tech, JEOL.
3. What are the main segments of the Life Science and Chemical Instrumentation?
The market segments include Application, Types.
4. Can you provide details about the market size?
The market size is estimated to be USD 62.3 billion as of 2022.
5. What are some drivers contributing to market growth?
N/A
6. What are the notable trends driving market growth?
N/A
7. Are there any restraints impacting market growth?
N/A
8. Can you provide examples of recent developments in the market?
N/A
9. What pricing options are available for accessing the report?
Pricing options include single-user, multi-user, and enterprise licenses priced at USD 3950.00, USD 5925.00, and USD 7900.00 respectively.
10. Is the market size provided in terms of value or volume?
The market size is provided in terms of value, measured in billion.
11. Are there any specific market keywords associated with the report?
Yes, the market keyword associated with the report is "Life Science and Chemical Instrumentation," which aids in identifying and referencing the specific market segment covered.
12. How do I determine which pricing option suits my needs best?
The pricing options vary based on user requirements and access needs. Individual users may opt for single-user licenses, while businesses requiring broader access may choose multi-user or enterprise licenses for cost-effective access to the report.
13. Are there any additional resources or data provided in the Life Science and Chemical Instrumentation report?
While the report offers comprehensive insights, it's advisable to review the specific contents or supplementary materials provided to ascertain if additional resources or data are available.
14. How can I stay updated on further developments or reports in the Life Science and Chemical Instrumentation?
To stay informed about further developments, trends, and reports in the Life Science and Chemical Instrumentation, consider subscribing to industry newsletters, following relevant companies and organizations, or regularly checking reputable industry news sources and publications.
Methodology
Step 1 - Identification of Relevant Samples Size from Population Database


Step 2 - Approaches for Defining Global Market Size (Value, Volume* & Price*)

Note*: In applicable scenarios
Step 3 - Data Sources
Primary Research
- Web Analytics
- Survey Reports
- Research Institute
- Latest Research Reports
- Opinion Leaders
Secondary Research
- Annual Reports
- White Paper
- Latest Press Release
- Industry Association
- Paid Database
- Investor Presentations

Step 4 - Data Triangulation
Involves using different sources of information in order to increase the validity of a study
These sources are likely to be stakeholders in a program - participants, other researchers, program staff, other community members, and so on.
Then we put all data in single framework & apply various statistical tools to find out the dynamic on the market.
During the analysis stage, feedback from the stakeholder groups would be compared to determine areas of agreement as well as areas of divergence