
Key Insights
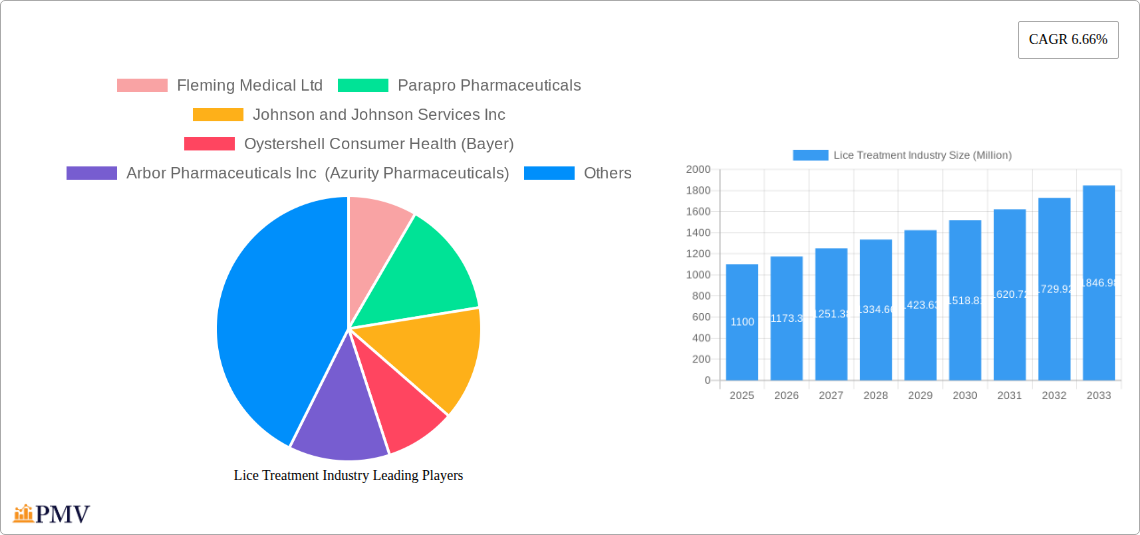
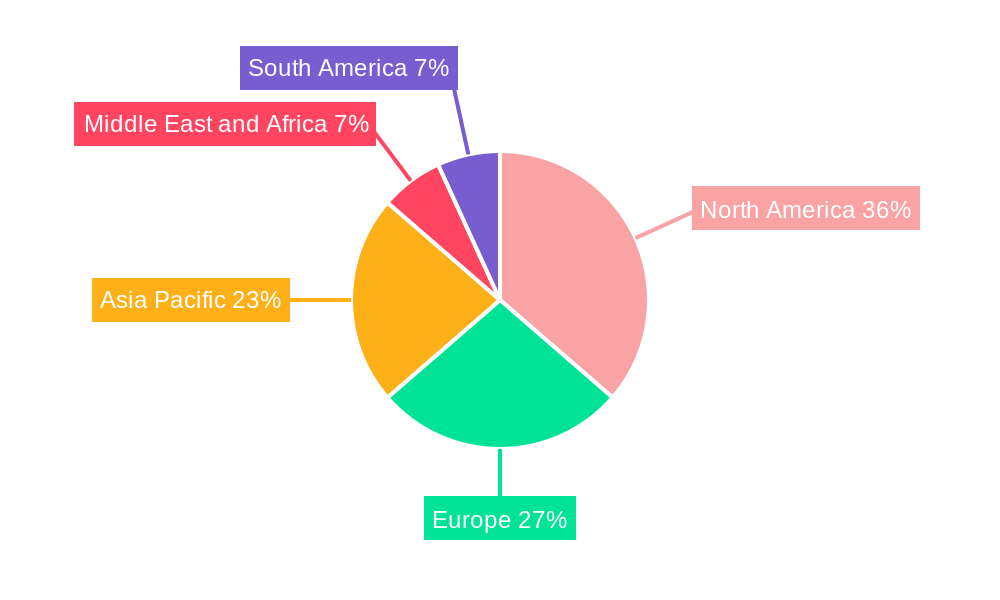
The lice treatment market, valued at $1.10 billion in 2025, is projected to experience robust growth, driven by increasing prevalence of head lice infestations globally, particularly in school-aged children. Rising awareness of effective treatment options and improved diagnostic tools contribute significantly to market expansion. The market is segmented by product type (OTC medications, prescription medications) and distribution channel (hospitals and clinics, retail pharmacies, online channels). OTC medications currently hold a larger market share due to ease of access and lower cost, but the prescription medication segment is anticipated to witness faster growth fueled by the development of novel, more effective treatments for resistant lice strains. Growth is further influenced by regional variations in healthcare infrastructure and access to treatment, with North America and Europe currently holding the largest market shares due to higher healthcare expenditure and awareness campaigns. However, Asia-Pacific is expected to show significant growth potential in the forecast period (2025-2033) owing to increasing population density and improved healthcare access in developing economies. Challenges include the emergence of pesticide-resistant lice strains, necessitating the development and adoption of novel treatment methodologies and increased regulation regarding the use of certain pesticides in lice treatment products. Furthermore, consumer preference for natural and organic treatment options is also shaping market dynamics, driving innovation in this segment.
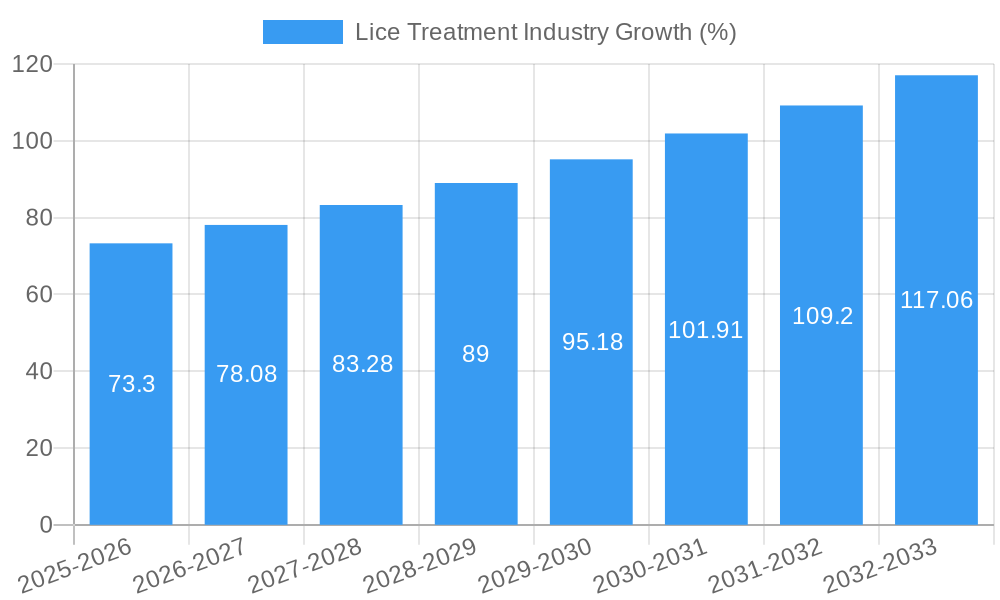
The 6.66% CAGR projected for the lice treatment market through 2033 suggests a substantial increase in market value over the forecast period. This growth is expected to be fueled by several factors, including increased public health initiatives to educate and prevent infestations, the development of more effective and convenient treatment options (e.g., topical lotions, shampoos, and innovative devices), and the expansion of distribution channels, particularly in emerging markets. Key players like Johnson & Johnson, GlaxoSmithKline, and others are investing heavily in research and development to create innovative products that address current market needs and challenges, including resistance to existing treatments. The competitive landscape is characterized by a mix of large multinational pharmaceutical companies and smaller specialized players, leading to a dynamic market with continuous innovation and expansion. However, potential restraints include fluctuations in raw material costs, stringent regulatory approvals for new products, and the potential for generic competition impacting pricing strategies for established brands.
Lice Treatment Industry Market Report: 2019-2033
This comprehensive report provides a detailed analysis of the Lice Treatment Industry, offering invaluable insights for stakeholders across the value chain. The report covers the period from 2019 to 2033, with a focus on the 2025-2033 forecast period. The estimated market size in 2025 is valued at $XX Million. This report is crucial for understanding market dynamics, identifying growth opportunities, and making informed business decisions within this dynamic sector.
Lice Treatment Industry Market Structure & Competitive Dynamics
The global lice treatment market is characterized by a moderately concentrated structure, with several key players commanding significant market share. Market leaders such as Johnson & Johnson Services Inc and GlaxoSmithKline benefit from established brand recognition and extensive distribution networks. However, the market also accommodates smaller, specialized companies like Fleming Medical Ltd and Parapro Pharmaceuticals, often focusing on niche product offerings or innovative treatment methods. The competitive landscape is influenced by continuous product innovation, regulatory changes, and evolving consumer preferences. Mergers and acquisitions (M&A) play a role in shaping market dynamics, with deal values fluctuating based on target company size and technological advancements. For instance, a significant M&A event in recent years involved [Insert Example M&A deal if data is available, including approximate deal value in Millions]. Innovation ecosystems are vital, with companies investing in R&D to develop more effective and convenient lice treatment solutions. The regulatory framework, particularly concerning the approval of new drugs and treatment methodologies, plays a crucial role in shaping market entry barriers and overall competition. Furthermore, the availability of alternative treatment methods and growing consumer awareness impact product substitution and market share. End-user trends, including a rising preference for natural and less toxic products, pose both challenges and opportunities for companies.
- Market Concentration: Moderately concentrated with key players holding significant shares.
- Innovation Ecosystems: Active R&D and investment in new treatment modalities.
- Regulatory Frameworks: Stringent regulations impact market entry and product development.
- Product Substitutes: Presence of alternative treatment methods influence market dynamics.
- End-User Trends: Growing preference for natural and less toxic products.
- M&A Activity: Occasional significant mergers and acquisitions impacting market structure. (Approximate total M&A value for the period 2019-2024: $XX Million)
Lice Treatment Industry Industry Trends & Insights
The lice treatment industry is experiencing growth driven by several key factors. The rising prevalence of head lice infestations, particularly in school-aged children, fuels demand for effective treatment options. Technological advancements, such as the development of novel formulations and delivery systems (e.g., improved topical medications, heated air treatments), are leading to improved efficacy and reduced treatment times. Changing consumer preferences, with an increased focus on natural and less toxic products, are driving innovation in the market. The competitive landscape is characterized by both established pharmaceutical companies and smaller, specialized firms offering a range of treatment options. Market growth is further influenced by increasing awareness campaigns and educational initiatives promoting hygiene and effective lice management. The CAGR for the lice treatment market during the forecast period (2025-2033) is estimated to be xx%. Market penetration, especially in developing economies, has significant potential for growth. However, challenges remain such as resistance to existing treatments and the need for more effective and convenient treatment options. Overall, the market exhibits strong growth potential, driven by a confluence of factors, but faces challenges relating to treatment resistance and consumer preferences for safer, more natural options.
Dominant Markets & Segments in Lice Treatment Industry
The North American region currently dominates the global lice treatment market, driven primarily by high prevalence rates of head lice infestations and strong healthcare infrastructure. Within this region, the United States holds the largest market share. The dominance of North America is also attributed to factors such as high disposable incomes and widespread access to healthcare facilities.
By Product Type:
- OTC Medication: This segment accounts for the largest share of the market due to high accessibility, convenience, and lower cost compared to prescription medications. Market growth in this segment is driven by rising awareness and self-treatment practices.
- Prescription Medication: This segment represents a smaller, yet significant part of the market. It caters to severe or persistent lice infestations that do not respond to OTC treatments. Stricter regulations and doctor visits for prescriptions somewhat limit its growth potential.
By Distribution Channel:
- Retail Pharmacies: This is the dominant distribution channel for OTC medications. Convenience and widespread availability contribute to its significant market share.
- Hospitals and Clinics: This channel primarily serves patients with severe infestations or those requiring prescription medications.
- Other Distribution Channels: This segment encompasses online retailers, specialized clinics, and other channels offering niche products or services. This channel experiences significant growth driven by consumer preference and increased online commerce.
Key Drivers for Dominant Regions & Segments:
- North America: High prevalence of head lice, strong healthcare infrastructure, high disposable incomes.
- OTC Medications: Accessibility, affordability, and convenience drive market growth.
- Retail Pharmacies: Widespread availability and consumer convenience.
Lice Treatment Industry Product Innovations
Recent innovations in the lice treatment industry focus on developing more effective and user-friendly products. This includes formulations with improved efficacy against resistant lice strains, and alternative treatment approaches such as heated air combing, that reduce reliance on chemical pesticides. There's a growing emphasis on developing products with natural ingredients and minimal side effects, reflecting consumer demand for safer alternatives. These innovations cater to evolving market needs by providing better treatment outcomes and addressing consumer concerns regarding the safety and efficacy of traditional lice treatments. Market fit is enhanced through improved ease of use, reduced treatment times, and alignment with preferences for natural and sustainable solutions.
Report Segmentation & Scope
This report segments the lice treatment market comprehensively by product type (OTC medication and prescription medication) and by distribution channel (hospitals and clinics, retail pharmacies, and other distribution channels). Each segment’s growth trajectory is assessed individually, offering market size projections and competitive landscape analyses for the period 2025-2033. The OTC medication segment is projected to witness robust growth, driven by its accessibility and convenience. The prescription medication segment, though smaller, is expected to witness moderate growth due to its focus on severe cases. Retail pharmacies maintain their dominant position in distribution, while the "other distribution channels" segment shows significant growth potential fueled by expanding e-commerce and specialized services.
Key Drivers of Lice Treatment Industry Growth
The lice treatment industry is propelled by several significant factors. The increasing prevalence of head lice infestations, particularly amongst children, is a primary driver. Improvements in treatment efficacy through innovations in product formulations and delivery mechanisms contribute to market expansion. The rising consumer awareness about the risks associated with untreated head lice and the demand for safe and effective solutions further boost market growth. Regulatory changes and supportive government initiatives promoting health and hygiene also stimulate market activity.
Challenges in the Lice Treatment Industry Sector
The lice treatment industry faces challenges such as the development of resistance to existing treatments, which necessitates the development of new and innovative solutions. Supply chain disruptions, particularly regarding the availability of key raw materials, can impact production and market availability. The competitive landscape, with a mix of established and emerging players, necessitates strategic investment in research and development and effective marketing strategies to maintain a strong market position. Regulatory hurdles associated with approval of new products and formulations also present a significant challenge. Finally, the rising prevalence of counterfeit products impacts both market legitimacy and consumer confidence. These challenges, if not effectively addressed, could hinder market growth and profit margins.
Leading Players in the Lice Treatment Industry Market
- Fleming Medical Ltd
- Parapro Pharmaceuticals
- Johnson & Johnson Services Inc
- Oystershell Consumer Health (Bayer)
- Arbor Pharmaceuticals Inc (Azurity Pharmaceuticals)
- Alliance Pharmaceuticals Ltd
- Perrigo Company plc (Omega Pharma)
- GlaxoSmithKline
- Prestige Consumer Healthcare Inc
Key Developments in Lice Treatment Industry Sector
- October 2022: Alliance Pharmaceuticals initiated a clinical trial for Vamousse Spray 'n' Go.
- September 2022: The American Academy of Pediatrics updated its head lice treatment guidelines.
- October 2021: Lice Clinics of America announced 750,000 successful treatments using heated air.
- August 2021: ParaPRO's Natroba (spinosad) received FDA approval for scabies treatment.
Strategic Lice Treatment Industry Market Outlook
The lice treatment market is poised for continued growth, driven by several factors. Ongoing research and development will result in new and improved treatment options, addressing limitations of current therapies. Increasing public awareness campaigns and improved hygiene practices will contribute to a more proactive approach to lice management. Expansion into untapped markets and the development of innovative distribution channels will enhance market accessibility. Furthermore, the growing focus on natural and less toxic treatment solutions will shape future product innovation and market segmentation. Companies proactively adapting to these trends will enjoy significant growth opportunities in the years to come.
Lice Treatment Industry Segmentation
-
1. Product Type
- 1.1. OTC Medication
- 1.2. Prescription Medication
-
2. Distribution Channel
- 2.1. Hospitals and Clinics
- 2.2. Retail Pharmacies
- 2.3. Other Distribution Channels
Lice Treatment Industry Segmentation By Geography
-
1. North America
- 1.1. United States
- 1.2. Canada
- 1.3. Mexico
-
2. Europe
- 2.1. Germany
- 2.2. United Kingdom
- 2.3. France
- 2.4. Italy
- 2.5. Spain
- 2.6. Rest of Europe
-
3. Asia Pacific
- 3.1. China
- 3.2. Japan
- 3.3. India
- 3.4. Australia
- 3.5. South Korea
- 3.6. Rest of Asia Pacific
-
4. Middle East and Africa
- 4.1. GCC
- 4.2. South Africa
- 4.3. Rest of Middle East and Africa
-
5. South America
- 5.1. Brazil
- 5.2. Argentina
- 5.3. Rest of South America
Lice Treatment Industry REPORT HIGHLIGHTS
| Aspects | Details |
|---|---|
| Study Period | 2019-2033 |
| Base Year | 2024 |
| Estimated Year | 2025 |
| Forecast Period | 2025-2033 |
| Historical Period | 2019-2024 |
| Growth Rate | CAGR of 6.66% from 2019-2033 |
| Segmentation |
|
Table of Contents
- 1. Introduction
- 1.1. Research Scope
- 1.2. Market Segmentation
- 1.3. Research Methodology
- 1.4. Definitions and Assumptions
- 2. Executive Summary
- 2.1. Introduction
- 3. Market Dynamics
- 3.1. Introduction
- 3.2. Market Drivers
- 3.2.1. Increasing Prevalence of Lice Infestation; Easy Availability of Lice Treatment Products
- 3.3. Market Restrains
- 3.3.1. Lack of Awareness and Less Healthcare Expenditure in Developing Countries
- 3.4. Market Trends
- 3.4.1. Permethrin Segment is Expected to Hold a Major Share in the Market
- 4. Market Factor Analysis
- 4.1. Porters Five Forces
- 4.2. Supply/Value Chain
- 4.3. PESTEL analysis
- 4.4. Market Entropy
- 4.5. Patent/Trademark Analysis
- 5. Global Lice Treatment Industry Analysis, Insights and Forecast, 2019-2031
- 5.1. Market Analysis, Insights and Forecast - by Product Type
- 5.1.1. OTC Medication
- 5.1.2. Prescription Medication
- 5.2. Market Analysis, Insights and Forecast - by Distribution Channel
- 5.2.1. Hospitals and Clinics
- 5.2.2. Retail Pharmacies
- 5.2.3. Other Distribution Channels
- 5.3. Market Analysis, Insights and Forecast - by Region
- 5.3.1. North America
- 5.3.2. Europe
- 5.3.3. Asia Pacific
- 5.3.4. Middle East and Africa
- 5.3.5. South America
- 5.1. Market Analysis, Insights and Forecast - by Product Type
- 6. North America Lice Treatment Industry Analysis, Insights and Forecast, 2019-2031
- 6.1. Market Analysis, Insights and Forecast - by Product Type
- 6.1.1. OTC Medication
- 6.1.2. Prescription Medication
- 6.2. Market Analysis, Insights and Forecast - by Distribution Channel
- 6.2.1. Hospitals and Clinics
- 6.2.2. Retail Pharmacies
- 6.2.3. Other Distribution Channels
- 6.1. Market Analysis, Insights and Forecast - by Product Type
- 7. Europe Lice Treatment Industry Analysis, Insights and Forecast, 2019-2031
- 7.1. Market Analysis, Insights and Forecast - by Product Type
- 7.1.1. OTC Medication
- 7.1.2. Prescription Medication
- 7.2. Market Analysis, Insights and Forecast - by Distribution Channel
- 7.2.1. Hospitals and Clinics
- 7.2.2. Retail Pharmacies
- 7.2.3. Other Distribution Channels
- 7.1. Market Analysis, Insights and Forecast - by Product Type
- 8. Asia Pacific Lice Treatment Industry Analysis, Insights and Forecast, 2019-2031
- 8.1. Market Analysis, Insights and Forecast - by Product Type
- 8.1.1. OTC Medication
- 8.1.2. Prescription Medication
- 8.2. Market Analysis, Insights and Forecast - by Distribution Channel
- 8.2.1. Hospitals and Clinics
- 8.2.2. Retail Pharmacies
- 8.2.3. Other Distribution Channels
- 8.1. Market Analysis, Insights and Forecast - by Product Type
- 9. Middle East and Africa Lice Treatment Industry Analysis, Insights and Forecast, 2019-2031
- 9.1. Market Analysis, Insights and Forecast - by Product Type
- 9.1.1. OTC Medication
- 9.1.2. Prescription Medication
- 9.2. Market Analysis, Insights and Forecast - by Distribution Channel
- 9.2.1. Hospitals and Clinics
- 9.2.2. Retail Pharmacies
- 9.2.3. Other Distribution Channels
- 9.1. Market Analysis, Insights and Forecast - by Product Type
- 10. South America Lice Treatment Industry Analysis, Insights and Forecast, 2019-2031
- 10.1. Market Analysis, Insights and Forecast - by Product Type
- 10.1.1. OTC Medication
- 10.1.2. Prescription Medication
- 10.2. Market Analysis, Insights and Forecast - by Distribution Channel
- 10.2.1. Hospitals and Clinics
- 10.2.2. Retail Pharmacies
- 10.2.3. Other Distribution Channels
- 10.1. Market Analysis, Insights and Forecast - by Product Type
- 11. North America Lice Treatment Industry Analysis, Insights and Forecast, 2019-2031
- 11.1. Market Analysis, Insights and Forecast - By Country/Sub-region
- 11.1.1 United States
- 11.1.2 Canada
- 11.1.3 Mexico
- 12. Europe Lice Treatment Industry Analysis, Insights and Forecast, 2019-2031
- 12.1. Market Analysis, Insights and Forecast - By Country/Sub-region
- 12.1.1 Germany
- 12.1.2 United Kingdom
- 12.1.3 France
- 12.1.4 Italy
- 12.1.5 Spain
- 12.1.6 Rest of Europe
- 13. Asia Pacific Lice Treatment Industry Analysis, Insights and Forecast, 2019-2031
- 13.1. Market Analysis, Insights and Forecast - By Country/Sub-region
- 13.1.1 China
- 13.1.2 Japan
- 13.1.3 India
- 13.1.4 Australia
- 13.1.5 South Korea
- 13.1.6 Rest of Asia Pacific
- 14. Middle East and Africa Lice Treatment Industry Analysis, Insights and Forecast, 2019-2031
- 14.1. Market Analysis, Insights and Forecast - By Country/Sub-region
- 14.1.1 GCC
- 14.1.2 South Africa
- 14.1.3 Rest of Middle East and Africa
- 15. South America Lice Treatment Industry Analysis, Insights and Forecast, 2019-2031
- 15.1. Market Analysis, Insights and Forecast - By Country/Sub-region
- 15.1.1 Brazil
- 15.1.2 Argentina
- 15.1.3 Rest of South America
- 16. Competitive Analysis
- 16.1. Global Market Share Analysis 2024
- 16.2. Company Profiles
- 16.2.1 Fleming Medical Ltd
- 16.2.1.1. Overview
- 16.2.1.2. Products
- 16.2.1.3. SWOT Analysis
- 16.2.1.4. Recent Developments
- 16.2.1.5. Financials (Based on Availability)
- 16.2.2 Parapro Pharmaceuticals
- 16.2.2.1. Overview
- 16.2.2.2. Products
- 16.2.2.3. SWOT Analysis
- 16.2.2.4. Recent Developments
- 16.2.2.5. Financials (Based on Availability)
- 16.2.3 Johnson and Johnson Services Inc
- 16.2.3.1. Overview
- 16.2.3.2. Products
- 16.2.3.3. SWOT Analysis
- 16.2.3.4. Recent Developments
- 16.2.3.5. Financials (Based on Availability)
- 16.2.4 Oystershell Consumer Health (Bayer)
- 16.2.4.1. Overview
- 16.2.4.2. Products
- 16.2.4.3. SWOT Analysis
- 16.2.4.4. Recent Developments
- 16.2.4.5. Financials (Based on Availability)
- 16.2.5 Arbor Pharmaceuticals Inc (Azurity Pharmaceuticals)
- 16.2.5.1. Overview
- 16.2.5.2. Products
- 16.2.5.3. SWOT Analysis
- 16.2.5.4. Recent Developments
- 16.2.5.5. Financials (Based on Availability)
- 16.2.6 Alliance Pharmaceuticals Ltd
- 16.2.6.1. Overview
- 16.2.6.2. Products
- 16.2.6.3. SWOT Analysis
- 16.2.6.4. Recent Developments
- 16.2.6.5. Financials (Based on Availability)
- 16.2.7 Perrigo Company plc (Omega Pharma)
- 16.2.7.1. Overview
- 16.2.7.2. Products
- 16.2.7.3. SWOT Analysis
- 16.2.7.4. Recent Developments
- 16.2.7.5. Financials (Based on Availability)
- 16.2.8 GlaxoSmithKline
- 16.2.8.1. Overview
- 16.2.8.2. Products
- 16.2.8.3. SWOT Analysis
- 16.2.8.4. Recent Developments
- 16.2.8.5. Financials (Based on Availability)
- 16.2.9 Prestige Consumer Healthcare Inc
- 16.2.9.1. Overview
- 16.2.9.2. Products
- 16.2.9.3. SWOT Analysis
- 16.2.9.4. Recent Developments
- 16.2.9.5. Financials (Based on Availability)
- 16.2.1 Fleming Medical Ltd
List of Figures
- Figure 1: Global Lice Treatment Industry Revenue Breakdown (Million, %) by Region 2024 & 2032
- Figure 2: Global Lice Treatment Industry Volume Breakdown (K Unit, %) by Region 2024 & 2032
- Figure 3: North America Lice Treatment Industry Revenue (Million), by Country 2024 & 2032
- Figure 4: North America Lice Treatment Industry Volume (K Unit), by Country 2024 & 2032
- Figure 5: North America Lice Treatment Industry Revenue Share (%), by Country 2024 & 2032
- Figure 6: North America Lice Treatment Industry Volume Share (%), by Country 2024 & 2032
- Figure 7: Europe Lice Treatment Industry Revenue (Million), by Country 2024 & 2032
- Figure 8: Europe Lice Treatment Industry Volume (K Unit), by Country 2024 & 2032
- Figure 9: Europe Lice Treatment Industry Revenue Share (%), by Country 2024 & 2032
- Figure 10: Europe Lice Treatment Industry Volume Share (%), by Country 2024 & 2032
- Figure 11: Asia Pacific Lice Treatment Industry Revenue (Million), by Country 2024 & 2032
- Figure 12: Asia Pacific Lice Treatment Industry Volume (K Unit), by Country 2024 & 2032
- Figure 13: Asia Pacific Lice Treatment Industry Revenue Share (%), by Country 2024 & 2032
- Figure 14: Asia Pacific Lice Treatment Industry Volume Share (%), by Country 2024 & 2032
- Figure 15: Middle East and Africa Lice Treatment Industry Revenue (Million), by Country 2024 & 2032
- Figure 16: Middle East and Africa Lice Treatment Industry Volume (K Unit), by Country 2024 & 2032
- Figure 17: Middle East and Africa Lice Treatment Industry Revenue Share (%), by Country 2024 & 2032
- Figure 18: Middle East and Africa Lice Treatment Industry Volume Share (%), by Country 2024 & 2032
- Figure 19: South America Lice Treatment Industry Revenue (Million), by Country 2024 & 2032
- Figure 20: South America Lice Treatment Industry Volume (K Unit), by Country 2024 & 2032
- Figure 21: South America Lice Treatment Industry Revenue Share (%), by Country 2024 & 2032
- Figure 22: South America Lice Treatment Industry Volume Share (%), by Country 2024 & 2032
- Figure 23: North America Lice Treatment Industry Revenue (Million), by Product Type 2024 & 2032
- Figure 24: North America Lice Treatment Industry Volume (K Unit), by Product Type 2024 & 2032
- Figure 25: North America Lice Treatment Industry Revenue Share (%), by Product Type 2024 & 2032
- Figure 26: North America Lice Treatment Industry Volume Share (%), by Product Type 2024 & 2032
- Figure 27: North America Lice Treatment Industry Revenue (Million), by Distribution Channel 2024 & 2032
- Figure 28: North America Lice Treatment Industry Volume (K Unit), by Distribution Channel 2024 & 2032
- Figure 29: North America Lice Treatment Industry Revenue Share (%), by Distribution Channel 2024 & 2032
- Figure 30: North America Lice Treatment Industry Volume Share (%), by Distribution Channel 2024 & 2032
- Figure 31: North America Lice Treatment Industry Revenue (Million), by Country 2024 & 2032
- Figure 32: North America Lice Treatment Industry Volume (K Unit), by Country 2024 & 2032
- Figure 33: North America Lice Treatment Industry Revenue Share (%), by Country 2024 & 2032
- Figure 34: North America Lice Treatment Industry Volume Share (%), by Country 2024 & 2032
- Figure 35: Europe Lice Treatment Industry Revenue (Million), by Product Type 2024 & 2032
- Figure 36: Europe Lice Treatment Industry Volume (K Unit), by Product Type 2024 & 2032
- Figure 37: Europe Lice Treatment Industry Revenue Share (%), by Product Type 2024 & 2032
- Figure 38: Europe Lice Treatment Industry Volume Share (%), by Product Type 2024 & 2032
- Figure 39: Europe Lice Treatment Industry Revenue (Million), by Distribution Channel 2024 & 2032
- Figure 40: Europe Lice Treatment Industry Volume (K Unit), by Distribution Channel 2024 & 2032
- Figure 41: Europe Lice Treatment Industry Revenue Share (%), by Distribution Channel 2024 & 2032
- Figure 42: Europe Lice Treatment Industry Volume Share (%), by Distribution Channel 2024 & 2032
- Figure 43: Europe Lice Treatment Industry Revenue (Million), by Country 2024 & 2032
- Figure 44: Europe Lice Treatment Industry Volume (K Unit), by Country 2024 & 2032
- Figure 45: Europe Lice Treatment Industry Revenue Share (%), by Country 2024 & 2032
- Figure 46: Europe Lice Treatment Industry Volume Share (%), by Country 2024 & 2032
- Figure 47: Asia Pacific Lice Treatment Industry Revenue (Million), by Product Type 2024 & 2032
- Figure 48: Asia Pacific Lice Treatment Industry Volume (K Unit), by Product Type 2024 & 2032
- Figure 49: Asia Pacific Lice Treatment Industry Revenue Share (%), by Product Type 2024 & 2032
- Figure 50: Asia Pacific Lice Treatment Industry Volume Share (%), by Product Type 2024 & 2032
- Figure 51: Asia Pacific Lice Treatment Industry Revenue (Million), by Distribution Channel 2024 & 2032
- Figure 52: Asia Pacific Lice Treatment Industry Volume (K Unit), by Distribution Channel 2024 & 2032
- Figure 53: Asia Pacific Lice Treatment Industry Revenue Share (%), by Distribution Channel 2024 & 2032
- Figure 54: Asia Pacific Lice Treatment Industry Volume Share (%), by Distribution Channel 2024 & 2032
- Figure 55: Asia Pacific Lice Treatment Industry Revenue (Million), by Country 2024 & 2032
- Figure 56: Asia Pacific Lice Treatment Industry Volume (K Unit), by Country 2024 & 2032
- Figure 57: Asia Pacific Lice Treatment Industry Revenue Share (%), by Country 2024 & 2032
- Figure 58: Asia Pacific Lice Treatment Industry Volume Share (%), by Country 2024 & 2032
- Figure 59: Middle East and Africa Lice Treatment Industry Revenue (Million), by Product Type 2024 & 2032
- Figure 60: Middle East and Africa Lice Treatment Industry Volume (K Unit), by Product Type 2024 & 2032
- Figure 61: Middle East and Africa Lice Treatment Industry Revenue Share (%), by Product Type 2024 & 2032
- Figure 62: Middle East and Africa Lice Treatment Industry Volume Share (%), by Product Type 2024 & 2032
- Figure 63: Middle East and Africa Lice Treatment Industry Revenue (Million), by Distribution Channel 2024 & 2032
- Figure 64: Middle East and Africa Lice Treatment Industry Volume (K Unit), by Distribution Channel 2024 & 2032
- Figure 65: Middle East and Africa Lice Treatment Industry Revenue Share (%), by Distribution Channel 2024 & 2032
- Figure 66: Middle East and Africa Lice Treatment Industry Volume Share (%), by Distribution Channel 2024 & 2032
- Figure 67: Middle East and Africa Lice Treatment Industry Revenue (Million), by Country 2024 & 2032
- Figure 68: Middle East and Africa Lice Treatment Industry Volume (K Unit), by Country 2024 & 2032
- Figure 69: Middle East and Africa Lice Treatment Industry Revenue Share (%), by Country 2024 & 2032
- Figure 70: Middle East and Africa Lice Treatment Industry Volume Share (%), by Country 2024 & 2032
- Figure 71: South America Lice Treatment Industry Revenue (Million), by Product Type 2024 & 2032
- Figure 72: South America Lice Treatment Industry Volume (K Unit), by Product Type 2024 & 2032
- Figure 73: South America Lice Treatment Industry Revenue Share (%), by Product Type 2024 & 2032
- Figure 74: South America Lice Treatment Industry Volume Share (%), by Product Type 2024 & 2032
- Figure 75: South America Lice Treatment Industry Revenue (Million), by Distribution Channel 2024 & 2032
- Figure 76: South America Lice Treatment Industry Volume (K Unit), by Distribution Channel 2024 & 2032
- Figure 77: South America Lice Treatment Industry Revenue Share (%), by Distribution Channel 2024 & 2032
- Figure 78: South America Lice Treatment Industry Volume Share (%), by Distribution Channel 2024 & 2032
- Figure 79: South America Lice Treatment Industry Revenue (Million), by Country 2024 & 2032
- Figure 80: South America Lice Treatment Industry Volume (K Unit), by Country 2024 & 2032
- Figure 81: South America Lice Treatment Industry Revenue Share (%), by Country 2024 & 2032
- Figure 82: South America Lice Treatment Industry Volume Share (%), by Country 2024 & 2032
List of Tables
- Table 1: Global Lice Treatment Industry Revenue Million Forecast, by Region 2019 & 2032
- Table 2: Global Lice Treatment Industry Volume K Unit Forecast, by Region 2019 & 2032
- Table 3: Global Lice Treatment Industry Revenue Million Forecast, by Product Type 2019 & 2032
- Table 4: Global Lice Treatment Industry Volume K Unit Forecast, by Product Type 2019 & 2032
- Table 5: Global Lice Treatment Industry Revenue Million Forecast, by Distribution Channel 2019 & 2032
- Table 6: Global Lice Treatment Industry Volume K Unit Forecast, by Distribution Channel 2019 & 2032
- Table 7: Global Lice Treatment Industry Revenue Million Forecast, by Region 2019 & 2032
- Table 8: Global Lice Treatment Industry Volume K Unit Forecast, by Region 2019 & 2032
- Table 9: Global Lice Treatment Industry Revenue Million Forecast, by Country 2019 & 2032
- Table 10: Global Lice Treatment Industry Volume K Unit Forecast, by Country 2019 & 2032
- Table 11: United States Lice Treatment Industry Revenue (Million) Forecast, by Application 2019 & 2032
- Table 12: United States Lice Treatment Industry Volume (K Unit) Forecast, by Application 2019 & 2032
- Table 13: Canada Lice Treatment Industry Revenue (Million) Forecast, by Application 2019 & 2032
- Table 14: Canada Lice Treatment Industry Volume (K Unit) Forecast, by Application 2019 & 2032
- Table 15: Mexico Lice Treatment Industry Revenue (Million) Forecast, by Application 2019 & 2032
- Table 16: Mexico Lice Treatment Industry Volume (K Unit) Forecast, by Application 2019 & 2032
- Table 17: Global Lice Treatment Industry Revenue Million Forecast, by Country 2019 & 2032
- Table 18: Global Lice Treatment Industry Volume K Unit Forecast, by Country 2019 & 2032
- Table 19: Germany Lice Treatment Industry Revenue (Million) Forecast, by Application 2019 & 2032
- Table 20: Germany Lice Treatment Industry Volume (K Unit) Forecast, by Application 2019 & 2032
- Table 21: United Kingdom Lice Treatment Industry Revenue (Million) Forecast, by Application 2019 & 2032
- Table 22: United Kingdom Lice Treatment Industry Volume (K Unit) Forecast, by Application 2019 & 2032
- Table 23: France Lice Treatment Industry Revenue (Million) Forecast, by Application 2019 & 2032
- Table 24: France Lice Treatment Industry Volume (K Unit) Forecast, by Application 2019 & 2032
- Table 25: Italy Lice Treatment Industry Revenue (Million) Forecast, by Application 2019 & 2032
- Table 26: Italy Lice Treatment Industry Volume (K Unit) Forecast, by Application 2019 & 2032
- Table 27: Spain Lice Treatment Industry Revenue (Million) Forecast, by Application 2019 & 2032
- Table 28: Spain Lice Treatment Industry Volume (K Unit) Forecast, by Application 2019 & 2032
- Table 29: Rest of Europe Lice Treatment Industry Revenue (Million) Forecast, by Application 2019 & 2032
- Table 30: Rest of Europe Lice Treatment Industry Volume (K Unit) Forecast, by Application 2019 & 2032
- Table 31: Global Lice Treatment Industry Revenue Million Forecast, by Country 2019 & 2032
- Table 32: Global Lice Treatment Industry Volume K Unit Forecast, by Country 2019 & 2032
- Table 33: China Lice Treatment Industry Revenue (Million) Forecast, by Application 2019 & 2032
- Table 34: China Lice Treatment Industry Volume (K Unit) Forecast, by Application 2019 & 2032
- Table 35: Japan Lice Treatment Industry Revenue (Million) Forecast, by Application 2019 & 2032
- Table 36: Japan Lice Treatment Industry Volume (K Unit) Forecast, by Application 2019 & 2032
- Table 37: India Lice Treatment Industry Revenue (Million) Forecast, by Application 2019 & 2032
- Table 38: India Lice Treatment Industry Volume (K Unit) Forecast, by Application 2019 & 2032
- Table 39: Australia Lice Treatment Industry Revenue (Million) Forecast, by Application 2019 & 2032
- Table 40: Australia Lice Treatment Industry Volume (K Unit) Forecast, by Application 2019 & 2032
- Table 41: South Korea Lice Treatment Industry Revenue (Million) Forecast, by Application 2019 & 2032
- Table 42: South Korea Lice Treatment Industry Volume (K Unit) Forecast, by Application 2019 & 2032
- Table 43: Rest of Asia Pacific Lice Treatment Industry Revenue (Million) Forecast, by Application 2019 & 2032
- Table 44: Rest of Asia Pacific Lice Treatment Industry Volume (K Unit) Forecast, by Application 2019 & 2032
- Table 45: Global Lice Treatment Industry Revenue Million Forecast, by Country 2019 & 2032
- Table 46: Global Lice Treatment Industry Volume K Unit Forecast, by Country 2019 & 2032
- Table 47: GCC Lice Treatment Industry Revenue (Million) Forecast, by Application 2019 & 2032
- Table 48: GCC Lice Treatment Industry Volume (K Unit) Forecast, by Application 2019 & 2032
- Table 49: South Africa Lice Treatment Industry Revenue (Million) Forecast, by Application 2019 & 2032
- Table 50: South Africa Lice Treatment Industry Volume (K Unit) Forecast, by Application 2019 & 2032
- Table 51: Rest of Middle East and Africa Lice Treatment Industry Revenue (Million) Forecast, by Application 2019 & 2032
- Table 52: Rest of Middle East and Africa Lice Treatment Industry Volume (K Unit) Forecast, by Application 2019 & 2032
- Table 53: Global Lice Treatment Industry Revenue Million Forecast, by Country 2019 & 2032
- Table 54: Global Lice Treatment Industry Volume K Unit Forecast, by Country 2019 & 2032
- Table 55: Brazil Lice Treatment Industry Revenue (Million) Forecast, by Application 2019 & 2032
- Table 56: Brazil Lice Treatment Industry Volume (K Unit) Forecast, by Application 2019 & 2032
- Table 57: Argentina Lice Treatment Industry Revenue (Million) Forecast, by Application 2019 & 2032
- Table 58: Argentina Lice Treatment Industry Volume (K Unit) Forecast, by Application 2019 & 2032
- Table 59: Rest of South America Lice Treatment Industry Revenue (Million) Forecast, by Application 2019 & 2032
- Table 60: Rest of South America Lice Treatment Industry Volume (K Unit) Forecast, by Application 2019 & 2032
- Table 61: Global Lice Treatment Industry Revenue Million Forecast, by Product Type 2019 & 2032
- Table 62: Global Lice Treatment Industry Volume K Unit Forecast, by Product Type 2019 & 2032
- Table 63: Global Lice Treatment Industry Revenue Million Forecast, by Distribution Channel 2019 & 2032
- Table 64: Global Lice Treatment Industry Volume K Unit Forecast, by Distribution Channel 2019 & 2032
- Table 65: Global Lice Treatment Industry Revenue Million Forecast, by Country 2019 & 2032
- Table 66: Global Lice Treatment Industry Volume K Unit Forecast, by Country 2019 & 2032
- Table 67: United States Lice Treatment Industry Revenue (Million) Forecast, by Application 2019 & 2032
- Table 68: United States Lice Treatment Industry Volume (K Unit) Forecast, by Application 2019 & 2032
- Table 69: Canada Lice Treatment Industry Revenue (Million) Forecast, by Application 2019 & 2032
- Table 70: Canada Lice Treatment Industry Volume (K Unit) Forecast, by Application 2019 & 2032
- Table 71: Mexico Lice Treatment Industry Revenue (Million) Forecast, by Application 2019 & 2032
- Table 72: Mexico Lice Treatment Industry Volume (K Unit) Forecast, by Application 2019 & 2032
- Table 73: Global Lice Treatment Industry Revenue Million Forecast, by Product Type 2019 & 2032
- Table 74: Global Lice Treatment Industry Volume K Unit Forecast, by Product Type 2019 & 2032
- Table 75: Global Lice Treatment Industry Revenue Million Forecast, by Distribution Channel 2019 & 2032
- Table 76: Global Lice Treatment Industry Volume K Unit Forecast, by Distribution Channel 2019 & 2032
- Table 77: Global Lice Treatment Industry Revenue Million Forecast, by Country 2019 & 2032
- Table 78: Global Lice Treatment Industry Volume K Unit Forecast, by Country 2019 & 2032
- Table 79: Germany Lice Treatment Industry Revenue (Million) Forecast, by Application 2019 & 2032
- Table 80: Germany Lice Treatment Industry Volume (K Unit) Forecast, by Application 2019 & 2032
- Table 81: United Kingdom Lice Treatment Industry Revenue (Million) Forecast, by Application 2019 & 2032
- Table 82: United Kingdom Lice Treatment Industry Volume (K Unit) Forecast, by Application 2019 & 2032
- Table 83: France Lice Treatment Industry Revenue (Million) Forecast, by Application 2019 & 2032
- Table 84: France Lice Treatment Industry Volume (K Unit) Forecast, by Application 2019 & 2032
- Table 85: Italy Lice Treatment Industry Revenue (Million) Forecast, by Application 2019 & 2032
- Table 86: Italy Lice Treatment Industry Volume (K Unit) Forecast, by Application 2019 & 2032
- Table 87: Spain Lice Treatment Industry Revenue (Million) Forecast, by Application 2019 & 2032
- Table 88: Spain Lice Treatment Industry Volume (K Unit) Forecast, by Application 2019 & 2032
- Table 89: Rest of Europe Lice Treatment Industry Revenue (Million) Forecast, by Application 2019 & 2032
- Table 90: Rest of Europe Lice Treatment Industry Volume (K Unit) Forecast, by Application 2019 & 2032
- Table 91: Global Lice Treatment Industry Revenue Million Forecast, by Product Type 2019 & 2032
- Table 92: Global Lice Treatment Industry Volume K Unit Forecast, by Product Type 2019 & 2032
- Table 93: Global Lice Treatment Industry Revenue Million Forecast, by Distribution Channel 2019 & 2032
- Table 94: Global Lice Treatment Industry Volume K Unit Forecast, by Distribution Channel 2019 & 2032
- Table 95: Global Lice Treatment Industry Revenue Million Forecast, by Country 2019 & 2032
- Table 96: Global Lice Treatment Industry Volume K Unit Forecast, by Country 2019 & 2032
- Table 97: China Lice Treatment Industry Revenue (Million) Forecast, by Application 2019 & 2032
- Table 98: China Lice Treatment Industry Volume (K Unit) Forecast, by Application 2019 & 2032
- Table 99: Japan Lice Treatment Industry Revenue (Million) Forecast, by Application 2019 & 2032
- Table 100: Japan Lice Treatment Industry Volume (K Unit) Forecast, by Application 2019 & 2032
- Table 101: India Lice Treatment Industry Revenue (Million) Forecast, by Application 2019 & 2032
- Table 102: India Lice Treatment Industry Volume (K Unit) Forecast, by Application 2019 & 2032
- Table 103: Australia Lice Treatment Industry Revenue (Million) Forecast, by Application 2019 & 2032
- Table 104: Australia Lice Treatment Industry Volume (K Unit) Forecast, by Application 2019 & 2032
- Table 105: South Korea Lice Treatment Industry Revenue (Million) Forecast, by Application 2019 & 2032
- Table 106: South Korea Lice Treatment Industry Volume (K Unit) Forecast, by Application 2019 & 2032
- Table 107: Rest of Asia Pacific Lice Treatment Industry Revenue (Million) Forecast, by Application 2019 & 2032
- Table 108: Rest of Asia Pacific Lice Treatment Industry Volume (K Unit) Forecast, by Application 2019 & 2032
- Table 109: Global Lice Treatment Industry Revenue Million Forecast, by Product Type 2019 & 2032
- Table 110: Global Lice Treatment Industry Volume K Unit Forecast, by Product Type 2019 & 2032
- Table 111: Global Lice Treatment Industry Revenue Million Forecast, by Distribution Channel 2019 & 2032
- Table 112: Global Lice Treatment Industry Volume K Unit Forecast, by Distribution Channel 2019 & 2032
- Table 113: Global Lice Treatment Industry Revenue Million Forecast, by Country 2019 & 2032
- Table 114: Global Lice Treatment Industry Volume K Unit Forecast, by Country 2019 & 2032
- Table 115: GCC Lice Treatment Industry Revenue (Million) Forecast, by Application 2019 & 2032
- Table 116: GCC Lice Treatment Industry Volume (K Unit) Forecast, by Application 2019 & 2032
- Table 117: South Africa Lice Treatment Industry Revenue (Million) Forecast, by Application 2019 & 2032
- Table 118: South Africa Lice Treatment Industry Volume (K Unit) Forecast, by Application 2019 & 2032
- Table 119: Rest of Middle East and Africa Lice Treatment Industry Revenue (Million) Forecast, by Application 2019 & 2032
- Table 120: Rest of Middle East and Africa Lice Treatment Industry Volume (K Unit) Forecast, by Application 2019 & 2032
- Table 121: Global Lice Treatment Industry Revenue Million Forecast, by Product Type 2019 & 2032
- Table 122: Global Lice Treatment Industry Volume K Unit Forecast, by Product Type 2019 & 2032
- Table 123: Global Lice Treatment Industry Revenue Million Forecast, by Distribution Channel 2019 & 2032
- Table 124: Global Lice Treatment Industry Volume K Unit Forecast, by Distribution Channel 2019 & 2032
- Table 125: Global Lice Treatment Industry Revenue Million Forecast, by Country 2019 & 2032
- Table 126: Global Lice Treatment Industry Volume K Unit Forecast, by Country 2019 & 2032
- Table 127: Brazil Lice Treatment Industry Revenue (Million) Forecast, by Application 2019 & 2032
- Table 128: Brazil Lice Treatment Industry Volume (K Unit) Forecast, by Application 2019 & 2032
- Table 129: Argentina Lice Treatment Industry Revenue (Million) Forecast, by Application 2019 & 2032
- Table 130: Argentina Lice Treatment Industry Volume (K Unit) Forecast, by Application 2019 & 2032
- Table 131: Rest of South America Lice Treatment Industry Revenue (Million) Forecast, by Application 2019 & 2032
- Table 132: Rest of South America Lice Treatment Industry Volume (K Unit) Forecast, by Application 2019 & 2032
Frequently Asked Questions
1. What is the projected Compound Annual Growth Rate (CAGR) of the Lice Treatment Industry?
The projected CAGR is approximately 6.66%.
2. Which companies are prominent players in the Lice Treatment Industry?
Key companies in the market include Fleming Medical Ltd, Parapro Pharmaceuticals, Johnson and Johnson Services Inc, Oystershell Consumer Health (Bayer), Arbor Pharmaceuticals Inc (Azurity Pharmaceuticals), Alliance Pharmaceuticals Ltd, Perrigo Company plc (Omega Pharma), GlaxoSmithKline, Prestige Consumer Healthcare Inc.
3. What are the main segments of the Lice Treatment Industry?
The market segments include Product Type, Distribution Channel.
4. Can you provide details about the market size?
The market size is estimated to be USD 1.10 Million as of 2022.
5. What are some drivers contributing to market growth?
Increasing Prevalence of Lice Infestation; Easy Availability of Lice Treatment Products.
6. What are the notable trends driving market growth?
Permethrin Segment is Expected to Hold a Major Share in the Market.
7. Are there any restraints impacting market growth?
Lack of Awareness and Less Healthcare Expenditure in Developing Countries.
8. Can you provide examples of recent developments in the market?
In October 2022, Alliance Pharmaceuticals in collaboration with South Florida Family Health and Research Centers posted a clinical trial on clinicaltrials.gov to check the safety and efficacy of Vamousse Spray 'n' Go, compared to a 1% Permethrin control shampoo, in the treatment of head lice.
9. What pricing options are available for accessing the report?
Pricing options include single-user, multi-user, and enterprise licenses priced at USD 4750, USD 5250, and USD 8750 respectively.
10. Is the market size provided in terms of value or volume?
The market size is provided in terms of value, measured in Million and volume, measured in K Unit.
11. Are there any specific market keywords associated with the report?
Yes, the market keyword associated with the report is "Lice Treatment Industry," which aids in identifying and referencing the specific market segment covered.
12. How do I determine which pricing option suits my needs best?
The pricing options vary based on user requirements and access needs. Individual users may opt for single-user licenses, while businesses requiring broader access may choose multi-user or enterprise licenses for cost-effective access to the report.
13. Are there any additional resources or data provided in the Lice Treatment Industry report?
While the report offers comprehensive insights, it's advisable to review the specific contents or supplementary materials provided to ascertain if additional resources or data are available.
14. How can I stay updated on further developments or reports in the Lice Treatment Industry?
To stay informed about further developments, trends, and reports in the Lice Treatment Industry, consider subscribing to industry newsletters, following relevant companies and organizations, or regularly checking reputable industry news sources and publications.
Methodology
Step 1 - Identification of Relevant Samples Size from Population Database


Step 2 - Approaches for Defining Global Market Size (Value, Volume* & Price*)

Note*: In applicable scenarios
Step 3 - Data Sources
Primary Research
- Web Analytics
- Survey Reports
- Research Institute
- Latest Research Reports
- Opinion Leaders
Secondary Research
- Annual Reports
- White Paper
- Latest Press Release
- Industry Association
- Paid Database
- Investor Presentations

Step 4 - Data Triangulation
Involves using different sources of information in order to increase the validity of a study
These sources are likely to be stakeholders in a program - participants, other researchers, program staff, other community members, and so on.
Then we put all data in single framework & apply various statistical tools to find out the dynamic on the market.
During the analysis stage, feedback from the stakeholder groups would be compared to determine areas of agreement as well as areas of divergence


