
Key Insights
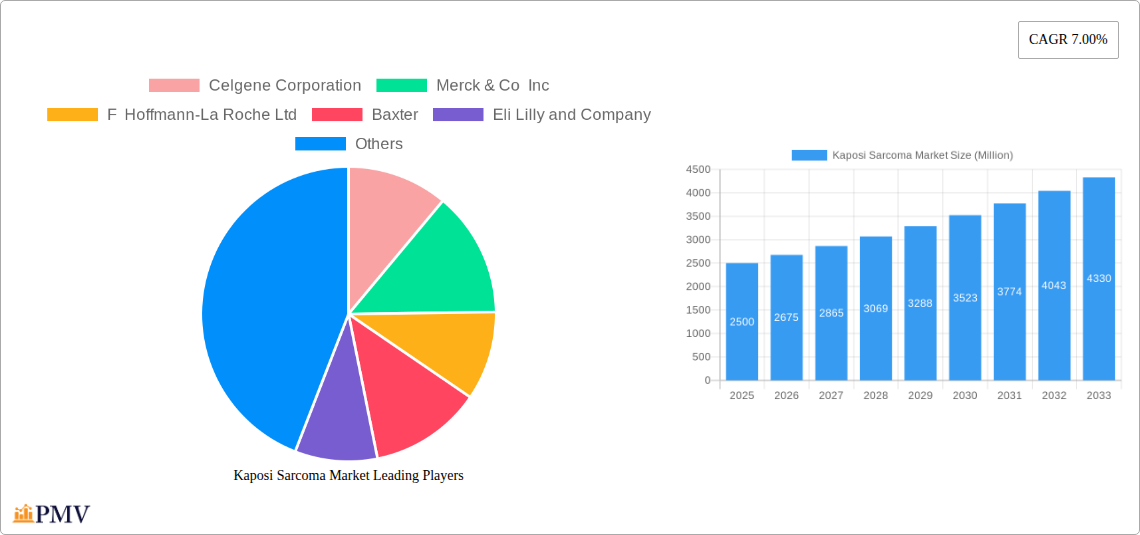
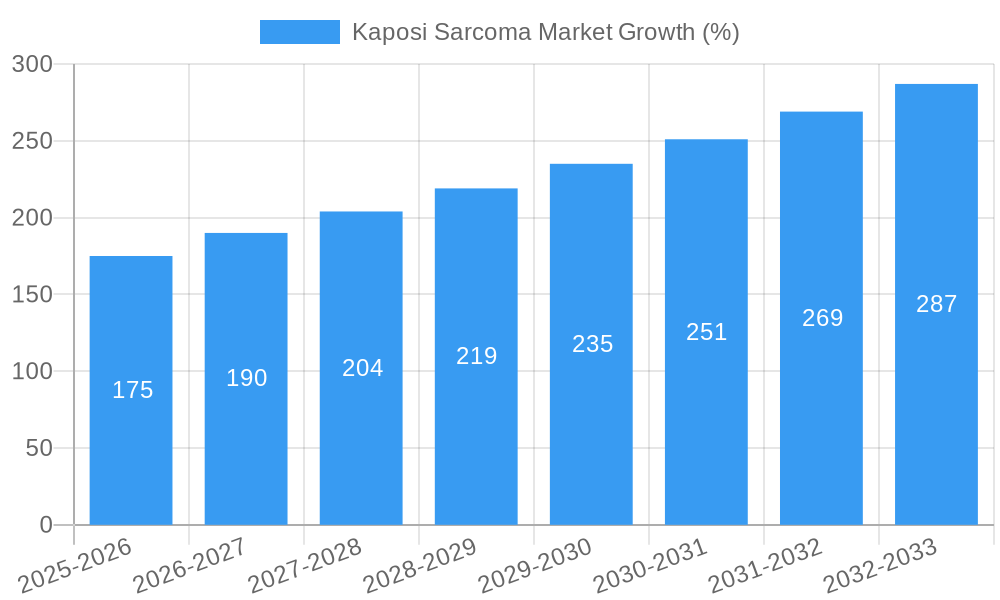
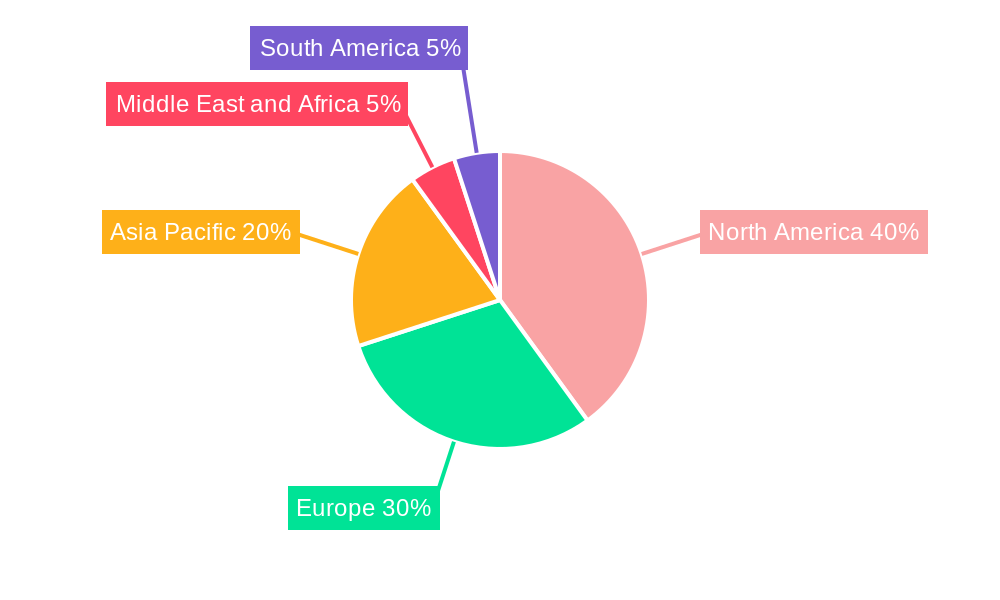
The Kaposi sarcoma (KS) market, while relatively niche, exhibits significant growth potential driven by rising prevalence, particularly in regions with high HIV/AIDS rates and immunocompromised populations. The market's 7% CAGR between 2019 and 2033 indicates a steady expansion, projected to reach a substantial market size by 2033. Key drivers include the increasing incidence of AIDS-associated KS, advancements in diagnostic techniques leading to earlier detection, and the development of novel targeted therapies. Market segmentation by type (epidemic, classic, endemic, iatrogenic) highlights the diverse nature of KS and the need for tailored treatment approaches. The product segment is primarily comprised of diagnostics and various treatment modalities, with a likely strong emphasis on anti-angiogenic and chemotherapeutic agents given current treatment standards. Geographic variations in KS prevalence significantly influence regional market sizes; North America and Europe are expected to hold substantial shares due to established healthcare infrastructure and higher diagnostic rates, while the Asia-Pacific region is poised for substantial growth driven by increasing awareness and improving access to healthcare. Market restraints include the relatively high cost of effective treatments, the complexity of disease management, and variations in healthcare access across different regions. The competitive landscape, involving major pharmaceutical players such as Celgene, Merck, Roche, and others, reflects the market's strategic importance and ongoing research efforts to develop more effective and accessible treatments. The market is also influenced by government initiatives and funding allocated towards infectious disease research and combating HIV/AIDS.
The market is likely to witness further consolidation as pharmaceutical companies invest in research and development, pursue strategic acquisitions, and leverage their existing portfolios to strengthen their position in the KS treatment space. Innovation in targeted therapies, particularly those addressing drug resistance, represents a crucial avenue for market expansion. Furthermore, the development of more accessible and affordable diagnostic tools could significantly impact the market's growth, particularly in underserved regions. The long-term outlook remains positive, predicated on the continued development of effective therapies, growing awareness of KS, and increased investment in healthcare infrastructure globally. Market growth may face challenges related to funding fluctuations for research and development and the emergence of novel treatment strategies, but the inherent market need will likely drive continued evolution.
Kaposi Sarcoma Market: A Comprehensive Analysis (2019-2033)
This in-depth report provides a comprehensive analysis of the Kaposi Sarcoma market, offering invaluable insights for stakeholders across the pharmaceutical, diagnostic, and healthcare sectors. Covering the period 2019-2033, with a focus on 2025 as the base and estimated year, this report illuminates market structure, competitive dynamics, growth drivers, and future opportunities. The report leverages extensive market research to forecast market size and growth trajectory, offering strategic recommendations for maximizing returns in this evolving landscape. The study period is 2019–2033, with the base year being 2025, the estimated year being 2025, and the forecast period spanning 2025–2033. The historical period covered is 2019–2024.
Kaposi Sarcoma Market Structure & Competitive Dynamics
The Kaposi Sarcoma market exhibits a moderately concentrated structure, with a handful of multinational pharmaceutical companies holding significant market share. The market is characterized by intense competition driven by ongoing research and development (R&D) efforts, coupled with strategic mergers and acquisitions (M&A) activities. Innovation ecosystems are crucial, fostering the development of novel diagnostics and treatments. Regulatory frameworks, particularly those governing drug approvals and clinical trials, significantly influence market dynamics. The presence of substitute treatments, along with evolving end-user preferences (e.g., personalized medicine), add further layers of complexity.
- Market Concentration: The top five players command approximately xx% of the market share in 2025, projected to reach xx% by 2033.
- M&A Activity: Significant M&A activity has been observed in recent years, with deal values exceeding $xx Million in the past five years. This consolidation trend is expected to continue, driven by a desire to expand portfolios and gain a competitive edge.
- Innovation Ecosystems: The market is witnessing a surge in innovative diagnostic tools and targeted therapies, fueled by advancements in biotechnology and genomics. This trend is poised to accelerate market growth.
- Regulatory Frameworks: Stringent regulatory requirements surrounding drug approvals present both challenges and opportunities. Companies are investing heavily in navigating these frameworks to ensure market access for their products.
Kaposi Sarcoma Market Industry Trends & Insights
The global Kaposi Sarcoma market is projected to witness robust growth, with a Compound Annual Growth Rate (CAGR) of xx% during the forecast period (2025-2033). This growth is fueled by several key factors, including increasing prevalence of Kaposi Sarcoma, particularly in regions with high HIV/AIDS rates; rising healthcare expenditure; and advancements in diagnostics and therapeutics. Technological disruptions, such as the development of next-generation sequencing and AI-driven diagnostics, are transforming the market. Consumer preferences are shifting toward more targeted and personalized therapies. The market is also witnessing a growing emphasis on early diagnosis and improved patient outcomes.
The increasing prevalence of Kaposi Sarcoma, especially in regions with high HIV/AIDS prevalence and immunosuppressed populations, is a major growth driver. Technological advancements in early detection and targeted therapies are further propelling market expansion. Market penetration of advanced diagnostic tools, coupled with improved access to effective treatments, is improving patient outcomes, creating a positive feedback loop that sustains market growth.
Dominant Markets & Segments in Kaposi Sarcoma Market
- By Type: Epidemic (AIDS-associated) Kaposi Sarcoma represents the largest segment, driven by the high prevalence of HIV/AIDS in several regions. The Endemic (African) Kaposi Sarcoma segment also shows significant market potential due to high incidence rates in sub-Saharan Africa.
- By Product: The diagnostics segment holds a significant market share, primarily driven by the growing demand for early and accurate diagnosis. The treatment segment is also expanding, with the introduction of novel therapies leading to higher treatment success rates.
Dominance Analysis: Sub-Saharan Africa is currently the leading region, owing to the high incidence of endemic Kaposi Sarcoma. However, growth is anticipated in other regions due to improved healthcare infrastructure and increased awareness.
- Key Drivers (Africa): High prevalence of endemic Kaposi Sarcoma, growing awareness, increased healthcare expenditure, and ongoing government initiatives to combat infectious diseases.
- Key Drivers (North America & Europe): Increased prevalence of classic and iatrogenic Kaposi Sarcoma, robust healthcare infrastructure, advanced diagnostic technologies, and ongoing research and development.
Kaposi Sarcoma Market Product Innovations
Recent years have witnessed significant advancements in Kaposi Sarcoma diagnostics and therapeutics. The development of portable diagnostic devices facilitates early detection, especially in resource-limited settings. Advances in targeted therapies aim to improve efficacy and minimize side effects. These innovations, driven by technological trends in genomics, proteomics, and AI, are enhancing market competitiveness and improving patient outcomes. The market is increasingly adopting personalized medicine approaches to tailor treatment strategies based on individual patient characteristics.
Report Segmentation & Scope
The report provides a detailed segmentation of the Kaposi Sarcoma market based on:
By Type: Epidemic (AIDS-associated) Kaposi Sarcoma, Classic (Mediterranean) Kaposi Sarcoma, Endemic (African) Kaposi Sarcoma, Iatrogenic (transplant-related) Kaposi Sarcoma. Each segment's growth projections, market sizes, and competitive dynamics are analyzed separately.
By Product: Diagnostics and Treatment. Market size, growth projections, and competitive landscape are analyzed within each segment. The diagnostics segment is expected to witness significant growth due to advancements in diagnostic technologies, while the treatment segment's growth is fueled by the emergence of new therapies.
Key Drivers of Kaposi Sarcoma Market Growth
The Kaposi Sarcoma market's growth is driven by several factors: increased prevalence of the disease, particularly in regions with high HIV/AIDS rates; technological advancements in diagnostics and therapies; rising healthcare spending; and government initiatives aimed at improving healthcare infrastructure and access. Increased awareness campaigns and improved understanding of the disease also contribute to market expansion.
Challenges in the Kaposi Sarcoma Market Sector
Despite significant growth potential, the Kaposi Sarcoma market faces challenges: limited access to effective treatment in resource-constrained settings, high cost of therapies, and the need for more effective treatment options for drug-resistant strains. Regulatory hurdles and complexities surrounding drug approvals also pose significant barriers. Furthermore, the development of new diagnostic tools and therapies is crucial for expanding market access and reducing the overall burden of disease. These challenges present opportunities for innovation and market diversification.
Leading Players in the Kaposi Sarcoma Market Market
- Celgene Corporation
- Merck & Co Inc
- F Hoffmann-La Roche Ltd
- Baxter
- Eli Lilly and Company
- Bristol-Myers Squibb
- Getwell Pharmaceuticals
- Navidea Biopharmaceuticals Inc
- Cipla Ltd
- Teva Pharmaceutical
- Pfizer Inc
Key Developments in Kaposi Sarcoma Market Sector
- August 2022: Deployment of a portable diagnostic device in Uganda for Kaposi Sarcoma detection, signifying advancements in early diagnosis and accessibility.
- May 2022: Identification of a protein crucial in KSHV dormancy, opening avenues for novel therapeutic targets.
Strategic Kaposi Sarcoma Market Outlook
The Kaposi Sarcoma market presents substantial growth opportunities, particularly in developing nations. Strategic investments in R&D, particularly focusing on novel diagnostics and therapies, coupled with effective market access strategies, will prove crucial for success. Partnerships with governments and NGOs can further accelerate market penetration and improve healthcare access in underserved regions. The future holds significant promise, with continued innovation leading to improved patient outcomes and market expansion.
Kaposi Sarcoma Market Segmentation
-
1. Type
- 1.1. Epidemic (AIDS-associated) Kaposi sarcoma
- 1.2. Classic (Mediterranean) Kaposi sarcoma
- 1.3. Endemic (African) Kaposi sarcoma
- 1.4. Latrogenic (transplant-related) Kaposi sarcoma
-
2. Product
-
2.1. By Diagnostics
- 2.1.1. Biopsy
- 2.1.2. Bronchoscopy
- 2.1.3. Gastrointestinal endoscopy
- 2.1.4. Other Products
-
2.2. By Treatment
- 2.2.1. Highly Active Antiretroviral Therapy (HAART)
- 2.2.2. Radiation Therapy
- 2.2.3. Chemotherapy
- 2.2.4. Immunotherapy
- 2.2.5. Other Treatments
-
2.1. By Diagnostics
Kaposi Sarcoma Market Segmentation By Geography
-
1. North America
- 1.1. United States
- 1.2. Canada
- 1.3. Mexico
-
2. Europe
- 2.1. Germany
- 2.2. United Kingdom
- 2.3. France
- 2.4. Italy
- 2.5. Spain
- 2.6. Rest of Europe
-
3. Asia Pacific
- 3.1. China
- 3.2. Japan
- 3.3. India
- 3.4. Australia
- 3.5. South Korea
- 3.6. Rest of Asia Pacific
-
4. Middle East and Africa
- 4.1. GCC
- 4.2. South Africa
- 4.3. Rest of Middle East and Africa
-
5. South America
- 5.1. Brazil
- 5.2. Argentina
- 5.3. Rest of South America
Kaposi Sarcoma Market REPORT HIGHLIGHTS
| Aspects | Details |
|---|---|
| Study Period | 2019-2033 |
| Base Year | 2024 |
| Estimated Year | 2025 |
| Forecast Period | 2025-2033 |
| Historical Period | 2019-2024 |
| Growth Rate | CAGR of 7.00% from 2019-2033 |
| Segmentation |
|
Table of Contents
- 1. Introduction
- 1.1. Research Scope
- 1.2. Market Segmentation
- 1.3. Research Methodology
- 1.4. Definitions and Assumptions
- 2. Executive Summary
- 2.1. Introduction
- 3. Market Dynamics
- 3.1. Introduction
- 3.2. Market Drivers
- 3.2.1. Growing Incidence of HIV-Associated Kaposi Sarcoma; Rising Number of Patients Undergoing Organ Transplantation Procedures
- 3.3. Market Restrains
- 3.3.1. High Cost of the Treatment and Diagnosis of Kaposi Sarcoma; Shortage in Supply of Drugs Due to Wide Demand-Supply Gap
- 3.4. Market Trends
- 3.4.1. Chemotherapy Segment Holds a Significant Market Share
- 4. Market Factor Analysis
- 4.1. Porters Five Forces
- 4.2. Supply/Value Chain
- 4.3. PESTEL analysis
- 4.4. Market Entropy
- 4.5. Patent/Trademark Analysis
- 5. Global Kaposi Sarcoma Market Analysis, Insights and Forecast, 2019-2031
- 5.1. Market Analysis, Insights and Forecast - by Type
- 5.1.1. Epidemic (AIDS-associated) Kaposi sarcoma
- 5.1.2. Classic (Mediterranean) Kaposi sarcoma
- 5.1.3. Endemic (African) Kaposi sarcoma
- 5.1.4. Latrogenic (transplant-related) Kaposi sarcoma
- 5.2. Market Analysis, Insights and Forecast - by Product
- 5.2.1. By Diagnostics
- 5.2.1.1. Biopsy
- 5.2.1.2. Bronchoscopy
- 5.2.1.3. Gastrointestinal endoscopy
- 5.2.1.4. Other Products
- 5.2.2. By Treatment
- 5.2.2.1. Highly Active Antiretroviral Therapy (HAART)
- 5.2.2.2. Radiation Therapy
- 5.2.2.3. Chemotherapy
- 5.2.2.4. Immunotherapy
- 5.2.2.5. Other Treatments
- 5.2.1. By Diagnostics
- 5.3. Market Analysis, Insights and Forecast - by Region
- 5.3.1. North America
- 5.3.2. Europe
- 5.3.3. Asia Pacific
- 5.3.4. Middle East and Africa
- 5.3.5. South America
- 5.1. Market Analysis, Insights and Forecast - by Type
- 6. North America Kaposi Sarcoma Market Analysis, Insights and Forecast, 2019-2031
- 6.1. Market Analysis, Insights and Forecast - by Type
- 6.1.1. Epidemic (AIDS-associated) Kaposi sarcoma
- 6.1.2. Classic (Mediterranean) Kaposi sarcoma
- 6.1.3. Endemic (African) Kaposi sarcoma
- 6.1.4. Latrogenic (transplant-related) Kaposi sarcoma
- 6.2. Market Analysis, Insights and Forecast - by Product
- 6.2.1. By Diagnostics
- 6.2.1.1. Biopsy
- 6.2.1.2. Bronchoscopy
- 6.2.1.3. Gastrointestinal endoscopy
- 6.2.1.4. Other Products
- 6.2.2. By Treatment
- 6.2.2.1. Highly Active Antiretroviral Therapy (HAART)
- 6.2.2.2. Radiation Therapy
- 6.2.2.3. Chemotherapy
- 6.2.2.4. Immunotherapy
- 6.2.2.5. Other Treatments
- 6.2.1. By Diagnostics
- 6.1. Market Analysis, Insights and Forecast - by Type
- 7. Europe Kaposi Sarcoma Market Analysis, Insights and Forecast, 2019-2031
- 7.1. Market Analysis, Insights and Forecast - by Type
- 7.1.1. Epidemic (AIDS-associated) Kaposi sarcoma
- 7.1.2. Classic (Mediterranean) Kaposi sarcoma
- 7.1.3. Endemic (African) Kaposi sarcoma
- 7.1.4. Latrogenic (transplant-related) Kaposi sarcoma
- 7.2. Market Analysis, Insights and Forecast - by Product
- 7.2.1. By Diagnostics
- 7.2.1.1. Biopsy
- 7.2.1.2. Bronchoscopy
- 7.2.1.3. Gastrointestinal endoscopy
- 7.2.1.4. Other Products
- 7.2.2. By Treatment
- 7.2.2.1. Highly Active Antiretroviral Therapy (HAART)
- 7.2.2.2. Radiation Therapy
- 7.2.2.3. Chemotherapy
- 7.2.2.4. Immunotherapy
- 7.2.2.5. Other Treatments
- 7.2.1. By Diagnostics
- 7.1. Market Analysis, Insights and Forecast - by Type
- 8. Asia Pacific Kaposi Sarcoma Market Analysis, Insights and Forecast, 2019-2031
- 8.1. Market Analysis, Insights and Forecast - by Type
- 8.1.1. Epidemic (AIDS-associated) Kaposi sarcoma
- 8.1.2. Classic (Mediterranean) Kaposi sarcoma
- 8.1.3. Endemic (African) Kaposi sarcoma
- 8.1.4. Latrogenic (transplant-related) Kaposi sarcoma
- 8.2. Market Analysis, Insights and Forecast - by Product
- 8.2.1. By Diagnostics
- 8.2.1.1. Biopsy
- 8.2.1.2. Bronchoscopy
- 8.2.1.3. Gastrointestinal endoscopy
- 8.2.1.4. Other Products
- 8.2.2. By Treatment
- 8.2.2.1. Highly Active Antiretroviral Therapy (HAART)
- 8.2.2.2. Radiation Therapy
- 8.2.2.3. Chemotherapy
- 8.2.2.4. Immunotherapy
- 8.2.2.5. Other Treatments
- 8.2.1. By Diagnostics
- 8.1. Market Analysis, Insights and Forecast - by Type
- 9. Middle East and Africa Kaposi Sarcoma Market Analysis, Insights and Forecast, 2019-2031
- 9.1. Market Analysis, Insights and Forecast - by Type
- 9.1.1. Epidemic (AIDS-associated) Kaposi sarcoma
- 9.1.2. Classic (Mediterranean) Kaposi sarcoma
- 9.1.3. Endemic (African) Kaposi sarcoma
- 9.1.4. Latrogenic (transplant-related) Kaposi sarcoma
- 9.2. Market Analysis, Insights and Forecast - by Product
- 9.2.1. By Diagnostics
- 9.2.1.1. Biopsy
- 9.2.1.2. Bronchoscopy
- 9.2.1.3. Gastrointestinal endoscopy
- 9.2.1.4. Other Products
- 9.2.2. By Treatment
- 9.2.2.1. Highly Active Antiretroviral Therapy (HAART)
- 9.2.2.2. Radiation Therapy
- 9.2.2.3. Chemotherapy
- 9.2.2.4. Immunotherapy
- 9.2.2.5. Other Treatments
- 9.2.1. By Diagnostics
- 9.1. Market Analysis, Insights and Forecast - by Type
- 10. South America Kaposi Sarcoma Market Analysis, Insights and Forecast, 2019-2031
- 10.1. Market Analysis, Insights and Forecast - by Type
- 10.1.1. Epidemic (AIDS-associated) Kaposi sarcoma
- 10.1.2. Classic (Mediterranean) Kaposi sarcoma
- 10.1.3. Endemic (African) Kaposi sarcoma
- 10.1.4. Latrogenic (transplant-related) Kaposi sarcoma
- 10.2. Market Analysis, Insights and Forecast - by Product
- 10.2.1. By Diagnostics
- 10.2.1.1. Biopsy
- 10.2.1.2. Bronchoscopy
- 10.2.1.3. Gastrointestinal endoscopy
- 10.2.1.4. Other Products
- 10.2.2. By Treatment
- 10.2.2.1. Highly Active Antiretroviral Therapy (HAART)
- 10.2.2.2. Radiation Therapy
- 10.2.2.3. Chemotherapy
- 10.2.2.4. Immunotherapy
- 10.2.2.5. Other Treatments
- 10.2.1. By Diagnostics
- 10.1. Market Analysis, Insights and Forecast - by Type
- 11. North America Kaposi Sarcoma Market Analysis, Insights and Forecast, 2019-2031
- 11.1. Market Analysis, Insights and Forecast - By Country/Sub-region
- 11.1.1 United States
- 11.1.2 Canada
- 11.1.3 Mexico
- 12. Europe Kaposi Sarcoma Market Analysis, Insights and Forecast, 2019-2031
- 12.1. Market Analysis, Insights and Forecast - By Country/Sub-region
- 12.1.1 Germany
- 12.1.2 United Kingdom
- 12.1.3 France
- 12.1.4 Italy
- 12.1.5 Spain
- 12.1.6 Rest of Europe
- 13. Asia Pacific Kaposi Sarcoma Market Analysis, Insights and Forecast, 2019-2031
- 13.1. Market Analysis, Insights and Forecast - By Country/Sub-region
- 13.1.1 China
- 13.1.2 Japan
- 13.1.3 India
- 13.1.4 Australia
- 13.1.5 South Korea
- 13.1.6 Rest of Asia Pacific
- 14. Middle East and Africa Kaposi Sarcoma Market Analysis, Insights and Forecast, 2019-2031
- 14.1. Market Analysis, Insights and Forecast - By Country/Sub-region
- 14.1.1 GCC
- 14.1.2 South Africa
- 14.1.3 Rest of Middle East and Africa
- 15. South America Kaposi Sarcoma Market Analysis, Insights and Forecast, 2019-2031
- 15.1. Market Analysis, Insights and Forecast - By Country/Sub-region
- 15.1.1 Brazil
- 15.1.2 Argentina
- 15.1.3 Rest of South America
- 16. Competitive Analysis
- 16.1. Global Market Share Analysis 2024
- 16.2. Company Profiles
- 16.2.1 Celgene Corporation
- 16.2.1.1. Overview
- 16.2.1.2. Products
- 16.2.1.3. SWOT Analysis
- 16.2.1.4. Recent Developments
- 16.2.1.5. Financials (Based on Availability)
- 16.2.2 Merck & Co Inc
- 16.2.2.1. Overview
- 16.2.2.2. Products
- 16.2.2.3. SWOT Analysis
- 16.2.2.4. Recent Developments
- 16.2.2.5. Financials (Based on Availability)
- 16.2.3 F Hoffmann-La Roche Ltd
- 16.2.3.1. Overview
- 16.2.3.2. Products
- 16.2.3.3. SWOT Analysis
- 16.2.3.4. Recent Developments
- 16.2.3.5. Financials (Based on Availability)
- 16.2.4 Baxter
- 16.2.4.1. Overview
- 16.2.4.2. Products
- 16.2.4.3. SWOT Analysis
- 16.2.4.4. Recent Developments
- 16.2.4.5. Financials (Based on Availability)
- 16.2.5 Eli Lilly and Company
- 16.2.5.1. Overview
- 16.2.5.2. Products
- 16.2.5.3. SWOT Analysis
- 16.2.5.4. Recent Developments
- 16.2.5.5. Financials (Based on Availability)
- 16.2.6 Bristol-Myers Squibb
- 16.2.6.1. Overview
- 16.2.6.2. Products
- 16.2.6.3. SWOT Analysis
- 16.2.6.4. Recent Developments
- 16.2.6.5. Financials (Based on Availability)
- 16.2.7 Getwell Pharmaceuticals
- 16.2.7.1. Overview
- 16.2.7.2. Products
- 16.2.7.3. SWOT Analysis
- 16.2.7.4. Recent Developments
- 16.2.7.5. Financials (Based on Availability)
- 16.2.8 Navidea Biopharmaceuticals Inc
- 16.2.8.1. Overview
- 16.2.8.2. Products
- 16.2.8.3. SWOT Analysis
- 16.2.8.4. Recent Developments
- 16.2.8.5. Financials (Based on Availability)
- 16.2.9 Cipla Ltd
- 16.2.9.1. Overview
- 16.2.9.2. Products
- 16.2.9.3. SWOT Analysis
- 16.2.9.4. Recent Developments
- 16.2.9.5. Financials (Based on Availability)
- 16.2.10 Teva Pharmaceutical
- 16.2.10.1. Overview
- 16.2.10.2. Products
- 16.2.10.3. SWOT Analysis
- 16.2.10.4. Recent Developments
- 16.2.10.5. Financials (Based on Availability)
- 16.2.11 Pfizer Inc
- 16.2.11.1. Overview
- 16.2.11.2. Products
- 16.2.11.3. SWOT Analysis
- 16.2.11.4. Recent Developments
- 16.2.11.5. Financials (Based on Availability)
- 16.2.1 Celgene Corporation
List of Figures
- Figure 1: Global Kaposi Sarcoma Market Revenue Breakdown (Million, %) by Region 2024 & 2032
- Figure 2: Global Kaposi Sarcoma Market Volume Breakdown (K Unit, %) by Region 2024 & 2032
- Figure 3: North America Kaposi Sarcoma Market Revenue (Million), by Country 2024 & 2032
- Figure 4: North America Kaposi Sarcoma Market Volume (K Unit), by Country 2024 & 2032
- Figure 5: North America Kaposi Sarcoma Market Revenue Share (%), by Country 2024 & 2032
- Figure 6: North America Kaposi Sarcoma Market Volume Share (%), by Country 2024 & 2032
- Figure 7: Europe Kaposi Sarcoma Market Revenue (Million), by Country 2024 & 2032
- Figure 8: Europe Kaposi Sarcoma Market Volume (K Unit), by Country 2024 & 2032
- Figure 9: Europe Kaposi Sarcoma Market Revenue Share (%), by Country 2024 & 2032
- Figure 10: Europe Kaposi Sarcoma Market Volume Share (%), by Country 2024 & 2032
- Figure 11: Asia Pacific Kaposi Sarcoma Market Revenue (Million), by Country 2024 & 2032
- Figure 12: Asia Pacific Kaposi Sarcoma Market Volume (K Unit), by Country 2024 & 2032
- Figure 13: Asia Pacific Kaposi Sarcoma Market Revenue Share (%), by Country 2024 & 2032
- Figure 14: Asia Pacific Kaposi Sarcoma Market Volume Share (%), by Country 2024 & 2032
- Figure 15: Middle East and Africa Kaposi Sarcoma Market Revenue (Million), by Country 2024 & 2032
- Figure 16: Middle East and Africa Kaposi Sarcoma Market Volume (K Unit), by Country 2024 & 2032
- Figure 17: Middle East and Africa Kaposi Sarcoma Market Revenue Share (%), by Country 2024 & 2032
- Figure 18: Middle East and Africa Kaposi Sarcoma Market Volume Share (%), by Country 2024 & 2032
- Figure 19: South America Kaposi Sarcoma Market Revenue (Million), by Country 2024 & 2032
- Figure 20: South America Kaposi Sarcoma Market Volume (K Unit), by Country 2024 & 2032
- Figure 21: South America Kaposi Sarcoma Market Revenue Share (%), by Country 2024 & 2032
- Figure 22: South America Kaposi Sarcoma Market Volume Share (%), by Country 2024 & 2032
- Figure 23: North America Kaposi Sarcoma Market Revenue (Million), by Type 2024 & 2032
- Figure 24: North America Kaposi Sarcoma Market Volume (K Unit), by Type 2024 & 2032
- Figure 25: North America Kaposi Sarcoma Market Revenue Share (%), by Type 2024 & 2032
- Figure 26: North America Kaposi Sarcoma Market Volume Share (%), by Type 2024 & 2032
- Figure 27: North America Kaposi Sarcoma Market Revenue (Million), by Product 2024 & 2032
- Figure 28: North America Kaposi Sarcoma Market Volume (K Unit), by Product 2024 & 2032
- Figure 29: North America Kaposi Sarcoma Market Revenue Share (%), by Product 2024 & 2032
- Figure 30: North America Kaposi Sarcoma Market Volume Share (%), by Product 2024 & 2032
- Figure 31: North America Kaposi Sarcoma Market Revenue (Million), by Country 2024 & 2032
- Figure 32: North America Kaposi Sarcoma Market Volume (K Unit), by Country 2024 & 2032
- Figure 33: North America Kaposi Sarcoma Market Revenue Share (%), by Country 2024 & 2032
- Figure 34: North America Kaposi Sarcoma Market Volume Share (%), by Country 2024 & 2032
- Figure 35: Europe Kaposi Sarcoma Market Revenue (Million), by Type 2024 & 2032
- Figure 36: Europe Kaposi Sarcoma Market Volume (K Unit), by Type 2024 & 2032
- Figure 37: Europe Kaposi Sarcoma Market Revenue Share (%), by Type 2024 & 2032
- Figure 38: Europe Kaposi Sarcoma Market Volume Share (%), by Type 2024 & 2032
- Figure 39: Europe Kaposi Sarcoma Market Revenue (Million), by Product 2024 & 2032
- Figure 40: Europe Kaposi Sarcoma Market Volume (K Unit), by Product 2024 & 2032
- Figure 41: Europe Kaposi Sarcoma Market Revenue Share (%), by Product 2024 & 2032
- Figure 42: Europe Kaposi Sarcoma Market Volume Share (%), by Product 2024 & 2032
- Figure 43: Europe Kaposi Sarcoma Market Revenue (Million), by Country 2024 & 2032
- Figure 44: Europe Kaposi Sarcoma Market Volume (K Unit), by Country 2024 & 2032
- Figure 45: Europe Kaposi Sarcoma Market Revenue Share (%), by Country 2024 & 2032
- Figure 46: Europe Kaposi Sarcoma Market Volume Share (%), by Country 2024 & 2032
- Figure 47: Asia Pacific Kaposi Sarcoma Market Revenue (Million), by Type 2024 & 2032
- Figure 48: Asia Pacific Kaposi Sarcoma Market Volume (K Unit), by Type 2024 & 2032
- Figure 49: Asia Pacific Kaposi Sarcoma Market Revenue Share (%), by Type 2024 & 2032
- Figure 50: Asia Pacific Kaposi Sarcoma Market Volume Share (%), by Type 2024 & 2032
- Figure 51: Asia Pacific Kaposi Sarcoma Market Revenue (Million), by Product 2024 & 2032
- Figure 52: Asia Pacific Kaposi Sarcoma Market Volume (K Unit), by Product 2024 & 2032
- Figure 53: Asia Pacific Kaposi Sarcoma Market Revenue Share (%), by Product 2024 & 2032
- Figure 54: Asia Pacific Kaposi Sarcoma Market Volume Share (%), by Product 2024 & 2032
- Figure 55: Asia Pacific Kaposi Sarcoma Market Revenue (Million), by Country 2024 & 2032
- Figure 56: Asia Pacific Kaposi Sarcoma Market Volume (K Unit), by Country 2024 & 2032
- Figure 57: Asia Pacific Kaposi Sarcoma Market Revenue Share (%), by Country 2024 & 2032
- Figure 58: Asia Pacific Kaposi Sarcoma Market Volume Share (%), by Country 2024 & 2032
- Figure 59: Middle East and Africa Kaposi Sarcoma Market Revenue (Million), by Type 2024 & 2032
- Figure 60: Middle East and Africa Kaposi Sarcoma Market Volume (K Unit), by Type 2024 & 2032
- Figure 61: Middle East and Africa Kaposi Sarcoma Market Revenue Share (%), by Type 2024 & 2032
- Figure 62: Middle East and Africa Kaposi Sarcoma Market Volume Share (%), by Type 2024 & 2032
- Figure 63: Middle East and Africa Kaposi Sarcoma Market Revenue (Million), by Product 2024 & 2032
- Figure 64: Middle East and Africa Kaposi Sarcoma Market Volume (K Unit), by Product 2024 & 2032
- Figure 65: Middle East and Africa Kaposi Sarcoma Market Revenue Share (%), by Product 2024 & 2032
- Figure 66: Middle East and Africa Kaposi Sarcoma Market Volume Share (%), by Product 2024 & 2032
- Figure 67: Middle East and Africa Kaposi Sarcoma Market Revenue (Million), by Country 2024 & 2032
- Figure 68: Middle East and Africa Kaposi Sarcoma Market Volume (K Unit), by Country 2024 & 2032
- Figure 69: Middle East and Africa Kaposi Sarcoma Market Revenue Share (%), by Country 2024 & 2032
- Figure 70: Middle East and Africa Kaposi Sarcoma Market Volume Share (%), by Country 2024 & 2032
- Figure 71: South America Kaposi Sarcoma Market Revenue (Million), by Type 2024 & 2032
- Figure 72: South America Kaposi Sarcoma Market Volume (K Unit), by Type 2024 & 2032
- Figure 73: South America Kaposi Sarcoma Market Revenue Share (%), by Type 2024 & 2032
- Figure 74: South America Kaposi Sarcoma Market Volume Share (%), by Type 2024 & 2032
- Figure 75: South America Kaposi Sarcoma Market Revenue (Million), by Product 2024 & 2032
- Figure 76: South America Kaposi Sarcoma Market Volume (K Unit), by Product 2024 & 2032
- Figure 77: South America Kaposi Sarcoma Market Revenue Share (%), by Product 2024 & 2032
- Figure 78: South America Kaposi Sarcoma Market Volume Share (%), by Product 2024 & 2032
- Figure 79: South America Kaposi Sarcoma Market Revenue (Million), by Country 2024 & 2032
- Figure 80: South America Kaposi Sarcoma Market Volume (K Unit), by Country 2024 & 2032
- Figure 81: South America Kaposi Sarcoma Market Revenue Share (%), by Country 2024 & 2032
- Figure 82: South America Kaposi Sarcoma Market Volume Share (%), by Country 2024 & 2032
List of Tables
- Table 1: Global Kaposi Sarcoma Market Revenue Million Forecast, by Region 2019 & 2032
- Table 2: Global Kaposi Sarcoma Market Volume K Unit Forecast, by Region 2019 & 2032
- Table 3: Global Kaposi Sarcoma Market Revenue Million Forecast, by Type 2019 & 2032
- Table 4: Global Kaposi Sarcoma Market Volume K Unit Forecast, by Type 2019 & 2032
- Table 5: Global Kaposi Sarcoma Market Revenue Million Forecast, by Product 2019 & 2032
- Table 6: Global Kaposi Sarcoma Market Volume K Unit Forecast, by Product 2019 & 2032
- Table 7: Global Kaposi Sarcoma Market Revenue Million Forecast, by Region 2019 & 2032
- Table 8: Global Kaposi Sarcoma Market Volume K Unit Forecast, by Region 2019 & 2032
- Table 9: Global Kaposi Sarcoma Market Revenue Million Forecast, by Country 2019 & 2032
- Table 10: Global Kaposi Sarcoma Market Volume K Unit Forecast, by Country 2019 & 2032
- Table 11: United States Kaposi Sarcoma Market Revenue (Million) Forecast, by Application 2019 & 2032
- Table 12: United States Kaposi Sarcoma Market Volume (K Unit) Forecast, by Application 2019 & 2032
- Table 13: Canada Kaposi Sarcoma Market Revenue (Million) Forecast, by Application 2019 & 2032
- Table 14: Canada Kaposi Sarcoma Market Volume (K Unit) Forecast, by Application 2019 & 2032
- Table 15: Mexico Kaposi Sarcoma Market Revenue (Million) Forecast, by Application 2019 & 2032
- Table 16: Mexico Kaposi Sarcoma Market Volume (K Unit) Forecast, by Application 2019 & 2032
- Table 17: Global Kaposi Sarcoma Market Revenue Million Forecast, by Country 2019 & 2032
- Table 18: Global Kaposi Sarcoma Market Volume K Unit Forecast, by Country 2019 & 2032
- Table 19: Germany Kaposi Sarcoma Market Revenue (Million) Forecast, by Application 2019 & 2032
- Table 20: Germany Kaposi Sarcoma Market Volume (K Unit) Forecast, by Application 2019 & 2032
- Table 21: United Kingdom Kaposi Sarcoma Market Revenue (Million) Forecast, by Application 2019 & 2032
- Table 22: United Kingdom Kaposi Sarcoma Market Volume (K Unit) Forecast, by Application 2019 & 2032
- Table 23: France Kaposi Sarcoma Market Revenue (Million) Forecast, by Application 2019 & 2032
- Table 24: France Kaposi Sarcoma Market Volume (K Unit) Forecast, by Application 2019 & 2032
- Table 25: Italy Kaposi Sarcoma Market Revenue (Million) Forecast, by Application 2019 & 2032
- Table 26: Italy Kaposi Sarcoma Market Volume (K Unit) Forecast, by Application 2019 & 2032
- Table 27: Spain Kaposi Sarcoma Market Revenue (Million) Forecast, by Application 2019 & 2032
- Table 28: Spain Kaposi Sarcoma Market Volume (K Unit) Forecast, by Application 2019 & 2032
- Table 29: Rest of Europe Kaposi Sarcoma Market Revenue (Million) Forecast, by Application 2019 & 2032
- Table 30: Rest of Europe Kaposi Sarcoma Market Volume (K Unit) Forecast, by Application 2019 & 2032
- Table 31: Global Kaposi Sarcoma Market Revenue Million Forecast, by Country 2019 & 2032
- Table 32: Global Kaposi Sarcoma Market Volume K Unit Forecast, by Country 2019 & 2032
- Table 33: China Kaposi Sarcoma Market Revenue (Million) Forecast, by Application 2019 & 2032
- Table 34: China Kaposi Sarcoma Market Volume (K Unit) Forecast, by Application 2019 & 2032
- Table 35: Japan Kaposi Sarcoma Market Revenue (Million) Forecast, by Application 2019 & 2032
- Table 36: Japan Kaposi Sarcoma Market Volume (K Unit) Forecast, by Application 2019 & 2032
- Table 37: India Kaposi Sarcoma Market Revenue (Million) Forecast, by Application 2019 & 2032
- Table 38: India Kaposi Sarcoma Market Volume (K Unit) Forecast, by Application 2019 & 2032
- Table 39: Australia Kaposi Sarcoma Market Revenue (Million) Forecast, by Application 2019 & 2032
- Table 40: Australia Kaposi Sarcoma Market Volume (K Unit) Forecast, by Application 2019 & 2032
- Table 41: South Korea Kaposi Sarcoma Market Revenue (Million) Forecast, by Application 2019 & 2032
- Table 42: South Korea Kaposi Sarcoma Market Volume (K Unit) Forecast, by Application 2019 & 2032
- Table 43: Rest of Asia Pacific Kaposi Sarcoma Market Revenue (Million) Forecast, by Application 2019 & 2032
- Table 44: Rest of Asia Pacific Kaposi Sarcoma Market Volume (K Unit) Forecast, by Application 2019 & 2032
- Table 45: Global Kaposi Sarcoma Market Revenue Million Forecast, by Country 2019 & 2032
- Table 46: Global Kaposi Sarcoma Market Volume K Unit Forecast, by Country 2019 & 2032
- Table 47: GCC Kaposi Sarcoma Market Revenue (Million) Forecast, by Application 2019 & 2032
- Table 48: GCC Kaposi Sarcoma Market Volume (K Unit) Forecast, by Application 2019 & 2032
- Table 49: South Africa Kaposi Sarcoma Market Revenue (Million) Forecast, by Application 2019 & 2032
- Table 50: South Africa Kaposi Sarcoma Market Volume (K Unit) Forecast, by Application 2019 & 2032
- Table 51: Rest of Middle East and Africa Kaposi Sarcoma Market Revenue (Million) Forecast, by Application 2019 & 2032
- Table 52: Rest of Middle East and Africa Kaposi Sarcoma Market Volume (K Unit) Forecast, by Application 2019 & 2032
- Table 53: Global Kaposi Sarcoma Market Revenue Million Forecast, by Country 2019 & 2032
- Table 54: Global Kaposi Sarcoma Market Volume K Unit Forecast, by Country 2019 & 2032
- Table 55: Brazil Kaposi Sarcoma Market Revenue (Million) Forecast, by Application 2019 & 2032
- Table 56: Brazil Kaposi Sarcoma Market Volume (K Unit) Forecast, by Application 2019 & 2032
- Table 57: Argentina Kaposi Sarcoma Market Revenue (Million) Forecast, by Application 2019 & 2032
- Table 58: Argentina Kaposi Sarcoma Market Volume (K Unit) Forecast, by Application 2019 & 2032
- Table 59: Rest of South America Kaposi Sarcoma Market Revenue (Million) Forecast, by Application 2019 & 2032
- Table 60: Rest of South America Kaposi Sarcoma Market Volume (K Unit) Forecast, by Application 2019 & 2032
- Table 61: Global Kaposi Sarcoma Market Revenue Million Forecast, by Type 2019 & 2032
- Table 62: Global Kaposi Sarcoma Market Volume K Unit Forecast, by Type 2019 & 2032
- Table 63: Global Kaposi Sarcoma Market Revenue Million Forecast, by Product 2019 & 2032
- Table 64: Global Kaposi Sarcoma Market Volume K Unit Forecast, by Product 2019 & 2032
- Table 65: Global Kaposi Sarcoma Market Revenue Million Forecast, by Country 2019 & 2032
- Table 66: Global Kaposi Sarcoma Market Volume K Unit Forecast, by Country 2019 & 2032
- Table 67: United States Kaposi Sarcoma Market Revenue (Million) Forecast, by Application 2019 & 2032
- Table 68: United States Kaposi Sarcoma Market Volume (K Unit) Forecast, by Application 2019 & 2032
- Table 69: Canada Kaposi Sarcoma Market Revenue (Million) Forecast, by Application 2019 & 2032
- Table 70: Canada Kaposi Sarcoma Market Volume (K Unit) Forecast, by Application 2019 & 2032
- Table 71: Mexico Kaposi Sarcoma Market Revenue (Million) Forecast, by Application 2019 & 2032
- Table 72: Mexico Kaposi Sarcoma Market Volume (K Unit) Forecast, by Application 2019 & 2032
- Table 73: Global Kaposi Sarcoma Market Revenue Million Forecast, by Type 2019 & 2032
- Table 74: Global Kaposi Sarcoma Market Volume K Unit Forecast, by Type 2019 & 2032
- Table 75: Global Kaposi Sarcoma Market Revenue Million Forecast, by Product 2019 & 2032
- Table 76: Global Kaposi Sarcoma Market Volume K Unit Forecast, by Product 2019 & 2032
- Table 77: Global Kaposi Sarcoma Market Revenue Million Forecast, by Country 2019 & 2032
- Table 78: Global Kaposi Sarcoma Market Volume K Unit Forecast, by Country 2019 & 2032
- Table 79: Germany Kaposi Sarcoma Market Revenue (Million) Forecast, by Application 2019 & 2032
- Table 80: Germany Kaposi Sarcoma Market Volume (K Unit) Forecast, by Application 2019 & 2032
- Table 81: United Kingdom Kaposi Sarcoma Market Revenue (Million) Forecast, by Application 2019 & 2032
- Table 82: United Kingdom Kaposi Sarcoma Market Volume (K Unit) Forecast, by Application 2019 & 2032
- Table 83: France Kaposi Sarcoma Market Revenue (Million) Forecast, by Application 2019 & 2032
- Table 84: France Kaposi Sarcoma Market Volume (K Unit) Forecast, by Application 2019 & 2032
- Table 85: Italy Kaposi Sarcoma Market Revenue (Million) Forecast, by Application 2019 & 2032
- Table 86: Italy Kaposi Sarcoma Market Volume (K Unit) Forecast, by Application 2019 & 2032
- Table 87: Spain Kaposi Sarcoma Market Revenue (Million) Forecast, by Application 2019 & 2032
- Table 88: Spain Kaposi Sarcoma Market Volume (K Unit) Forecast, by Application 2019 & 2032
- Table 89: Rest of Europe Kaposi Sarcoma Market Revenue (Million) Forecast, by Application 2019 & 2032
- Table 90: Rest of Europe Kaposi Sarcoma Market Volume (K Unit) Forecast, by Application 2019 & 2032
- Table 91: Global Kaposi Sarcoma Market Revenue Million Forecast, by Type 2019 & 2032
- Table 92: Global Kaposi Sarcoma Market Volume K Unit Forecast, by Type 2019 & 2032
- Table 93: Global Kaposi Sarcoma Market Revenue Million Forecast, by Product 2019 & 2032
- Table 94: Global Kaposi Sarcoma Market Volume K Unit Forecast, by Product 2019 & 2032
- Table 95: Global Kaposi Sarcoma Market Revenue Million Forecast, by Country 2019 & 2032
- Table 96: Global Kaposi Sarcoma Market Volume K Unit Forecast, by Country 2019 & 2032
- Table 97: China Kaposi Sarcoma Market Revenue (Million) Forecast, by Application 2019 & 2032
- Table 98: China Kaposi Sarcoma Market Volume (K Unit) Forecast, by Application 2019 & 2032
- Table 99: Japan Kaposi Sarcoma Market Revenue (Million) Forecast, by Application 2019 & 2032
- Table 100: Japan Kaposi Sarcoma Market Volume (K Unit) Forecast, by Application 2019 & 2032
- Table 101: India Kaposi Sarcoma Market Revenue (Million) Forecast, by Application 2019 & 2032
- Table 102: India Kaposi Sarcoma Market Volume (K Unit) Forecast, by Application 2019 & 2032
- Table 103: Australia Kaposi Sarcoma Market Revenue (Million) Forecast, by Application 2019 & 2032
- Table 104: Australia Kaposi Sarcoma Market Volume (K Unit) Forecast, by Application 2019 & 2032
- Table 105: South Korea Kaposi Sarcoma Market Revenue (Million) Forecast, by Application 2019 & 2032
- Table 106: South Korea Kaposi Sarcoma Market Volume (K Unit) Forecast, by Application 2019 & 2032
- Table 107: Rest of Asia Pacific Kaposi Sarcoma Market Revenue (Million) Forecast, by Application 2019 & 2032
- Table 108: Rest of Asia Pacific Kaposi Sarcoma Market Volume (K Unit) Forecast, by Application 2019 & 2032
- Table 109: Global Kaposi Sarcoma Market Revenue Million Forecast, by Type 2019 & 2032
- Table 110: Global Kaposi Sarcoma Market Volume K Unit Forecast, by Type 2019 & 2032
- Table 111: Global Kaposi Sarcoma Market Revenue Million Forecast, by Product 2019 & 2032
- Table 112: Global Kaposi Sarcoma Market Volume K Unit Forecast, by Product 2019 & 2032
- Table 113: Global Kaposi Sarcoma Market Revenue Million Forecast, by Country 2019 & 2032
- Table 114: Global Kaposi Sarcoma Market Volume K Unit Forecast, by Country 2019 & 2032
- Table 115: GCC Kaposi Sarcoma Market Revenue (Million) Forecast, by Application 2019 & 2032
- Table 116: GCC Kaposi Sarcoma Market Volume (K Unit) Forecast, by Application 2019 & 2032
- Table 117: South Africa Kaposi Sarcoma Market Revenue (Million) Forecast, by Application 2019 & 2032
- Table 118: South Africa Kaposi Sarcoma Market Volume (K Unit) Forecast, by Application 2019 & 2032
- Table 119: Rest of Middle East and Africa Kaposi Sarcoma Market Revenue (Million) Forecast, by Application 2019 & 2032
- Table 120: Rest of Middle East and Africa Kaposi Sarcoma Market Volume (K Unit) Forecast, by Application 2019 & 2032
- Table 121: Global Kaposi Sarcoma Market Revenue Million Forecast, by Type 2019 & 2032
- Table 122: Global Kaposi Sarcoma Market Volume K Unit Forecast, by Type 2019 & 2032
- Table 123: Global Kaposi Sarcoma Market Revenue Million Forecast, by Product 2019 & 2032
- Table 124: Global Kaposi Sarcoma Market Volume K Unit Forecast, by Product 2019 & 2032
- Table 125: Global Kaposi Sarcoma Market Revenue Million Forecast, by Country 2019 & 2032
- Table 126: Global Kaposi Sarcoma Market Volume K Unit Forecast, by Country 2019 & 2032
- Table 127: Brazil Kaposi Sarcoma Market Revenue (Million) Forecast, by Application 2019 & 2032
- Table 128: Brazil Kaposi Sarcoma Market Volume (K Unit) Forecast, by Application 2019 & 2032
- Table 129: Argentina Kaposi Sarcoma Market Revenue (Million) Forecast, by Application 2019 & 2032
- Table 130: Argentina Kaposi Sarcoma Market Volume (K Unit) Forecast, by Application 2019 & 2032
- Table 131: Rest of South America Kaposi Sarcoma Market Revenue (Million) Forecast, by Application 2019 & 2032
- Table 132: Rest of South America Kaposi Sarcoma Market Volume (K Unit) Forecast, by Application 2019 & 2032
Frequently Asked Questions
1. What is the projected Compound Annual Growth Rate (CAGR) of the Kaposi Sarcoma Market?
The projected CAGR is approximately 7.00%.
2. Which companies are prominent players in the Kaposi Sarcoma Market?
Key companies in the market include Celgene Corporation, Merck & Co Inc, F Hoffmann-La Roche Ltd, Baxter, Eli Lilly and Company, Bristol-Myers Squibb, Getwell Pharmaceuticals, Navidea Biopharmaceuticals Inc, Cipla Ltd, Teva Pharmaceutical, Pfizer Inc.
3. What are the main segments of the Kaposi Sarcoma Market?
The market segments include Type, Product.
4. Can you provide details about the market size?
The market size is estimated to be USD XX Million as of 2022.
5. What are some drivers contributing to market growth?
Growing Incidence of HIV-Associated Kaposi Sarcoma; Rising Number of Patients Undergoing Organ Transplantation Procedures.
6. What are the notable trends driving market growth?
Chemotherapy Segment Holds a Significant Market Share.
7. Are there any restraints impacting market growth?
High Cost of the Treatment and Diagnosis of Kaposi Sarcoma; Shortage in Supply of Drugs Due to Wide Demand-Supply Gap.
8. Can you provide examples of recent developments in the market?
August 2022: A portable diagnostic device designed by researchers at Cornell Engineering and Weill Cornell Medicine has been deployed in clinical tests in Uganda to identify cases of Kaposi sarcoma. This common yet difficult-to-detect cancer often signals the presence of HIV infection.
9. What pricing options are available for accessing the report?
Pricing options include single-user, multi-user, and enterprise licenses priced at USD 4750, USD 5250, and USD 8750 respectively.
10. Is the market size provided in terms of value or volume?
The market size is provided in terms of value, measured in Million and volume, measured in K Unit.
11. Are there any specific market keywords associated with the report?
Yes, the market keyword associated with the report is "Kaposi Sarcoma Market," which aids in identifying and referencing the specific market segment covered.
12. How do I determine which pricing option suits my needs best?
The pricing options vary based on user requirements and access needs. Individual users may opt for single-user licenses, while businesses requiring broader access may choose multi-user or enterprise licenses for cost-effective access to the report.
13. Are there any additional resources or data provided in the Kaposi Sarcoma Market report?
While the report offers comprehensive insights, it's advisable to review the specific contents or supplementary materials provided to ascertain if additional resources or data are available.
14. How can I stay updated on further developments or reports in the Kaposi Sarcoma Market?
To stay informed about further developments, trends, and reports in the Kaposi Sarcoma Market, consider subscribing to industry newsletters, following relevant companies and organizations, or regularly checking reputable industry news sources and publications.
Methodology
Step 1 - Identification of Relevant Samples Size from Population Database


Step 2 - Approaches for Defining Global Market Size (Value, Volume* & Price*)

Note*: In applicable scenarios
Step 3 - Data Sources
Primary Research
- Web Analytics
- Survey Reports
- Research Institute
- Latest Research Reports
- Opinion Leaders
Secondary Research
- Annual Reports
- White Paper
- Latest Press Release
- Industry Association
- Paid Database
- Investor Presentations

Step 4 - Data Triangulation
Involves using different sources of information in order to increase the validity of a study
These sources are likely to be stakeholders in a program - participants, other researchers, program staff, other community members, and so on.
Then we put all data in single framework & apply various statistical tools to find out the dynamic on the market.
During the analysis stage, feedback from the stakeholder groups would be compared to determine areas of agreement as well as areas of divergence


