


Key Insights
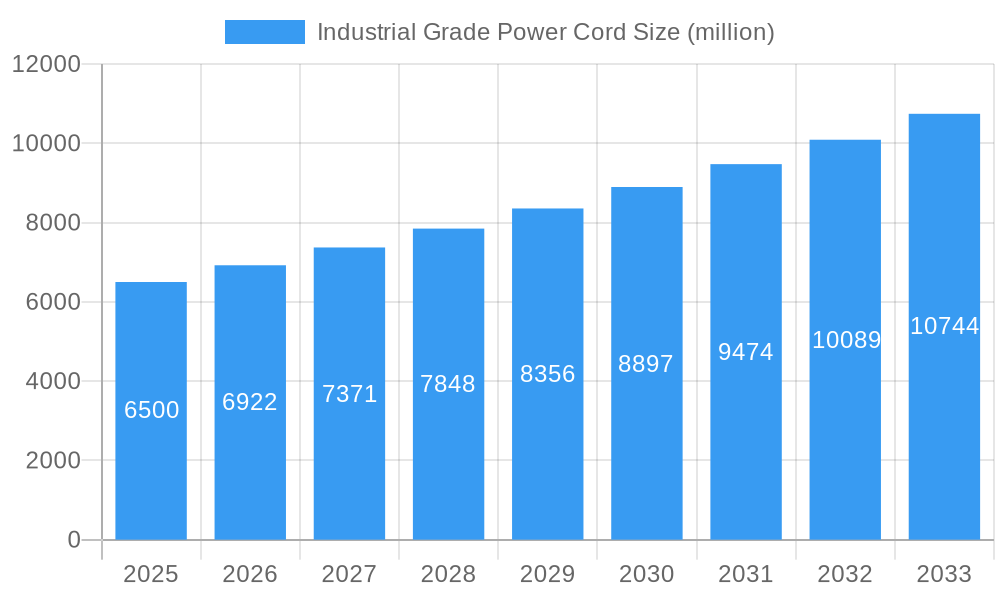
The global Industrial Grade Power Cord market is projected for substantial growth, fueled by industrial automation advancements and the increasing need for reliable electrical connections across various sectors. With an estimated market size of $1.35 billion and a CAGR of 6.8% from 2025 to 2033, this market presents a dynamic landscape. Growth is supported by significant investments in manufacturing, infrastructure, and the renewable energy sector, all requiring high-quality power cords resilient to harsh conditions. Continuous technological progress in machinery and stringent safety regulations further drive demand for durable, flexible, and well-insulated power cord solutions. Key applications span factory automation, robotics, heavy machinery, mining, and offshore operations.
Industrial Grade Power Cord Market Size (In Billion)

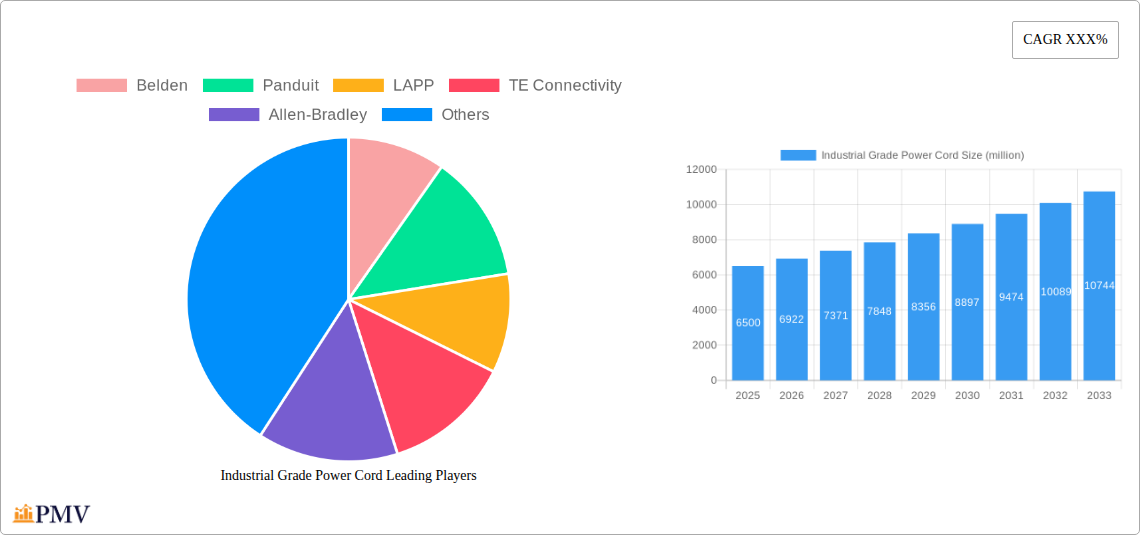
The market is segmented by application, with Automation & Robotics and Heavy Machinery anticipated to lead demand due to widespread adoption and critical power needs. By type, insulated and shielded power cords are gaining prominence as industries prioritize signal integrity and protection against electromagnetic interference. Market restraints include fluctuating raw material costs, such as copper and PVC, impacting profit margins. Stringent quality control standards and certifications may also present entry barriers. However, market leaders like Belden, Panduit, LAPP, TE Connectivity, and Allen-Bradley are well-positioned to leverage innovation, product diversification, and strategic partnerships to meet evolving industrial demands.
Industrial Grade Power Cord Company Market Share
This report offers an in-depth analysis of the Industrial Grade Power Cord market, a vital component across diverse industrial applications. Covering a study period with a base and estimated year of 2025, this report provides insights into market dynamics, growth drivers, competitive landscapes, and future outlook. We examine the heavy-duty power cord sector, analyzing the influence of industrial electrical connectors, power cable assemblies, and robust power solutions. With a forecast period extending to 2033, this report is an indispensable resource for stakeholders seeking to understand the industrial power connectivity landscape.
Industrial Grade Power Cord Market Structure & Competitive Dynamics
The Industrial Grade Power Cord market is characterized by a moderately concentrated structure, with a mix of established global players and niche manufacturers. Innovation ecosystems are robust, driven by the constant demand for enhanced durability, safety, and connectivity solutions in harsh industrial environments. Regulatory frameworks, particularly concerning electrical safety standards and environmental compliance, play a significant role in shaping market entry and product development. Product substitutes, while present in the form of lower-grade cables or integrated solutions, often fall short of the stringent performance requirements met by true industrial-grade power cords. End-user trends highlight a growing preference for customized solutions, smart connectivity features, and extended product lifecycles. Merger and acquisition (M&A) activities, valued in the tens of millions, are observed as companies seek to expand their product portfolios, geographic reach, and technological capabilities. Key market players such as Belden, Panduit, LAPP, and TE Connectivity actively participate in strategic M&A to bolster their competitive positions. The overall market share is influenced by the penetration of advanced manufacturing technologies and the demand for reliable power in critical infrastructure projects.
Industrial Grade Power Cord Industry Trends & Insights
The Industrial Grade Power Cord industry is experiencing steady growth, projected to expand at a Compound Annual Growth Rate (CAGR) of approximately 6.5% between 2025 and 2033. This upward trajectory is fueled by several key market growth drivers. The ongoing industrial automation revolution, with an increasing adoption of robots, automated machinery, and sophisticated control systems across sectors like manufacturing, automotive, and logistics, necessitates highly reliable and durable power connections. Furthermore, the global push for infrastructure development, including smart grids, renewable energy installations (solar and wind farms), and advanced transportation networks, significantly boosts the demand for robust industrial power cables and heavy-duty connectors.
Technological disruptions are also shaping the industry. The development of advanced materials offering superior resistance to heat, chemicals, abrasion, and extreme temperatures is a key innovation. Waterproof and oil-resistant power cords are becoming standard in demanding applications. The integration of smart technologies, such as embedded sensors for condition monitoring and predictive maintenance, is another burgeoning trend, allowing for greater operational efficiency and reduced downtime. Consumers, meaning industrial end-users, are increasingly prioritizing safety compliance, longevity, and ease of installation. The demand for custom-engineered power solutions tailored to specific application requirements is also on the rise. Competitive dynamics are intense, with established players differentiating themselves through product quality, certifications, R&D investments, and comprehensive customer support. Market penetration of industrial-grade power cords is projected to reach 75% in developed industrial economies by 2030, with emerging economies showing accelerated growth rates. The increasing adoption of Industry 4.0 principles and the rise of the Industrial Internet of Things (IIoT) are further amplifying the need for resilient and intelligent power connectivity.
Dominant Markets & Segments in Industrial Grade Power Cord
The Industrial Grade Power Cord market exhibits significant dominance in specific regions and segments due to a confluence of economic policies, infrastructure development, and end-user industry concentration.
Leading Region: North America, particularly the United States and Canada, currently holds a dominant position in the industrial grade power cord market.
- Key Drivers for Dominance in North America:
- Robust Industrial Base: A vast and mature manufacturing sector, encompassing automotive, aerospace, heavy machinery, and food processing, creates a consistent and high demand for industrial power solutions.
- Infrastructure Investments: Significant ongoing investments in upgrading aging infrastructure, including power grids, transportation systems, and data centers, directly translate to a substantial need for reliable electrical components.
- Technological Adoption: High adoption rates of automation, robotics, and Industry 4.0 technologies in North American industries necessitate advanced and durable power cord solutions.
- Stringent Safety Regulations: Strict safety standards and certification requirements in North America favor manufacturers of high-quality, compliant industrial-grade power cords.
- Economic Policies: Favorable business environments and incentives for manufacturing and industrial development contribute to market growth.
Leading Application: The Machinery and Equipment application segment is the largest contributor to the industrial grade power cord market.
- Key Drivers for Dominance in Machinery and Equipment:
- Ubiquitous Demand: Virtually all industrial machinery, from small assembly line equipment to large-scale manufacturing presses and mining machinery, requires robust power cords for operation.
- Harsh Operating Conditions: These machines often operate in environments with extreme temperatures, exposure to oils, chemicals, and physical stress, necessitating the durability and resilience offered by industrial-grade power cords.
- Technological Advancements in Machinery: The continuous innovation in industrial machinery, leading to more powerful and complex equipment, directly drives the demand for higher-rated and specialized power cords.
- Safety and Reliability: Equipment downtime due to power cord failure can be exceptionally costly. Therefore, industries heavily prioritize the safety and reliability of power connections for their machinery.
Leading Type: Heavy-Duty Flexible Power Cords are the most dominant type within the industrial grade power cord market.
- Key Drivers for Dominance in Heavy-Duty Flexible Power Cords:
- Flexibility and Mobility: The inherent flexibility of these cords is crucial for machinery that requires movement, articulation, or relocation on the factory floor.
- Durability and Resistance: They are engineered with robust insulation and jacketing materials designed to withstand bending, twisting, abrasion, and exposure to various industrial contaminants.
- High Current and Voltage Ratings: These cords are capable of safely carrying high electrical loads required by industrial machinery, ensuring consistent power delivery.
- Versatile Applications: Their adaptability makes them suitable for a wide array of industrial applications, from portable tools to fixed installations requiring frequent connections and disconnections.
Industrial Grade Power Cord Product Innovations
Recent product innovations in the Industrial Grade Power Cord sector focus on enhanced durability, intelligent connectivity, and specialized performance. Manufacturers are developing power cords with superior resistance to extreme temperatures, harsh chemicals, and mechanical stress, using advanced polymer compounds. Innovations include integrated sensor technologies for real-time monitoring of cable health, enabling predictive maintenance and reducing unexpected downtime. The development of self-extinguishing and flame-retardant materials, along with improved ingress protection (IP) ratings for water and dust resistance, further solidifies their suitability for demanding environments. These advancements offer competitive advantages by improving safety, extending product lifespan, and reducing operational costs for end-users across various industries.
Report Segmentation & Scope
This report segments the Industrial Grade Power Cord market based on Application and Type.
Application Segmentation: The market is segmented into applications such as Industrial Machinery & Equipment, Robotics & Automation, Renewable Energy, Data Centers, Oil & Gas, Mining, and Others. The Industrial Machinery & Equipment segment is expected to dominate, with a projected market size of over $1.5 billion by 2033, driven by continuous demand. Robotics & Automation is poised for significant growth, with a CAGR of 7.2%, reflecting increasing automation adoption.
Type Segmentation: Key types include Heavy-Duty Flexible Power Cords, Appliance Power Cords, and Custom Power Cord Assemblies. The Heavy-Duty Flexible Power Cords segment is the largest, expected to reach over $2 billion by 2033. Custom Power Cord Assemblies are witnessing strong growth due to the increasing need for tailored solutions, with a projected CAGR of 6.8%.
Key Drivers of Industrial Grade Power Cord Growth
The growth of the Industrial Grade Power Cord market is propelled by several key factors. Industrial automation and digitalization are paramount, as the increasing complexity and ubiquity of automated machinery demand reliable and robust power connectivity. Infrastructure development, particularly in emerging economies and for renewable energy projects like solar and wind farms, creates substantial demand for high-capacity power cords. Stringent safety regulations and standards drive the adoption of certified, high-quality industrial-grade products, enhancing market value. Furthermore, the growing emphasis on operational efficiency and reduced downtime by industries encourages investment in durable, long-lasting power solutions.
Challenges in the Industrial Grade Power Cord Sector
Despite robust growth, the Industrial Grade Power Cord sector faces several challenges. Volatile raw material prices, particularly for copper and specialized polymers, can impact manufacturing costs and profit margins. Intensifying competition from both established global players and emerging regional manufacturers can lead to price pressures. Complex and evolving international safety certifications can create barriers to entry for new market participants. Supply chain disruptions, as seen in recent years, can affect production timelines and product availability, potentially impacting project execution for end-users.
Leading Players in the Industrial Grade Power Cord Market
- Belden
- Panduit
- LAPP
- TE Connectivity
- Allen-Bradley
- Molex
- Mencom
- LUTZE
- Harwin
- Prysmian
- Amphenol
- HARTING Technology
- HELUKABEL
- Cablescom
- GammaSwiss
- Wieland Electric
Key Developments in Industrial Grade Power Cord Sector
- 2023 Q4: Belden launched a new line of high-performance power cords designed for extreme temperature applications in the oil and gas industry.
- 2024 Q1: Panduit acquired a specialized cable assembly manufacturer to expand its custom solutions offering.
- 2024 Q2: LAPP introduced innovative flexible power cables with enhanced oil and chemical resistance for the automotive manufacturing sector.
- 2024 Q3: TE Connectivity announced the development of intelligent power cords with integrated condition monitoring capabilities for IIoT applications.
- 2024 Q4: Molex expanded its industrial connector portfolio to include integrated power solutions for robotic systems.
Strategic Industrial Grade Power Cord Market Outlook
The future outlook for the Industrial Grade Power Cord market is exceptionally positive, driven by sustained industrial expansion and technological advancement. Growth accelerators include the increasing demand for energy-efficient power solutions, the widespread adoption of electric vehicles and charging infrastructure, and the continued globalization of manufacturing. The ongoing transition to Industry 5.0, emphasizing human-robot collaboration and sustainability, will further necessitate advanced and reliable power connectivity. Strategic opportunities lie in developing smart, IoT-enabled power cords, expanding into high-growth emerging markets, and offering comprehensive power management solutions. Collaboration between power cord manufacturers and equipment OEMs will be crucial for co-developing next-generation connectivity.
Industrial Grade Power Cord Segmentation
-
1. Application
- 1.1. undefined
-
2. Type
- 2.1. undefined
Industrial Grade Power Cord Segmentation By Geography
- 1. undefined
- 2. undefined
- 3. undefined
- 4. undefined
- 5. undefined
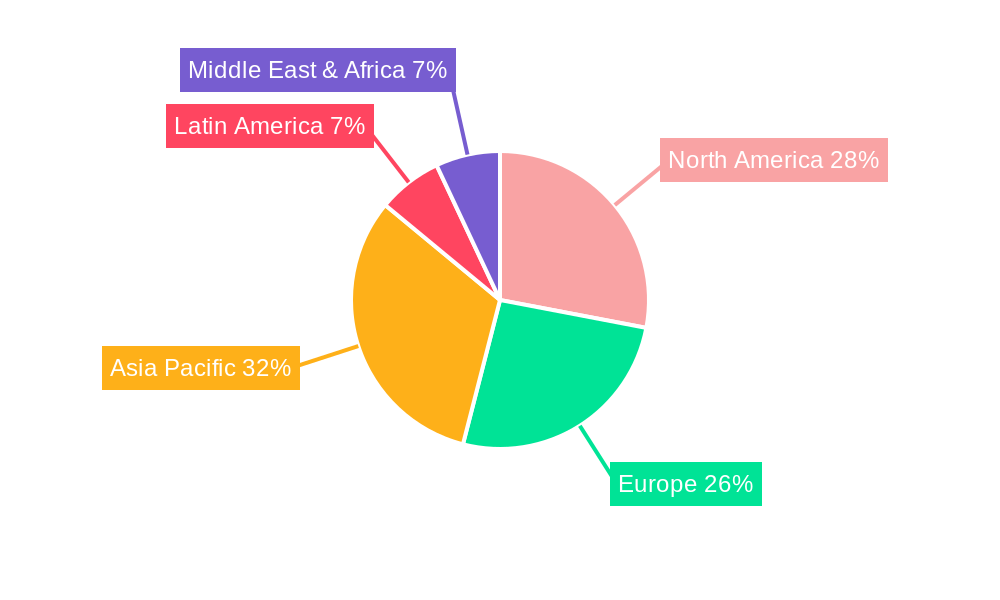
Industrial Grade Power Cord Regional Market Share
Geographic Coverage of Industrial Grade Power Cord
Industrial Grade Power Cord REPORT HIGHLIGHTS
| Aspects | Details |
|---|---|
| Study Period | 2020-2034 |
| Base Year | 2025 |
| Estimated Year | 2026 |
| Forecast Period | 2026-2034 |
| Historical Period | 2020-2025 |
| Growth Rate | CAGR of 6.8% from 2020-2034 |
| Segmentation |
|
Table of Contents
- 1. Introduction
- 1.1. Research Scope
- 1.2. Market Segmentation
- 1.3. Research Methodology
- 1.4. Definitions and Assumptions
- 2. Executive Summary
- 2.1. Introduction
- 3. Market Dynamics
- 3.1. Introduction
- 3.2. Market Drivers
- 3.3. Market Restrains
- 3.4. Market Trends
- 4. Market Factor Analysis
- 4.1. Porters Five Forces
- 4.2. Supply/Value Chain
- 4.3. PESTEL analysis
- 4.4. Market Entropy
- 4.5. Patent/Trademark Analysis
- 5. Global Industrial Grade Power Cord Analysis, Insights and Forecast, 2020-2032
- 5.1. Market Analysis, Insights and Forecast - by Application
- 5.1.1.
- 5.2. Market Analysis, Insights and Forecast - by Type
- 5.2.1.
- 5.3. Market Analysis, Insights and Forecast - by Region
- 5.3.1.
- 5.3.2.
- 5.3.3.
- 5.3.4.
- 5.3.5.
- 5.1. Market Analysis, Insights and Forecast - by Application
- 6. undefined Industrial Grade Power Cord Analysis, Insights and Forecast, 2020-2032
- 6.1. Market Analysis, Insights and Forecast - by Application
- 6.1.1.
- 6.2. Market Analysis, Insights and Forecast - by Type
- 6.2.1.
- 6.1. Market Analysis, Insights and Forecast - by Application
- 7. undefined Industrial Grade Power Cord Analysis, Insights and Forecast, 2020-2032
- 7.1. Market Analysis, Insights and Forecast - by Application
- 7.1.1.
- 7.2. Market Analysis, Insights and Forecast - by Type
- 7.2.1.
- 7.1. Market Analysis, Insights and Forecast - by Application
- 8. undefined Industrial Grade Power Cord Analysis, Insights and Forecast, 2020-2032
- 8.1. Market Analysis, Insights and Forecast - by Application
- 8.1.1.
- 8.2. Market Analysis, Insights and Forecast - by Type
- 8.2.1.
- 8.1. Market Analysis, Insights and Forecast - by Application
- 9. undefined Industrial Grade Power Cord Analysis, Insights and Forecast, 2020-2032
- 9.1. Market Analysis, Insights and Forecast - by Application
- 9.1.1.
- 9.2. Market Analysis, Insights and Forecast - by Type
- 9.2.1.
- 9.1. Market Analysis, Insights and Forecast - by Application
- 10. undefined Industrial Grade Power Cord Analysis, Insights and Forecast, 2020-2032
- 10.1. Market Analysis, Insights and Forecast - by Application
- 10.1.1.
- 10.2. Market Analysis, Insights and Forecast - by Type
- 10.2.1.
- 10.1. Market Analysis, Insights and Forecast - by Application
- 11. Competitive Analysis
- 11.1. Global Market Share Analysis 2025
- 11.2. Company Profiles
- 11.2.1 Belden
- 11.2.1.1. Overview
- 11.2.1.2. Products
- 11.2.1.3. SWOT Analysis
- 11.2.1.4. Recent Developments
- 11.2.1.5. Financials (Based on Availability)
- 11.2.2 Panduit
- 11.2.2.1. Overview
- 11.2.2.2. Products
- 11.2.2.3. SWOT Analysis
- 11.2.2.4. Recent Developments
- 11.2.2.5. Financials (Based on Availability)
- 11.2.3 LAPP
- 11.2.3.1. Overview
- 11.2.3.2. Products
- 11.2.3.3. SWOT Analysis
- 11.2.3.4. Recent Developments
- 11.2.3.5. Financials (Based on Availability)
- 11.2.4 TE Connectivity
- 11.2.4.1. Overview
- 11.2.4.2. Products
- 11.2.4.3. SWOT Analysis
- 11.2.4.4. Recent Developments
- 11.2.4.5. Financials (Based on Availability)
- 11.2.5 Allen-Bradley
- 11.2.5.1. Overview
- 11.2.5.2. Products
- 11.2.5.3. SWOT Analysis
- 11.2.5.4. Recent Developments
- 11.2.5.5. Financials (Based on Availability)
- 11.2.6 Molex
- 11.2.6.1. Overview
- 11.2.6.2. Products
- 11.2.6.3. SWOT Analysis
- 11.2.6.4. Recent Developments
- 11.2.6.5. Financials (Based on Availability)
- 11.2.7 Mencom
- 11.2.7.1. Overview
- 11.2.7.2. Products
- 11.2.7.3. SWOT Analysis
- 11.2.7.4. Recent Developments
- 11.2.7.5. Financials (Based on Availability)
- 11.2.8 LUTZE
- 11.2.8.1. Overview
- 11.2.8.2. Products
- 11.2.8.3. SWOT Analysis
- 11.2.8.4. Recent Developments
- 11.2.8.5. Financials (Based on Availability)
- 11.2.9 Harwin
- 11.2.9.1. Overview
- 11.2.9.2. Products
- 11.2.9.3. SWOT Analysis
- 11.2.9.4. Recent Developments
- 11.2.9.5. Financials (Based on Availability)
- 11.2.10 Prysmian
- 11.2.10.1. Overview
- 11.2.10.2. Products
- 11.2.10.3. SWOT Analysis
- 11.2.10.4. Recent Developments
- 11.2.10.5. Financials (Based on Availability)
- 11.2.11 Amphenol
- 11.2.11.1. Overview
- 11.2.11.2. Products
- 11.2.11.3. SWOT Analysis
- 11.2.11.4. Recent Developments
- 11.2.11.5. Financials (Based on Availability)
- 11.2.12 HARTING Technology
- 11.2.12.1. Overview
- 11.2.12.2. Products
- 11.2.12.3. SWOT Analysis
- 11.2.12.4. Recent Developments
- 11.2.12.5. Financials (Based on Availability)
- 11.2.13 HELUKABEL
- 11.2.13.1. Overview
- 11.2.13.2. Products
- 11.2.13.3. SWOT Analysis
- 11.2.13.4. Recent Developments
- 11.2.13.5. Financials (Based on Availability)
- 11.2.14 Cablescom
- 11.2.14.1. Overview
- 11.2.14.2. Products
- 11.2.14.3. SWOT Analysis
- 11.2.14.4. Recent Developments
- 11.2.14.5. Financials (Based on Availability)
- 11.2.15 GammaSwiss
- 11.2.15.1. Overview
- 11.2.15.2. Products
- 11.2.15.3. SWOT Analysis
- 11.2.15.4. Recent Developments
- 11.2.15.5. Financials (Based on Availability)
- 11.2.16 Wieland Electric
- 11.2.16.1. Overview
- 11.2.16.2. Products
- 11.2.16.3. SWOT Analysis
- 11.2.16.4. Recent Developments
- 11.2.16.5. Financials (Based on Availability)
- 11.2.1 Belden
List of Figures
- Figure 1: Global Industrial Grade Power Cord Revenue Breakdown (billion, %) by Region 2025 & 2033
- Figure 2: undefined Industrial Grade Power Cord Revenue (billion), by Application 2025 & 2033
- Figure 3: undefined Industrial Grade Power Cord Revenue Share (%), by Application 2025 & 2033
- Figure 4: undefined Industrial Grade Power Cord Revenue (billion), by Type 2025 & 2033
- Figure 5: undefined Industrial Grade Power Cord Revenue Share (%), by Type 2025 & 2033
- Figure 6: undefined Industrial Grade Power Cord Revenue (billion), by Country 2025 & 2033
- Figure 7: undefined Industrial Grade Power Cord Revenue Share (%), by Country 2025 & 2033
- Figure 8: undefined Industrial Grade Power Cord Revenue (billion), by Application 2025 & 2033
- Figure 9: undefined Industrial Grade Power Cord Revenue Share (%), by Application 2025 & 2033
- Figure 10: undefined Industrial Grade Power Cord Revenue (billion), by Type 2025 & 2033
- Figure 11: undefined Industrial Grade Power Cord Revenue Share (%), by Type 2025 & 2033
- Figure 12: undefined Industrial Grade Power Cord Revenue (billion), by Country 2025 & 2033
- Figure 13: undefined Industrial Grade Power Cord Revenue Share (%), by Country 2025 & 2033
- Figure 14: undefined Industrial Grade Power Cord Revenue (billion), by Application 2025 & 2033
- Figure 15: undefined Industrial Grade Power Cord Revenue Share (%), by Application 2025 & 2033
- Figure 16: undefined Industrial Grade Power Cord Revenue (billion), by Type 2025 & 2033
- Figure 17: undefined Industrial Grade Power Cord Revenue Share (%), by Type 2025 & 2033
- Figure 18: undefined Industrial Grade Power Cord Revenue (billion), by Country 2025 & 2033
- Figure 19: undefined Industrial Grade Power Cord Revenue Share (%), by Country 2025 & 2033
- Figure 20: undefined Industrial Grade Power Cord Revenue (billion), by Application 2025 & 2033
- Figure 21: undefined Industrial Grade Power Cord Revenue Share (%), by Application 2025 & 2033
- Figure 22: undefined Industrial Grade Power Cord Revenue (billion), by Type 2025 & 2033
- Figure 23: undefined Industrial Grade Power Cord Revenue Share (%), by Type 2025 & 2033
- Figure 24: undefined Industrial Grade Power Cord Revenue (billion), by Country 2025 & 2033
- Figure 25: undefined Industrial Grade Power Cord Revenue Share (%), by Country 2025 & 2033
- Figure 26: undefined Industrial Grade Power Cord Revenue (billion), by Application 2025 & 2033
- Figure 27: undefined Industrial Grade Power Cord Revenue Share (%), by Application 2025 & 2033
- Figure 28: undefined Industrial Grade Power Cord Revenue (billion), by Type 2025 & 2033
- Figure 29: undefined Industrial Grade Power Cord Revenue Share (%), by Type 2025 & 2033
- Figure 30: undefined Industrial Grade Power Cord Revenue (billion), by Country 2025 & 2033
- Figure 31: undefined Industrial Grade Power Cord Revenue Share (%), by Country 2025 & 2033
List of Tables
- Table 1: Global Industrial Grade Power Cord Revenue billion Forecast, by Application 2020 & 2033
- Table 2: Global Industrial Grade Power Cord Revenue billion Forecast, by Type 2020 & 2033
- Table 3: Global Industrial Grade Power Cord Revenue billion Forecast, by Region 2020 & 2033
- Table 4: Global Industrial Grade Power Cord Revenue billion Forecast, by Application 2020 & 2033
- Table 5: Global Industrial Grade Power Cord Revenue billion Forecast, by Type 2020 & 2033
- Table 6: Global Industrial Grade Power Cord Revenue billion Forecast, by Country 2020 & 2033
- Table 7: Global Industrial Grade Power Cord Revenue billion Forecast, by Application 2020 & 2033
- Table 8: Global Industrial Grade Power Cord Revenue billion Forecast, by Type 2020 & 2033
- Table 9: Global Industrial Grade Power Cord Revenue billion Forecast, by Country 2020 & 2033
- Table 10: Global Industrial Grade Power Cord Revenue billion Forecast, by Application 2020 & 2033
- Table 11: Global Industrial Grade Power Cord Revenue billion Forecast, by Type 2020 & 2033
- Table 12: Global Industrial Grade Power Cord Revenue billion Forecast, by Country 2020 & 2033
- Table 13: Global Industrial Grade Power Cord Revenue billion Forecast, by Application 2020 & 2033
- Table 14: Global Industrial Grade Power Cord Revenue billion Forecast, by Type 2020 & 2033
- Table 15: Global Industrial Grade Power Cord Revenue billion Forecast, by Country 2020 & 2033
- Table 16: Global Industrial Grade Power Cord Revenue billion Forecast, by Application 2020 & 2033
- Table 17: Global Industrial Grade Power Cord Revenue billion Forecast, by Type 2020 & 2033
- Table 18: Global Industrial Grade Power Cord Revenue billion Forecast, by Country 2020 & 2033
Frequently Asked Questions
1. What is the projected Compound Annual Growth Rate (CAGR) of the Industrial Grade Power Cord?
The projected CAGR is approximately 6.8%.
2. Which companies are prominent players in the Industrial Grade Power Cord?
Key companies in the market include Belden, Panduit, LAPP, TE Connectivity, Allen-Bradley, Molex, Mencom, LUTZE, Harwin, Prysmian, Amphenol, HARTING Technology, HELUKABEL, Cablescom, GammaSwiss, Wieland Electric.
3. What are the main segments of the Industrial Grade Power Cord?
The market segments include Application, Type.
4. Can you provide details about the market size?
The market size is estimated to be USD 1.35 billion as of 2022.
5. What are some drivers contributing to market growth?
N/A
6. What are the notable trends driving market growth?
N/A
7. Are there any restraints impacting market growth?
N/A
8. Can you provide examples of recent developments in the market?
N/A
9. What pricing options are available for accessing the report?
Pricing options include single-user, multi-user, and enterprise licenses priced at USD 4250.00, USD 6375.00, and USD 8500.00 respectively.
10. Is the market size provided in terms of value or volume?
The market size is provided in terms of value, measured in billion.
11. Are there any specific market keywords associated with the report?
Yes, the market keyword associated with the report is "Industrial Grade Power Cord," which aids in identifying and referencing the specific market segment covered.
12. How do I determine which pricing option suits my needs best?
The pricing options vary based on user requirements and access needs. Individual users may opt for single-user licenses, while businesses requiring broader access may choose multi-user or enterprise licenses for cost-effective access to the report.
13. Are there any additional resources or data provided in the Industrial Grade Power Cord report?
While the report offers comprehensive insights, it's advisable to review the specific contents or supplementary materials provided to ascertain if additional resources or data are available.
14. How can I stay updated on further developments or reports in the Industrial Grade Power Cord?
To stay informed about further developments, trends, and reports in the Industrial Grade Power Cord, consider subscribing to industry newsletters, following relevant companies and organizations, or regularly checking reputable industry news sources and publications.
Methodology
Step 1 - Identification of Relevant Samples Size from Population Database


Step 2 - Approaches for Defining Global Market Size (Value, Volume* & Price*)

Note*: In applicable scenarios
Step 3 - Data Sources
Primary Research
- Web Analytics
- Survey Reports
- Research Institute
- Latest Research Reports
- Opinion Leaders
Secondary Research
- Annual Reports
- White Paper
- Latest Press Release
- Industry Association
- Paid Database
- Investor Presentations

Step 4 - Data Triangulation
Involves using different sources of information in order to increase the validity of a study
These sources are likely to be stakeholders in a program - participants, other researchers, program staff, other community members, and so on.
Then we put all data in single framework & apply various statistical tools to find out the dynamic on the market.
During the analysis stage, feedback from the stakeholder groups would be compared to determine areas of agreement as well as areas of divergence