
Key Insights
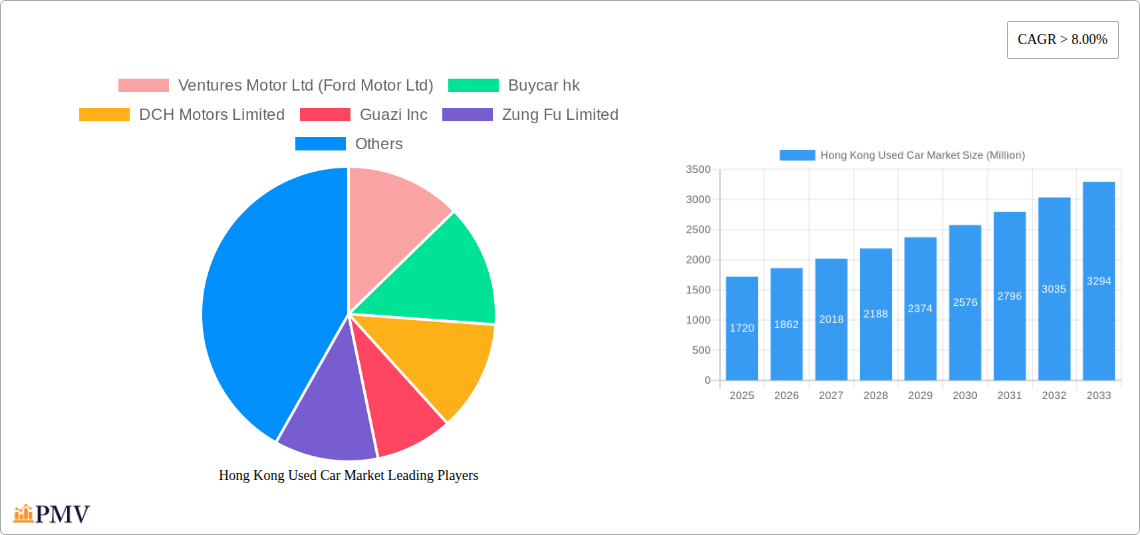
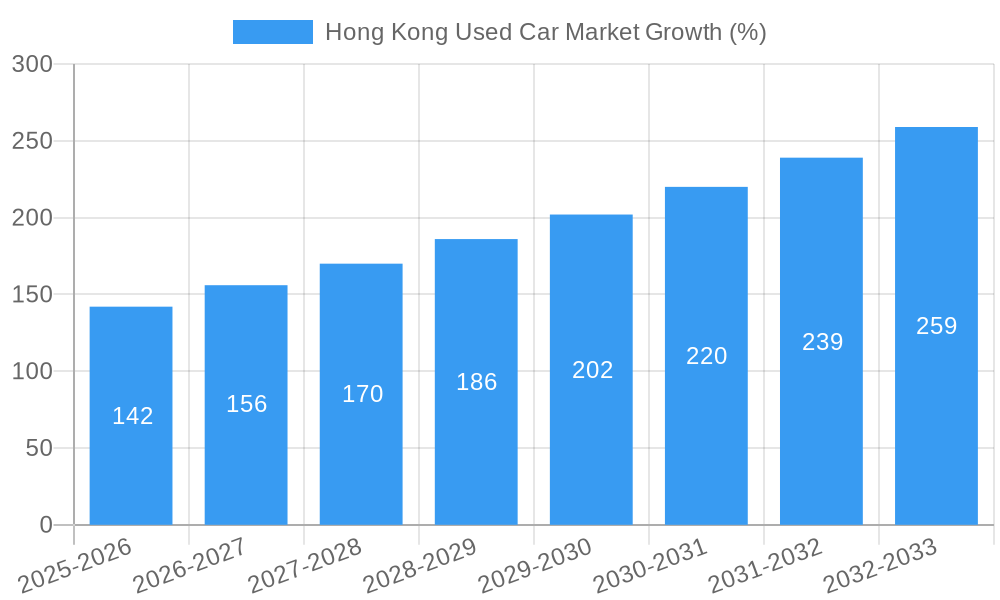
The Hong Kong used car market, valued at $1.72 billion in 2025, is projected to experience robust growth, exhibiting a Compound Annual Growth Rate (CAGR) exceeding 8% from 2025 to 2033. This growth is fueled by several factors. Increasing vehicle ownership among a growing middle class, coupled with a preference for more affordable used vehicles over new ones, particularly in a high-cost-of-living city like Hong Kong, significantly contributes to market expansion. Furthermore, the rising popularity of SUVs and MUVs, driven by changing lifestyle preferences and family needs, is boosting demand within specific vehicle segments. The market is segmented by vendor type (organized and unorganized dealerships), fuel type (gasoline, diesel, electric, and alternative fuel vehicles), and vehicle type (hatchbacks, sedans, SUVs, and MUVs). Organized dealerships are likely to hold a larger market share due to their established infrastructure and consumer trust, although the unorganized sector remains a significant player. The transition towards electric and alternative fuel vehicles, albeit gradual, represents a noteworthy trend that will influence market dynamics in the coming years. While limited data prevents a precise breakdown of segmental contributions, the organized sector and gasoline-powered vehicles are expected to dominate in the short-term. Restraints on growth could include stringent vehicle import regulations, fluctuating fuel prices, and the overall economic health of Hong Kong.
The competitive landscape includes both established local players like Kam Lung Motor Group and Dah Chong Hong Holdings Limited, and international entrants such as ventures affiliated with Ford Motor Company. The presence of online used car marketplaces like Guazi Inc. (while not explicitly stated as operating in Hong Kong, their business model suggests potential market presence) is also reshaping the consumer experience and impacting market dynamics. Future growth will depend on government policies related to vehicle emissions, infrastructure development supporting electric vehicles, and continued economic stability. The forecast period of 2025-2033 presents significant opportunities for established players and new entrants alike to capitalize on this growing market, demanding strategic adaptation to changing consumer preferences and technological advancements.
Hong Kong Used Car Market: A Comprehensive Report (2019-2033)
This comprehensive report provides a detailed analysis of the Hong Kong used car market, offering invaluable insights for industry stakeholders, investors, and strategic planners. The study period covers 2019-2033, with 2025 as the base and estimated year. The report forecasts market trends from 2025 to 2033, utilizing data from the historical period of 2019-2024. The market is valued at approximately xx Million USD in 2025 and is projected to reach xx Million USD by 2033, exhibiting a CAGR of xx% during the forecast period. The report segments the market by vendor type (organized, unorganized), fuel type (gasoline, diesel, electric, alternative fuel vehicles), and vehicle type (hatchback, sedan, SUV, MUV). Key players analyzed include Ventures Motor Ltd (Ford Motor Ltd), Buycar hk, DCH Motors Limited, Guazi Inc, Zung Fu Limited, VINS MOTORS COMPANY LTD, Kam Lung Motor Group, Hong Kong Motor City, Lit Motors HK, and Dah Chong Hong Holdings Limited.
Hong Kong Used Car Market Market Structure & Competitive Dynamics
The Hong Kong used car market exhibits a moderately concentrated structure, with a few large organized players dominating the landscape alongside numerous smaller, unorganized vendors. Market share data indicates that organized players account for approximately xx% of the market, while the unorganized sector comprises the remaining xx%. Innovation within the ecosystem is driven by the adoption of online platforms, improved vehicle inspection technologies, and financing solutions. The regulatory framework, while generally supportive of market growth, imposes certain requirements regarding vehicle inspections and emissions standards. Product substitutes, such as public transportation and ride-hailing services, exert a moderate influence on market demand. End-user preferences are shifting towards newer vehicles with enhanced fuel efficiency and technological features.
M&A activity has been relatively moderate in recent years, with notable transactions including:
- Jardine Cycle & Carriage's USD 60 Million investment in Carro in June 2023 to bolster online used car sales.
- Other M&A deals (values not disclosed) xx Million USD.
Hong Kong Used Car Market Industry Trends & Insights
The Hong Kong used car market is characterized by several key trends. Market growth is primarily fueled by increasing urbanization, rising disposable incomes, and a preference for personal mobility. Technological disruptions, such as the rise of online marketplaces and digital inspection tools, are transforming the customer experience and improving market efficiency. Consumer preferences are evolving towards fuel-efficient vehicles, SUVs, and models with advanced safety features. Competitive dynamics are shaped by the increasing presence of organized players offering improved transparency, financing options, and warranty programs, which puts pressure on smaller, unorganized businesses. The market penetration of online platforms is increasing steadily, driven by convenience and accessibility. The overall market shows a positive growth trajectory, albeit influenced by macroeconomic factors and government policies.
Dominant Markets & Segments in Hong Kong Used Car Market
The Hong Kong Island and Kowloon regions represent the most dominant geographical segments, owing to higher population density and economic activity. Within the vendor type segment, organized players are capturing a larger market share due to their ability to offer better services and financing options. Gasoline-powered vehicles constitute the largest segment by fuel type, reflecting the existing infrastructure and consumer preferences. However, the electric vehicle (EV) segment is witnessing rapid growth, driven by government initiatives to promote sustainable transportation and technological advancements making EVs more accessible.
- Key Drivers for Organized Vendor Dominance:
- Enhanced customer service and warranties.
- Access to financing options and streamlined processes.
- Growing consumer trust and brand recognition.
- Key Drivers for Gasoline Vehicle Dominance:
- Existing infrastructure and widespread availability of fuel.
- Relatively lower upfront costs compared to EVs.
- Key Drivers for SUV Dominance:
- Growing popularity for family-oriented vehicles.
- Increased affordability and a wide range of options available in the used car market.
Hong Kong Used Car Market Product Innovations
Recent product innovations have focused on enhancing the used car buying experience through online platforms that provide detailed vehicle history reports, virtual inspections, and seamless financing options. Technological advancements such as AI-powered pricing tools and improved vehicle condition assessment algorithms are also improving transparency and trust in the market. These innovations are streamlining the purchasing process, increasing consumer convenience, and building confidence in online transactions, thus driving market growth.
Report Segmentation & Scope
This report segments the Hong Kong used car market based on:
- Vendor Type: Organized players offer a structured approach to sales, warranties, and financing; the Unorganized segment comprises individual sellers and smaller dealerships. Organized players are projected to grow at a CAGR of xx%, while the unorganized segment is expected to grow at xx%.
- Fuel Type: The market is segmented into Gasoline, Diesel, Electric, and Alternative Fuel Vehicles. The growth of electric vehicles is expected to significantly outpace other segments due to government incentives and environmental concerns.
- Vehicle Type: The report analyzes market segments for Hatchbacks, Sedans, SUVs, and MUVs. SUVs are projected to maintain significant growth momentum owing to their versatility and suitability for Hong Kong’s urban landscape.
Key Drivers of Hong Kong Used Car Market Growth
Several factors drive the growth of the Hong Kong used car market:
- Rising disposable incomes and increasing demand for personal vehicles.
- Government initiatives promoting sustainable transportation and fuel efficiency.
- The increasing adoption of online platforms and digital technologies facilitating ease of access and efficient transactions.
Challenges in the Hong Kong Used Car Market Sector
The Hong Kong used car market faces several challenges:
- Stringent regulations related to vehicle inspections and emissions standards can increase operational costs for sellers.
- Limited availability of parking space in urban areas affects the market's expansion.
- Competition from organized players puts pressure on smaller, unorganized businesses.
Leading Players in the Hong Kong Used Car Market Market
- Ventures Motor Ltd (Ford Motor Ltd)
- Buycar hk
- DCH Motors Limited
- Guazi Inc
- Zung Fu Limited
- VINS MOTORS COMPANY LTD
- Kam Lung Motor Group
- Hong Kong Motor City
- Lit Motors HK
- Dah Chong Hong Holdings Limited
Key Developments in Hong Kong Used Car Market Sector
- June 2023: Jardine Cycle & Carriage's USD 60 Million investment in Carro signifies a major push towards online used car sales.
- September 2022: Cango's launch of the Haoche app expands the online used car trading platform, further enhancing market digitization.
Strategic Hong Kong Used Car Market Market Outlook
The future of the Hong Kong used car market appears promising, with continued growth driven by evolving consumer preferences, technological advancements, and government support for sustainable transportation. Strategic opportunities exist for players to capitalize on the increasing adoption of online platforms, improve financing options, and offer innovative services to meet the changing needs of the market. Focus on sustainability and electric vehicles will be key to success in the long term.
Hong Kong Used Car Market Segmentation
-
1. Vehicle Type
- 1.1. Hatchback
- 1.2. Sedan
- 1.3. Sport Utility Vehicles (SUVs)
- 1.4. Multi-Purpose Vehicles (MUVs)
-
2. Vendor Type
- 2.1. Organized
- 2.2. Unorganized
-
3. Fuel Type
- 3.1. Gasoline
- 3.2. Diesel
- 3.3. Electric
- 3.4. Alternative Fuel Vehicles
Hong Kong Used Car Market Segmentation By Geography
-
1. North America
- 1.1. United States
- 1.2. Canada
- 1.3. Mexico
-
2. South America
- 2.1. Brazil
- 2.2. Argentina
- 2.3. Rest of South America
-
3. Europe
- 3.1. United Kingdom
- 3.2. Germany
- 3.3. France
- 3.4. Italy
- 3.5. Spain
- 3.6. Russia
- 3.7. Benelux
- 3.8. Nordics
- 3.9. Rest of Europe
-
4. Middle East & Africa
- 4.1. Turkey
- 4.2. Israel
- 4.3. GCC
- 4.4. North Africa
- 4.5. South Africa
- 4.6. Rest of Middle East & Africa
-
5. Asia Pacific
- 5.1. China
- 5.2. India
- 5.3. Japan
- 5.4. South Korea
- 5.5. ASEAN
- 5.6. Oceania
- 5.7. Rest of Asia Pacific
Hong Kong Used Car Market REPORT HIGHLIGHTS
| Aspects | Details |
|---|---|
| Study Period | 2019-2033 |
| Base Year | 2024 |
| Estimated Year | 2025 |
| Forecast Period | 2025-2033 |
| Historical Period | 2019-2024 |
| Growth Rate | CAGR of > 8.00% from 2019-2033 |
| Segmentation |
|
Table of Contents
- 1. Introduction
- 1.1. Research Scope
- 1.2. Market Segmentation
- 1.3. Research Methodology
- 1.4. Definitions and Assumptions
- 2. Executive Summary
- 2.1. Introduction
- 3. Market Dynamics
- 3.1. Introduction
- 3.2. Market Drivers
- 3.2.1. Rise in Price of New Vehicles
- 3.3. Market Restrains
- 3.3.1. Trust And Transparency In Used Car Remained A Key Challenge For Consumers
- 3.4. Market Trends
- 3.4.1. Growing Used Car Financing Aiding Market Growth
- 4. Market Factor Analysis
- 4.1. Porters Five Forces
- 4.2. Supply/Value Chain
- 4.3. PESTEL analysis
- 4.4. Market Entropy
- 4.5. Patent/Trademark Analysis
- 5. Global Hong Kong Used Car Market Analysis, Insights and Forecast, 2019-2031
- 5.1. Market Analysis, Insights and Forecast - by Vehicle Type
- 5.1.1. Hatchback
- 5.1.2. Sedan
- 5.1.3. Sport Utility Vehicles (SUVs)
- 5.1.4. Multi-Purpose Vehicles (MUVs)
- 5.2. Market Analysis, Insights and Forecast - by Vendor Type
- 5.2.1. Organized
- 5.2.2. Unorganized
- 5.3. Market Analysis, Insights and Forecast - by Fuel Type
- 5.3.1. Gasoline
- 5.3.2. Diesel
- 5.3.3. Electric
- 5.3.4. Alternative Fuel Vehicles
- 5.4. Market Analysis, Insights and Forecast - by Region
- 5.4.1. North America
- 5.4.2. South America
- 5.4.3. Europe
- 5.4.4. Middle East & Africa
- 5.4.5. Asia Pacific
- 5.1. Market Analysis, Insights and Forecast - by Vehicle Type
- 6. North America Hong Kong Used Car Market Analysis, Insights and Forecast, 2019-2031
- 6.1. Market Analysis, Insights and Forecast - by Vehicle Type
- 6.1.1. Hatchback
- 6.1.2. Sedan
- 6.1.3. Sport Utility Vehicles (SUVs)
- 6.1.4. Multi-Purpose Vehicles (MUVs)
- 6.2. Market Analysis, Insights and Forecast - by Vendor Type
- 6.2.1. Organized
- 6.2.2. Unorganized
- 6.3. Market Analysis, Insights and Forecast - by Fuel Type
- 6.3.1. Gasoline
- 6.3.2. Diesel
- 6.3.3. Electric
- 6.3.4. Alternative Fuel Vehicles
- 6.1. Market Analysis, Insights and Forecast - by Vehicle Type
- 7. South America Hong Kong Used Car Market Analysis, Insights and Forecast, 2019-2031
- 7.1. Market Analysis, Insights and Forecast - by Vehicle Type
- 7.1.1. Hatchback
- 7.1.2. Sedan
- 7.1.3. Sport Utility Vehicles (SUVs)
- 7.1.4. Multi-Purpose Vehicles (MUVs)
- 7.2. Market Analysis, Insights and Forecast - by Vendor Type
- 7.2.1. Organized
- 7.2.2. Unorganized
- 7.3. Market Analysis, Insights and Forecast - by Fuel Type
- 7.3.1. Gasoline
- 7.3.2. Diesel
- 7.3.3. Electric
- 7.3.4. Alternative Fuel Vehicles
- 7.1. Market Analysis, Insights and Forecast - by Vehicle Type
- 8. Europe Hong Kong Used Car Market Analysis, Insights and Forecast, 2019-2031
- 8.1. Market Analysis, Insights and Forecast - by Vehicle Type
- 8.1.1. Hatchback
- 8.1.2. Sedan
- 8.1.3. Sport Utility Vehicles (SUVs)
- 8.1.4. Multi-Purpose Vehicles (MUVs)
- 8.2. Market Analysis, Insights and Forecast - by Vendor Type
- 8.2.1. Organized
- 8.2.2. Unorganized
- 8.3. Market Analysis, Insights and Forecast - by Fuel Type
- 8.3.1. Gasoline
- 8.3.2. Diesel
- 8.3.3. Electric
- 8.3.4. Alternative Fuel Vehicles
- 8.1. Market Analysis, Insights and Forecast - by Vehicle Type
- 9. Middle East & Africa Hong Kong Used Car Market Analysis, Insights and Forecast, 2019-2031
- 9.1. Market Analysis, Insights and Forecast - by Vehicle Type
- 9.1.1. Hatchback
- 9.1.2. Sedan
- 9.1.3. Sport Utility Vehicles (SUVs)
- 9.1.4. Multi-Purpose Vehicles (MUVs)
- 9.2. Market Analysis, Insights and Forecast - by Vendor Type
- 9.2.1. Organized
- 9.2.2. Unorganized
- 9.3. Market Analysis, Insights and Forecast - by Fuel Type
- 9.3.1. Gasoline
- 9.3.2. Diesel
- 9.3.3. Electric
- 9.3.4. Alternative Fuel Vehicles
- 9.1. Market Analysis, Insights and Forecast - by Vehicle Type
- 10. Asia Pacific Hong Kong Used Car Market Analysis, Insights and Forecast, 2019-2031
- 10.1. Market Analysis, Insights and Forecast - by Vehicle Type
- 10.1.1. Hatchback
- 10.1.2. Sedan
- 10.1.3. Sport Utility Vehicles (SUVs)
- 10.1.4. Multi-Purpose Vehicles (MUVs)
- 10.2. Market Analysis, Insights and Forecast - by Vendor Type
- 10.2.1. Organized
- 10.2.2. Unorganized
- 10.3. Market Analysis, Insights and Forecast - by Fuel Type
- 10.3.1. Gasoline
- 10.3.2. Diesel
- 10.3.3. Electric
- 10.3.4. Alternative Fuel Vehicles
- 10.1. Market Analysis, Insights and Forecast - by Vehicle Type
- 11. Competitive Analysis
- 11.1. Global Market Share Analysis 2024
- 11.2. Company Profiles
- 11.2.1 Ventures Motor Ltd (Ford Motor Ltd)
- 11.2.1.1. Overview
- 11.2.1.2. Products
- 11.2.1.3. SWOT Analysis
- 11.2.1.4. Recent Developments
- 11.2.1.5. Financials (Based on Availability)
- 11.2.2 Buycar hk
- 11.2.2.1. Overview
- 11.2.2.2. Products
- 11.2.2.3. SWOT Analysis
- 11.2.2.4. Recent Developments
- 11.2.2.5. Financials (Based on Availability)
- 11.2.3 DCH Motors Limited
- 11.2.3.1. Overview
- 11.2.3.2. Products
- 11.2.3.3. SWOT Analysis
- 11.2.3.4. Recent Developments
- 11.2.3.5. Financials (Based on Availability)
- 11.2.4 Guazi Inc
- 11.2.4.1. Overview
- 11.2.4.2. Products
- 11.2.4.3. SWOT Analysis
- 11.2.4.4. Recent Developments
- 11.2.4.5. Financials (Based on Availability)
- 11.2.5 Zung Fu Limited
- 11.2.5.1. Overview
- 11.2.5.2. Products
- 11.2.5.3. SWOT Analysis
- 11.2.5.4. Recent Developments
- 11.2.5.5. Financials (Based on Availability)
- 11.2.6 VINS MOTORS COMPANY LTD
- 11.2.6.1. Overview
- 11.2.6.2. Products
- 11.2.6.3. SWOT Analysis
- 11.2.6.4. Recent Developments
- 11.2.6.5. Financials (Based on Availability)
- 11.2.7 Kam Lung Motor Group
- 11.2.7.1. Overview
- 11.2.7.2. Products
- 11.2.7.3. SWOT Analysis
- 11.2.7.4. Recent Developments
- 11.2.7.5. Financials (Based on Availability)
- 11.2.8 Hong Kong Motor City
- 11.2.8.1. Overview
- 11.2.8.2. Products
- 11.2.8.3. SWOT Analysis
- 11.2.8.4. Recent Developments
- 11.2.8.5. Financials (Based on Availability)
- 11.2.9 Lit Motors HK
- 11.2.9.1. Overview
- 11.2.9.2. Products
- 11.2.9.3. SWOT Analysis
- 11.2.9.4. Recent Developments
- 11.2.9.5. Financials (Based on Availability)
- 11.2.10 Dah Chong Hong Holdings Limite
- 11.2.10.1. Overview
- 11.2.10.2. Products
- 11.2.10.3. SWOT Analysis
- 11.2.10.4. Recent Developments
- 11.2.10.5. Financials (Based on Availability)
- 11.2.1 Ventures Motor Ltd (Ford Motor Ltd)
List of Figures
- Figure 1: Global Hong Kong Used Car Market Revenue Breakdown (Million, %) by Region 2024 & 2032
- Figure 2: Hong Kong Hong Kong Used Car Market Revenue (Million), by Country 2024 & 2032
- Figure 3: Hong Kong Hong Kong Used Car Market Revenue Share (%), by Country 2024 & 2032
- Figure 4: North America Hong Kong Used Car Market Revenue (Million), by Vehicle Type 2024 & 2032
- Figure 5: North America Hong Kong Used Car Market Revenue Share (%), by Vehicle Type 2024 & 2032
- Figure 6: North America Hong Kong Used Car Market Revenue (Million), by Vendor Type 2024 & 2032
- Figure 7: North America Hong Kong Used Car Market Revenue Share (%), by Vendor Type 2024 & 2032
- Figure 8: North America Hong Kong Used Car Market Revenue (Million), by Fuel Type 2024 & 2032
- Figure 9: North America Hong Kong Used Car Market Revenue Share (%), by Fuel Type 2024 & 2032
- Figure 10: North America Hong Kong Used Car Market Revenue (Million), by Country 2024 & 2032
- Figure 11: North America Hong Kong Used Car Market Revenue Share (%), by Country 2024 & 2032
- Figure 12: South America Hong Kong Used Car Market Revenue (Million), by Vehicle Type 2024 & 2032
- Figure 13: South America Hong Kong Used Car Market Revenue Share (%), by Vehicle Type 2024 & 2032
- Figure 14: South America Hong Kong Used Car Market Revenue (Million), by Vendor Type 2024 & 2032
- Figure 15: South America Hong Kong Used Car Market Revenue Share (%), by Vendor Type 2024 & 2032
- Figure 16: South America Hong Kong Used Car Market Revenue (Million), by Fuel Type 2024 & 2032
- Figure 17: South America Hong Kong Used Car Market Revenue Share (%), by Fuel Type 2024 & 2032
- Figure 18: South America Hong Kong Used Car Market Revenue (Million), by Country 2024 & 2032
- Figure 19: South America Hong Kong Used Car Market Revenue Share (%), by Country 2024 & 2032
- Figure 20: Europe Hong Kong Used Car Market Revenue (Million), by Vehicle Type 2024 & 2032
- Figure 21: Europe Hong Kong Used Car Market Revenue Share (%), by Vehicle Type 2024 & 2032
- Figure 22: Europe Hong Kong Used Car Market Revenue (Million), by Vendor Type 2024 & 2032
- Figure 23: Europe Hong Kong Used Car Market Revenue Share (%), by Vendor Type 2024 & 2032
- Figure 24: Europe Hong Kong Used Car Market Revenue (Million), by Fuel Type 2024 & 2032
- Figure 25: Europe Hong Kong Used Car Market Revenue Share (%), by Fuel Type 2024 & 2032
- Figure 26: Europe Hong Kong Used Car Market Revenue (Million), by Country 2024 & 2032
- Figure 27: Europe Hong Kong Used Car Market Revenue Share (%), by Country 2024 & 2032
- Figure 28: Middle East & Africa Hong Kong Used Car Market Revenue (Million), by Vehicle Type 2024 & 2032
- Figure 29: Middle East & Africa Hong Kong Used Car Market Revenue Share (%), by Vehicle Type 2024 & 2032
- Figure 30: Middle East & Africa Hong Kong Used Car Market Revenue (Million), by Vendor Type 2024 & 2032
- Figure 31: Middle East & Africa Hong Kong Used Car Market Revenue Share (%), by Vendor Type 2024 & 2032
- Figure 32: Middle East & Africa Hong Kong Used Car Market Revenue (Million), by Fuel Type 2024 & 2032
- Figure 33: Middle East & Africa Hong Kong Used Car Market Revenue Share (%), by Fuel Type 2024 & 2032
- Figure 34: Middle East & Africa Hong Kong Used Car Market Revenue (Million), by Country 2024 & 2032
- Figure 35: Middle East & Africa Hong Kong Used Car Market Revenue Share (%), by Country 2024 & 2032
- Figure 36: Asia Pacific Hong Kong Used Car Market Revenue (Million), by Vehicle Type 2024 & 2032
- Figure 37: Asia Pacific Hong Kong Used Car Market Revenue Share (%), by Vehicle Type 2024 & 2032
- Figure 38: Asia Pacific Hong Kong Used Car Market Revenue (Million), by Vendor Type 2024 & 2032
- Figure 39: Asia Pacific Hong Kong Used Car Market Revenue Share (%), by Vendor Type 2024 & 2032
- Figure 40: Asia Pacific Hong Kong Used Car Market Revenue (Million), by Fuel Type 2024 & 2032
- Figure 41: Asia Pacific Hong Kong Used Car Market Revenue Share (%), by Fuel Type 2024 & 2032
- Figure 42: Asia Pacific Hong Kong Used Car Market Revenue (Million), by Country 2024 & 2032
- Figure 43: Asia Pacific Hong Kong Used Car Market Revenue Share (%), by Country 2024 & 2032
List of Tables
- Table 1: Global Hong Kong Used Car Market Revenue Million Forecast, by Region 2019 & 2032
- Table 2: Global Hong Kong Used Car Market Revenue Million Forecast, by Vehicle Type 2019 & 2032
- Table 3: Global Hong Kong Used Car Market Revenue Million Forecast, by Vendor Type 2019 & 2032
- Table 4: Global Hong Kong Used Car Market Revenue Million Forecast, by Fuel Type 2019 & 2032
- Table 5: Global Hong Kong Used Car Market Revenue Million Forecast, by Region 2019 & 2032
- Table 6: Global Hong Kong Used Car Market Revenue Million Forecast, by Country 2019 & 2032
- Table 7: Global Hong Kong Used Car Market Revenue Million Forecast, by Vehicle Type 2019 & 2032
- Table 8: Global Hong Kong Used Car Market Revenue Million Forecast, by Vendor Type 2019 & 2032
- Table 9: Global Hong Kong Used Car Market Revenue Million Forecast, by Fuel Type 2019 & 2032
- Table 10: Global Hong Kong Used Car Market Revenue Million Forecast, by Country 2019 & 2032
- Table 11: United States Hong Kong Used Car Market Revenue (Million) Forecast, by Application 2019 & 2032
- Table 12: Canada Hong Kong Used Car Market Revenue (Million) Forecast, by Application 2019 & 2032
- Table 13: Mexico Hong Kong Used Car Market Revenue (Million) Forecast, by Application 2019 & 2032
- Table 14: Global Hong Kong Used Car Market Revenue Million Forecast, by Vehicle Type 2019 & 2032
- Table 15: Global Hong Kong Used Car Market Revenue Million Forecast, by Vendor Type 2019 & 2032
- Table 16: Global Hong Kong Used Car Market Revenue Million Forecast, by Fuel Type 2019 & 2032
- Table 17: Global Hong Kong Used Car Market Revenue Million Forecast, by Country 2019 & 2032
- Table 18: Brazil Hong Kong Used Car Market Revenue (Million) Forecast, by Application 2019 & 2032
- Table 19: Argentina Hong Kong Used Car Market Revenue (Million) Forecast, by Application 2019 & 2032
- Table 20: Rest of South America Hong Kong Used Car Market Revenue (Million) Forecast, by Application 2019 & 2032
- Table 21: Global Hong Kong Used Car Market Revenue Million Forecast, by Vehicle Type 2019 & 2032
- Table 22: Global Hong Kong Used Car Market Revenue Million Forecast, by Vendor Type 2019 & 2032
- Table 23: Global Hong Kong Used Car Market Revenue Million Forecast, by Fuel Type 2019 & 2032
- Table 24: Global Hong Kong Used Car Market Revenue Million Forecast, by Country 2019 & 2032
- Table 25: United Kingdom Hong Kong Used Car Market Revenue (Million) Forecast, by Application 2019 & 2032
- Table 26: Germany Hong Kong Used Car Market Revenue (Million) Forecast, by Application 2019 & 2032
- Table 27: France Hong Kong Used Car Market Revenue (Million) Forecast, by Application 2019 & 2032
- Table 28: Italy Hong Kong Used Car Market Revenue (Million) Forecast, by Application 2019 & 2032
- Table 29: Spain Hong Kong Used Car Market Revenue (Million) Forecast, by Application 2019 & 2032
- Table 30: Russia Hong Kong Used Car Market Revenue (Million) Forecast, by Application 2019 & 2032
- Table 31: Benelux Hong Kong Used Car Market Revenue (Million) Forecast, by Application 2019 & 2032
- Table 32: Nordics Hong Kong Used Car Market Revenue (Million) Forecast, by Application 2019 & 2032
- Table 33: Rest of Europe Hong Kong Used Car Market Revenue (Million) Forecast, by Application 2019 & 2032
- Table 34: Global Hong Kong Used Car Market Revenue Million Forecast, by Vehicle Type 2019 & 2032
- Table 35: Global Hong Kong Used Car Market Revenue Million Forecast, by Vendor Type 2019 & 2032
- Table 36: Global Hong Kong Used Car Market Revenue Million Forecast, by Fuel Type 2019 & 2032
- Table 37: Global Hong Kong Used Car Market Revenue Million Forecast, by Country 2019 & 2032
- Table 38: Turkey Hong Kong Used Car Market Revenue (Million) Forecast, by Application 2019 & 2032
- Table 39: Israel Hong Kong Used Car Market Revenue (Million) Forecast, by Application 2019 & 2032
- Table 40: GCC Hong Kong Used Car Market Revenue (Million) Forecast, by Application 2019 & 2032
- Table 41: North Africa Hong Kong Used Car Market Revenue (Million) Forecast, by Application 2019 & 2032
- Table 42: South Africa Hong Kong Used Car Market Revenue (Million) Forecast, by Application 2019 & 2032
- Table 43: Rest of Middle East & Africa Hong Kong Used Car Market Revenue (Million) Forecast, by Application 2019 & 2032
- Table 44: Global Hong Kong Used Car Market Revenue Million Forecast, by Vehicle Type 2019 & 2032
- Table 45: Global Hong Kong Used Car Market Revenue Million Forecast, by Vendor Type 2019 & 2032
- Table 46: Global Hong Kong Used Car Market Revenue Million Forecast, by Fuel Type 2019 & 2032
- Table 47: Global Hong Kong Used Car Market Revenue Million Forecast, by Country 2019 & 2032
- Table 48: China Hong Kong Used Car Market Revenue (Million) Forecast, by Application 2019 & 2032
- Table 49: India Hong Kong Used Car Market Revenue (Million) Forecast, by Application 2019 & 2032
- Table 50: Japan Hong Kong Used Car Market Revenue (Million) Forecast, by Application 2019 & 2032
- Table 51: South Korea Hong Kong Used Car Market Revenue (Million) Forecast, by Application 2019 & 2032
- Table 52: ASEAN Hong Kong Used Car Market Revenue (Million) Forecast, by Application 2019 & 2032
- Table 53: Oceania Hong Kong Used Car Market Revenue (Million) Forecast, by Application 2019 & 2032
- Table 54: Rest of Asia Pacific Hong Kong Used Car Market Revenue (Million) Forecast, by Application 2019 & 2032
Frequently Asked Questions
1. What is the projected Compound Annual Growth Rate (CAGR) of the Hong Kong Used Car Market?
The projected CAGR is approximately > 8.00%.
2. Which companies are prominent players in the Hong Kong Used Car Market?
Key companies in the market include Ventures Motor Ltd (Ford Motor Ltd), Buycar hk, DCH Motors Limited, Guazi Inc, Zung Fu Limited, VINS MOTORS COMPANY LTD, Kam Lung Motor Group, Hong Kong Motor City, Lit Motors HK, Dah Chong Hong Holdings Limite.
3. What are the main segments of the Hong Kong Used Car Market?
The market segments include Vehicle Type, Vendor Type, Fuel Type.
4. Can you provide details about the market size?
The market size is estimated to be USD 1.72 Million as of 2022.
5. What are some drivers contributing to market growth?
Rise in Price of New Vehicles.
6. What are the notable trends driving market growth?
Growing Used Car Financing Aiding Market Growth.
7. Are there any restraints impacting market growth?
Trust And Transparency In Used Car Remained A Key Challenge For Consumers.
8. Can you provide examples of recent developments in the market?
June 2023: Jardine Cycle & Carriage, the investment arm of Hong Kong-based conglomerate Jardine Matheson, collaborated with Carro, Singapore's online automotive marketplace. The company signed a deal for USD 60 million to enhance used car sales in Hing Kong.
9. What pricing options are available for accessing the report?
Pricing options include single-user, multi-user, and enterprise licenses priced at USD 3800, USD 4500, and USD 5800 respectively.
10. Is the market size provided in terms of value or volume?
The market size is provided in terms of value, measured in Million.
11. Are there any specific market keywords associated with the report?
Yes, the market keyword associated with the report is "Hong Kong Used Car Market," which aids in identifying and referencing the specific market segment covered.
12. How do I determine which pricing option suits my needs best?
The pricing options vary based on user requirements and access needs. Individual users may opt for single-user licenses, while businesses requiring broader access may choose multi-user or enterprise licenses for cost-effective access to the report.
13. Are there any additional resources or data provided in the Hong Kong Used Car Market report?
While the report offers comprehensive insights, it's advisable to review the specific contents or supplementary materials provided to ascertain if additional resources or data are available.
14. How can I stay updated on further developments or reports in the Hong Kong Used Car Market?
To stay informed about further developments, trends, and reports in the Hong Kong Used Car Market, consider subscribing to industry newsletters, following relevant companies and organizations, or regularly checking reputable industry news sources and publications.
Methodology
Step 1 - Identification of Relevant Samples Size from Population Database


Step 2 - Approaches for Defining Global Market Size (Value, Volume* & Price*)

Note*: In applicable scenarios
Step 3 - Data Sources
Primary Research
- Web Analytics
- Survey Reports
- Research Institute
- Latest Research Reports
- Opinion Leaders
Secondary Research
- Annual Reports
- White Paper
- Latest Press Release
- Industry Association
- Paid Database
- Investor Presentations

Step 4 - Data Triangulation
Involves using different sources of information in order to increase the validity of a study
These sources are likely to be stakeholders in a program - participants, other researchers, program staff, other community members, and so on.
Then we put all data in single framework & apply various statistical tools to find out the dynamic on the market.
During the analysis stage, feedback from the stakeholder groups would be compared to determine areas of agreement as well as areas of divergence


