
Key Insights
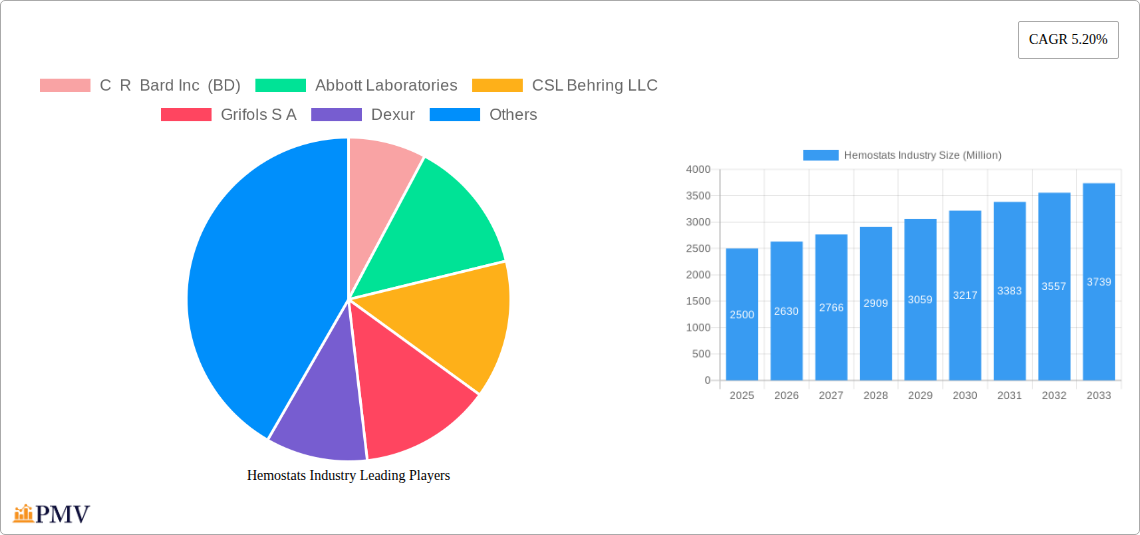
The global hemostats market, valued at approximately $XX million in 2025, is projected to experience robust growth, exhibiting a compound annual growth rate (CAGR) of 5.20% from 2025 to 2033. This expansion is fueled by several key drivers. The rising incidence of trauma cases and surgical procedures globally significantly boosts demand for effective hemostasis solutions. Furthermore, advancements in hemostatic technologies, including the development of novel biocompatible and minimally invasive products like flowable complexes and synthetic sealants, are driving market growth. The increasing prevalence of chronic diseases, such as hemophilia and thrombosis, requiring specialized hemostatic interventions, also contributes to market expansion. Growth is further supported by the rising adoption of minimally invasive surgical techniques and the growing focus on improving patient outcomes. However, factors like high costs associated with advanced hemostatic products, stringent regulatory approvals, and potential side effects related to certain hemostatic agents act as market restraints.
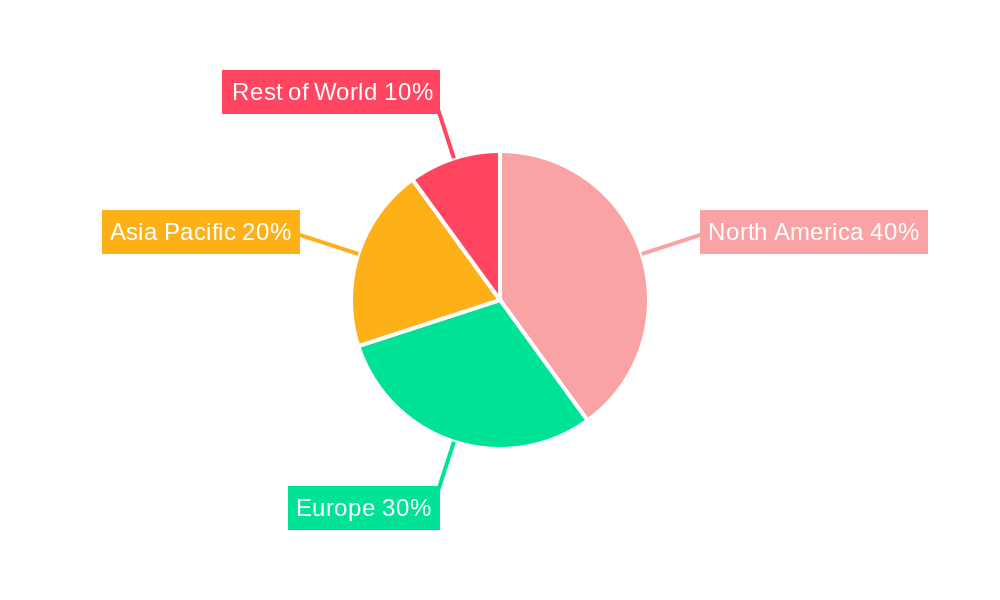
Market segmentation reveals a diverse landscape. Topical hemostats, encompassing collagen, oxidized regenerated cellulose, and gelatin products, currently dominate the product segment due to their ease of use and broad applicability. However, the advanced hemostats segment, characterized by flowable and fibrin complexes, is anticipated to witness the fastest growth owing to their superior efficacy and reduced bleeding complications in complex surgical scenarios. Geographically, North America and Europe hold significant market shares due to advanced healthcare infrastructure and high healthcare expenditure. However, rapidly developing economies in the Asia-Pacific region, particularly China and India, present substantial growth opportunities driven by increasing healthcare awareness and rising disposable incomes. Major players in the market, including C R Bard Inc (BD), Abbott Laboratories, CSL Behring LLC, and Johnson & Johnson, are focusing on strategic collaborations, product innovation, and market expansion to solidify their positions. The market's future trajectory hinges on continuous innovation in hemostatic technologies, coupled with favorable regulatory environments and expanding healthcare access in emerging markets.
This comprehensive report provides an in-depth analysis of the global Hemostats industry, offering valuable insights into market dynamics, competitive landscapes, and future growth prospects. Covering the period from 2019 to 2033, with a base year of 2025 and a forecast period of 2025-2033, this report is an essential resource for industry stakeholders, investors, and strategic decision-makers. The market is valued at xx Million in 2025 and is projected to reach xx Million by 2033, exhibiting a CAGR of xx%.
Hemostats Industry Market Structure & Competitive Dynamics
This section analyzes the competitive intensity, innovation, regulatory landscape, and market dynamics within the hemostasis industry. The market is characterized by a moderately concentrated structure with key players like C R Bard Inc (BD), Abbott Laboratories, CSL Behring LLC, Grifols S.A., and Johnson & Johnson holding significant market share. However, the presence of several smaller players and emerging companies fosters a dynamic competitive environment.
The industry witnesses substantial M&A activity, driven by the need for expansion and technological advancements. The total value of M&A deals in the hemostats market during the historical period (2019-2024) is estimated to be xx Million. This includes both large-scale acquisitions and strategic partnerships aimed at broadening product portfolios and expanding geographic reach.
- Market Concentration: The top 5 players account for approximately xx% of the global market share.
- Innovation Ecosystems: Significant investments in R&D drive innovation in advanced hemostasis products, including synthetic sealants and bioengineered solutions.
- Regulatory Frameworks: Stringent regulatory approvals and safety standards influence product development and market entry.
- Product Substitutes: The availability of alternative treatments and therapies presents a competitive challenge.
- End-User Trends: The increasing prevalence of chronic diseases and a rise in surgical procedures contribute to market growth.
- M&A Activities: Strategic acquisitions and mergers are reshaping the competitive landscape, leading to increased market consolidation.
Hemostats Industry Industry Trends & Insights
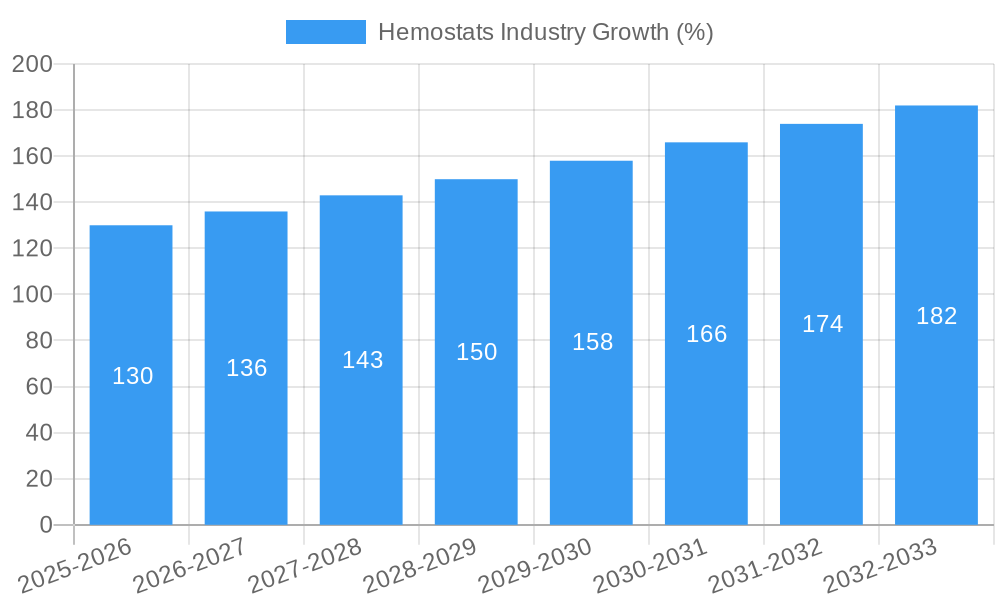
The global hemostats market is experiencing robust growth, driven by several key factors. The aging global population, the rising prevalence of chronic diseases necessitating surgical interventions, and technological advancements are major contributors to market expansion. The increasing demand for minimally invasive surgical procedures is also fueling the growth of advanced hemostasis products. The market is witnessing a shift towards innovative hemostatic agents with improved efficacy, biocompatibility, and reduced side effects. Technological disruptions, such as the development of novel biomaterials and drug delivery systems, are transforming the hemostats market. The CAGR for the forecast period (2025-2033) is estimated at xx%, reflecting a strong growth trajectory. Market penetration of advanced hemostasis products is expected to increase from xx% in 2025 to xx% by 2033.
Dominant Markets & Segments in Hemostats Industry
The North American region currently dominates the hemostats market, driven by high healthcare expenditure, technological advancements, and the prevalence of chronic diseases. Within the product segments, topical hemostasis products hold the largest market share, followed by infusible and advanced hemostasis products. The surgical application segment is the most significant end-use application, followed by trauma and other applications.
- Key Drivers for North American Dominance:
- High healthcare expenditure and robust insurance coverage.
- Advanced healthcare infrastructure and technological advancements.
- High prevalence of chronic diseases requiring surgical interventions.
- Topical Hemostasis Products: This segment is experiencing steady growth due to the wide adoption of collagen-based and oxidized regenerated cellulose products.
- Infusible Hemostasis Products: This segment is growing due to the increasing demand for blood-derived products in trauma and surgical settings.
- Advanced Hemostasis Products: This segment shows significant growth potential due to the ongoing innovation and development of novel synthetic sealants and bioengineered solutions.
- Surgical Applications: This application segment benefits from the increasing number of surgical procedures performed globally.
Hemostats Industry Product Innovations
Recent advancements include the development of novel biomaterials, such as synthetic sealants and bioengineered hemostatic agents, offering improved efficacy and reduced side effects compared to traditional products. These innovations are aimed at enhancing surgical outcomes, minimizing complications, and improving patient recovery times. The focus is on developing products that are more effective, safer, and easier to use. Market fit is being achieved through a combination of technological innovation and a deep understanding of unmet clinical needs.
Report Segmentation & Scope
This report segments the hemostats market by end-user (Hospitals, Clinics, Others), product type (Topical Hemostasis Products, Infusible Hemostasis Products, Advanced Hemostasis Products), and application (Trauma, Surgery, Hemophilia, Myocardial Infarction, Thrombosis, Others). Each segment is analyzed in detail, providing insights into market size, growth projections, and competitive dynamics. For example, the topical hemostasis product segment is expected to exhibit a CAGR of xx% during the forecast period, driven by the increasing demand for collagen-based products. The Hospitals segment is projected to dominate the end-user market due to the high volume of surgeries performed in these facilities.
Key Drivers of Hemostats Industry Growth
Several factors contribute to the growth of the hemostats industry. Technological advancements leading to the development of innovative products with improved efficacy and safety are a major driver. The rising prevalence of chronic diseases, necessitating surgical procedures, fuels market growth. Furthermore, supportive regulatory frameworks and increased healthcare spending in emerging economies contribute to the expanding market.
Challenges in the Hemostats Industry Sector
The hemostats industry faces several challenges. Stringent regulatory approvals and safety standards can increase the time and cost of product development and market entry. Supply chain disruptions and the volatility of raw material prices can also impact profitability. Intense competition among established players and emerging companies also presents a challenge.
Leading Players in the Hemostats Industry Market
- C R Bard Inc (BD)
- Abbott Laboratories
- CSL Behring LLC
- Grifols S.A
- Dexur
- Johnson & Johnson
- Tricol Biomedical
- Baxter International Inc
- Medtronic plc
- Pfizer Inc
Key Developments in Hemostats Industry Sector
- May 2022: Precision BioLogic Inc. launched its cryocheck Chromogenic Factor IX assay in Canada, the EU, the UK, Australia, and New Zealand.
- February 2022: Futura Surgicare Pvt Ltd launched hemostatic products under the brand Hemostax.
Strategic Hemostats Industry Market Outlook
The hemostats market presents significant growth opportunities in the coming years. Continued innovation in product development, expansion into emerging markets, and strategic collaborations will drive future growth. The focus on developing minimally invasive surgical techniques and improving patient outcomes will shape the future of the hemostats industry. The market is poised for strong growth, fueled by advancements in biomaterials and a growing demand for effective and safe hemostatic solutions.
Hemostats Industry Segmentation
-
1. Product
- 1.1. Topical
- 1.2. Infusibl
- 1.3. Advanced
-
2. Application
- 2.1. Trauma
- 2.2. Surgery
- 2.3. Hemophilia
- 2.4. Myocardial Infarction
- 2.5. Thrombosis
- 2.6. Others
-
3. End User
- 3.1. Hospitals
- 3.2. Clinics
- 3.3. Others
Hemostats Industry Segmentation By Geography
-
1. North America
- 1.1. United States
- 1.2. Canada
- 1.3. Mexico
-
2. Europe
- 2.1. Germany
- 2.2. United Kingdom
- 2.3. France
- 2.4. Italy
- 2.5. Spain
- 2.6. Rest of Europe
-
3. Asia Pacific
- 3.1. China
- 3.2. Japan
- 3.3. India
- 3.4. Australia
- 3.5. South Korea
- 3.6. Rest of Asia Pacific
-
4. Middle East and Africa
- 4.1. GCC
- 4.2. South Africa
- 4.3. Rest of Middle East and Africa
-
5. South America
- 5.1. Brazil
- 5.2. Argentina
- 5.3. Rest of South America
Hemostats Industry REPORT HIGHLIGHTS
| Aspects | Details |
|---|---|
| Study Period | 2019-2033 |
| Base Year | 2024 |
| Estimated Year | 2025 |
| Forecast Period | 2025-2033 |
| Historical Period | 2019-2024 |
| Growth Rate | CAGR of 5.20% from 2019-2033 |
| Segmentation |
|
Table of Contents
- 1. Introduction
- 1.1. Research Scope
- 1.2. Market Segmentation
- 1.3. Research Methodology
- 1.4. Definitions and Assumptions
- 2. Executive Summary
- 2.1. Introduction
- 3. Market Dynamics
- 3.1. Introduction
- 3.2. Market Drivers
- 3.2.1. Increasing Number Of Trauma And Surgical Cases; Technological Advancements
- 3.3. Market Restrains
- 3.3.1. Stringent Regulatory Policies and Increasing Use of Off-Label Products
- 3.4. Market Trends
- 3.4.1. Surgery Segment is Expected to Hold a Significant Market Share
- 4. Market Factor Analysis
- 4.1. Porters Five Forces
- 4.2. Supply/Value Chain
- 4.3. PESTEL analysis
- 4.4. Market Entropy
- 4.5. Patent/Trademark Analysis
- 5. Global Hemostats Industry Analysis, Insights and Forecast, 2019-2031
- 5.1. Market Analysis, Insights and Forecast - by Product
- 5.1.1. Topical
- 5.1.2. Infusibl
- 5.1.3. Advanced
- 5.2. Market Analysis, Insights and Forecast - by Application
- 5.2.1. Trauma
- 5.2.2. Surgery
- 5.2.3. Hemophilia
- 5.2.4. Myocardial Infarction
- 5.2.5. Thrombosis
- 5.2.6. Others
- 5.3. Market Analysis, Insights and Forecast - by End User
- 5.3.1. Hospitals
- 5.3.2. Clinics
- 5.3.3. Others
- 5.4. Market Analysis, Insights and Forecast - by Region
- 5.4.1. North America
- 5.4.2. Europe
- 5.4.3. Asia Pacific
- 5.4.4. Middle East and Africa
- 5.4.5. South America
- 5.1. Market Analysis, Insights and Forecast - by Product
- 6. North America Hemostats Industry Analysis, Insights and Forecast, 2019-2031
- 6.1. Market Analysis, Insights and Forecast - by Product
- 6.1.1. Topical
- 6.1.2. Infusibl
- 6.1.3. Advanced
- 6.2. Market Analysis, Insights and Forecast - by Application
- 6.2.1. Trauma
- 6.2.2. Surgery
- 6.2.3. Hemophilia
- 6.2.4. Myocardial Infarction
- 6.2.5. Thrombosis
- 6.2.6. Others
- 6.3. Market Analysis, Insights and Forecast - by End User
- 6.3.1. Hospitals
- 6.3.2. Clinics
- 6.3.3. Others
- 6.1. Market Analysis, Insights and Forecast - by Product
- 7. Europe Hemostats Industry Analysis, Insights and Forecast, 2019-2031
- 7.1. Market Analysis, Insights and Forecast - by Product
- 7.1.1. Topical
- 7.1.2. Infusibl
- 7.1.3. Advanced
- 7.2. Market Analysis, Insights and Forecast - by Application
- 7.2.1. Trauma
- 7.2.2. Surgery
- 7.2.3. Hemophilia
- 7.2.4. Myocardial Infarction
- 7.2.5. Thrombosis
- 7.2.6. Others
- 7.3. Market Analysis, Insights and Forecast - by End User
- 7.3.1. Hospitals
- 7.3.2. Clinics
- 7.3.3. Others
- 7.1. Market Analysis, Insights and Forecast - by Product
- 8. Asia Pacific Hemostats Industry Analysis, Insights and Forecast, 2019-2031
- 8.1. Market Analysis, Insights and Forecast - by Product
- 8.1.1. Topical
- 8.1.2. Infusibl
- 8.1.3. Advanced
- 8.2. Market Analysis, Insights and Forecast - by Application
- 8.2.1. Trauma
- 8.2.2. Surgery
- 8.2.3. Hemophilia
- 8.2.4. Myocardial Infarction
- 8.2.5. Thrombosis
- 8.2.6. Others
- 8.3. Market Analysis, Insights and Forecast - by End User
- 8.3.1. Hospitals
- 8.3.2. Clinics
- 8.3.3. Others
- 8.1. Market Analysis, Insights and Forecast - by Product
- 9. Middle East and Africa Hemostats Industry Analysis, Insights and Forecast, 2019-2031
- 9.1. Market Analysis, Insights and Forecast - by Product
- 9.1.1. Topical
- 9.1.2. Infusibl
- 9.1.3. Advanced
- 9.2. Market Analysis, Insights and Forecast - by Application
- 9.2.1. Trauma
- 9.2.2. Surgery
- 9.2.3. Hemophilia
- 9.2.4. Myocardial Infarction
- 9.2.5. Thrombosis
- 9.2.6. Others
- 9.3. Market Analysis, Insights and Forecast - by End User
- 9.3.1. Hospitals
- 9.3.2. Clinics
- 9.3.3. Others
- 9.1. Market Analysis, Insights and Forecast - by Product
- 10. South America Hemostats Industry Analysis, Insights and Forecast, 2019-2031
- 10.1. Market Analysis, Insights and Forecast - by Product
- 10.1.1. Topical
- 10.1.2. Infusibl
- 10.1.3. Advanced
- 10.2. Market Analysis, Insights and Forecast - by Application
- 10.2.1. Trauma
- 10.2.2. Surgery
- 10.2.3. Hemophilia
- 10.2.4. Myocardial Infarction
- 10.2.5. Thrombosis
- 10.2.6. Others
- 10.3. Market Analysis, Insights and Forecast - by End User
- 10.3.1. Hospitals
- 10.3.2. Clinics
- 10.3.3. Others
- 10.1. Market Analysis, Insights and Forecast - by Product
- 11. North Americ Hemostats Industry Analysis, Insights and Forecast, 2019-2031
- 11.1. Market Analysis, Insights and Forecast - By Country/Sub-region
- 11.1.1 United States
- 11.1.2 Canada
- 11.1.3 Mexico
- 12. South America Hemostats Industry Analysis, Insights and Forecast, 2019-2031
- 12.1. Market Analysis, Insights and Forecast - By Country/Sub-region
- 12.1.1 Brazil
- 12.1.2 Mexico
- 12.1.3 Rest of South America
- 13. Europe Hemostats Industry Analysis, Insights and Forecast, 2019-2031
- 13.1. Market Analysis, Insights and Forecast - By Country/Sub-region
- 13.1.1 Germany
- 13.1.2 United Kingdom
- 13.1.3 France
- 13.1.4 Italy
- 13.1.5 Spain
- 13.1.6 Rest of Europe
- 14. Asia Pacific Hemostats Industry Analysis, Insights and Forecast, 2019-2031
- 14.1. Market Analysis, Insights and Forecast - By Country/Sub-region
- 14.1.1 China
- 14.1.2 Japan
- 14.1.3 India
- 14.1.4 South Korea
- 14.1.5 Taiwan
- 14.1.6 Australia
- 14.1.7 Rest of Asia-Pacific
- 15. MEA Hemostats Industry Analysis, Insights and Forecast, 2019-2031
- 15.1. Market Analysis, Insights and Forecast - By Country/Sub-region
- 15.1.1 Middle East
- 15.1.2 Africa
- 16. Competitive Analysis
- 16.1. Global Market Share Analysis 2024
- 16.2. Company Profiles
- 16.2.1 C R Bard Inc (BD)
- 16.2.1.1. Overview
- 16.2.1.2. Products
- 16.2.1.3. SWOT Analysis
- 16.2.1.4. Recent Developments
- 16.2.1.5. Financials (Based on Availability)
- 16.2.2 Abbott Laboratories
- 16.2.2.1. Overview
- 16.2.2.2. Products
- 16.2.2.3. SWOT Analysis
- 16.2.2.4. Recent Developments
- 16.2.2.5. Financials (Based on Availability)
- 16.2.3 CSL Behring LLC
- 16.2.3.1. Overview
- 16.2.3.2. Products
- 16.2.3.3. SWOT Analysis
- 16.2.3.4. Recent Developments
- 16.2.3.5. Financials (Based on Availability)
- 16.2.4 Grifols S A
- 16.2.4.1. Overview
- 16.2.4.2. Products
- 16.2.4.3. SWOT Analysis
- 16.2.4.4. Recent Developments
- 16.2.4.5. Financials (Based on Availability)
- 16.2.5 Dexur
- 16.2.5.1. Overview
- 16.2.5.2. Products
- 16.2.5.3. SWOT Analysis
- 16.2.5.4. Recent Developments
- 16.2.5.5. Financials (Based on Availability)
- 16.2.6 Johnson & Johnson
- 16.2.6.1. Overview
- 16.2.6.2. Products
- 16.2.6.3. SWOT Analysis
- 16.2.6.4. Recent Developments
- 16.2.6.5. Financials (Based on Availability)
- 16.2.7 Tricol Biomedical
- 16.2.7.1. Overview
- 16.2.7.2. Products
- 16.2.7.3. SWOT Analysis
- 16.2.7.4. Recent Developments
- 16.2.7.5. Financials (Based on Availability)
- 16.2.8 Baxter International Inc
- 16.2.8.1. Overview
- 16.2.8.2. Products
- 16.2.8.3. SWOT Analysis
- 16.2.8.4. Recent Developments
- 16.2.8.5. Financials (Based on Availability)
- 16.2.9 Medtronic plc
- 16.2.9.1. Overview
- 16.2.9.2. Products
- 16.2.9.3. SWOT Analysis
- 16.2.9.4. Recent Developments
- 16.2.9.5. Financials (Based on Availability)
- 16.2.10 Pfizer Inc
- 16.2.10.1. Overview
- 16.2.10.2. Products
- 16.2.10.3. SWOT Analysis
- 16.2.10.4. Recent Developments
- 16.2.10.5. Financials (Based on Availability)
- 16.2.1 C R Bard Inc (BD)
List of Figures
- Figure 1: Global Hemostats Industry Revenue Breakdown (Million, %) by Region 2024 & 2032
- Figure 2: Global Hemostats Industry Volume Breakdown (K Unit, %) by Region 2024 & 2032
- Figure 3: North Americ Hemostats Industry Revenue (Million), by Country 2024 & 2032
- Figure 4: North Americ Hemostats Industry Volume (K Unit), by Country 2024 & 2032
- Figure 5: North Americ Hemostats Industry Revenue Share (%), by Country 2024 & 2032
- Figure 6: North Americ Hemostats Industry Volume Share (%), by Country 2024 & 2032
- Figure 7: South America Hemostats Industry Revenue (Million), by Country 2024 & 2032
- Figure 8: South America Hemostats Industry Volume (K Unit), by Country 2024 & 2032
- Figure 9: South America Hemostats Industry Revenue Share (%), by Country 2024 & 2032
- Figure 10: South America Hemostats Industry Volume Share (%), by Country 2024 & 2032
- Figure 11: Europe Hemostats Industry Revenue (Million), by Country 2024 & 2032
- Figure 12: Europe Hemostats Industry Volume (K Unit), by Country 2024 & 2032
- Figure 13: Europe Hemostats Industry Revenue Share (%), by Country 2024 & 2032
- Figure 14: Europe Hemostats Industry Volume Share (%), by Country 2024 & 2032
- Figure 15: Asia Pacific Hemostats Industry Revenue (Million), by Country 2024 & 2032
- Figure 16: Asia Pacific Hemostats Industry Volume (K Unit), by Country 2024 & 2032
- Figure 17: Asia Pacific Hemostats Industry Revenue Share (%), by Country 2024 & 2032
- Figure 18: Asia Pacific Hemostats Industry Volume Share (%), by Country 2024 & 2032
- Figure 19: MEA Hemostats Industry Revenue (Million), by Country 2024 & 2032
- Figure 20: MEA Hemostats Industry Volume (K Unit), by Country 2024 & 2032
- Figure 21: MEA Hemostats Industry Revenue Share (%), by Country 2024 & 2032
- Figure 22: MEA Hemostats Industry Volume Share (%), by Country 2024 & 2032
- Figure 23: North America Hemostats Industry Revenue (Million), by Product 2024 & 2032
- Figure 24: North America Hemostats Industry Volume (K Unit), by Product 2024 & 2032
- Figure 25: North America Hemostats Industry Revenue Share (%), by Product 2024 & 2032
- Figure 26: North America Hemostats Industry Volume Share (%), by Product 2024 & 2032
- Figure 27: North America Hemostats Industry Revenue (Million), by Application 2024 & 2032
- Figure 28: North America Hemostats Industry Volume (K Unit), by Application 2024 & 2032
- Figure 29: North America Hemostats Industry Revenue Share (%), by Application 2024 & 2032
- Figure 30: North America Hemostats Industry Volume Share (%), by Application 2024 & 2032
- Figure 31: North America Hemostats Industry Revenue (Million), by End User 2024 & 2032
- Figure 32: North America Hemostats Industry Volume (K Unit), by End User 2024 & 2032
- Figure 33: North America Hemostats Industry Revenue Share (%), by End User 2024 & 2032
- Figure 34: North America Hemostats Industry Volume Share (%), by End User 2024 & 2032
- Figure 35: North America Hemostats Industry Revenue (Million), by Country 2024 & 2032
- Figure 36: North America Hemostats Industry Volume (K Unit), by Country 2024 & 2032
- Figure 37: North America Hemostats Industry Revenue Share (%), by Country 2024 & 2032
- Figure 38: North America Hemostats Industry Volume Share (%), by Country 2024 & 2032
- Figure 39: Europe Hemostats Industry Revenue (Million), by Product 2024 & 2032
- Figure 40: Europe Hemostats Industry Volume (K Unit), by Product 2024 & 2032
- Figure 41: Europe Hemostats Industry Revenue Share (%), by Product 2024 & 2032
- Figure 42: Europe Hemostats Industry Volume Share (%), by Product 2024 & 2032
- Figure 43: Europe Hemostats Industry Revenue (Million), by Application 2024 & 2032
- Figure 44: Europe Hemostats Industry Volume (K Unit), by Application 2024 & 2032
- Figure 45: Europe Hemostats Industry Revenue Share (%), by Application 2024 & 2032
- Figure 46: Europe Hemostats Industry Volume Share (%), by Application 2024 & 2032
- Figure 47: Europe Hemostats Industry Revenue (Million), by End User 2024 & 2032
- Figure 48: Europe Hemostats Industry Volume (K Unit), by End User 2024 & 2032
- Figure 49: Europe Hemostats Industry Revenue Share (%), by End User 2024 & 2032
- Figure 50: Europe Hemostats Industry Volume Share (%), by End User 2024 & 2032
- Figure 51: Europe Hemostats Industry Revenue (Million), by Country 2024 & 2032
- Figure 52: Europe Hemostats Industry Volume (K Unit), by Country 2024 & 2032
- Figure 53: Europe Hemostats Industry Revenue Share (%), by Country 2024 & 2032
- Figure 54: Europe Hemostats Industry Volume Share (%), by Country 2024 & 2032
- Figure 55: Asia Pacific Hemostats Industry Revenue (Million), by Product 2024 & 2032
- Figure 56: Asia Pacific Hemostats Industry Volume (K Unit), by Product 2024 & 2032
- Figure 57: Asia Pacific Hemostats Industry Revenue Share (%), by Product 2024 & 2032
- Figure 58: Asia Pacific Hemostats Industry Volume Share (%), by Product 2024 & 2032
- Figure 59: Asia Pacific Hemostats Industry Revenue (Million), by Application 2024 & 2032
- Figure 60: Asia Pacific Hemostats Industry Volume (K Unit), by Application 2024 & 2032
- Figure 61: Asia Pacific Hemostats Industry Revenue Share (%), by Application 2024 & 2032
- Figure 62: Asia Pacific Hemostats Industry Volume Share (%), by Application 2024 & 2032
- Figure 63: Asia Pacific Hemostats Industry Revenue (Million), by End User 2024 & 2032
- Figure 64: Asia Pacific Hemostats Industry Volume (K Unit), by End User 2024 & 2032
- Figure 65: Asia Pacific Hemostats Industry Revenue Share (%), by End User 2024 & 2032
- Figure 66: Asia Pacific Hemostats Industry Volume Share (%), by End User 2024 & 2032
- Figure 67: Asia Pacific Hemostats Industry Revenue (Million), by Country 2024 & 2032
- Figure 68: Asia Pacific Hemostats Industry Volume (K Unit), by Country 2024 & 2032
- Figure 69: Asia Pacific Hemostats Industry Revenue Share (%), by Country 2024 & 2032
- Figure 70: Asia Pacific Hemostats Industry Volume Share (%), by Country 2024 & 2032
- Figure 71: Middle East and Africa Hemostats Industry Revenue (Million), by Product 2024 & 2032
- Figure 72: Middle East and Africa Hemostats Industry Volume (K Unit), by Product 2024 & 2032
- Figure 73: Middle East and Africa Hemostats Industry Revenue Share (%), by Product 2024 & 2032
- Figure 74: Middle East and Africa Hemostats Industry Volume Share (%), by Product 2024 & 2032
- Figure 75: Middle East and Africa Hemostats Industry Revenue (Million), by Application 2024 & 2032
- Figure 76: Middle East and Africa Hemostats Industry Volume (K Unit), by Application 2024 & 2032
- Figure 77: Middle East and Africa Hemostats Industry Revenue Share (%), by Application 2024 & 2032
- Figure 78: Middle East and Africa Hemostats Industry Volume Share (%), by Application 2024 & 2032
- Figure 79: Middle East and Africa Hemostats Industry Revenue (Million), by End User 2024 & 2032
- Figure 80: Middle East and Africa Hemostats Industry Volume (K Unit), by End User 2024 & 2032
- Figure 81: Middle East and Africa Hemostats Industry Revenue Share (%), by End User 2024 & 2032
- Figure 82: Middle East and Africa Hemostats Industry Volume Share (%), by End User 2024 & 2032
- Figure 83: Middle East and Africa Hemostats Industry Revenue (Million), by Country 2024 & 2032
- Figure 84: Middle East and Africa Hemostats Industry Volume (K Unit), by Country 2024 & 2032
- Figure 85: Middle East and Africa Hemostats Industry Revenue Share (%), by Country 2024 & 2032
- Figure 86: Middle East and Africa Hemostats Industry Volume Share (%), by Country 2024 & 2032
- Figure 87: South America Hemostats Industry Revenue (Million), by Product 2024 & 2032
- Figure 88: South America Hemostats Industry Volume (K Unit), by Product 2024 & 2032
- Figure 89: South America Hemostats Industry Revenue Share (%), by Product 2024 & 2032
- Figure 90: South America Hemostats Industry Volume Share (%), by Product 2024 & 2032
- Figure 91: South America Hemostats Industry Revenue (Million), by Application 2024 & 2032
- Figure 92: South America Hemostats Industry Volume (K Unit), by Application 2024 & 2032
- Figure 93: South America Hemostats Industry Revenue Share (%), by Application 2024 & 2032
- Figure 94: South America Hemostats Industry Volume Share (%), by Application 2024 & 2032
- Figure 95: South America Hemostats Industry Revenue (Million), by End User 2024 & 2032
- Figure 96: South America Hemostats Industry Volume (K Unit), by End User 2024 & 2032
- Figure 97: South America Hemostats Industry Revenue Share (%), by End User 2024 & 2032
- Figure 98: South America Hemostats Industry Volume Share (%), by End User 2024 & 2032
- Figure 99: South America Hemostats Industry Revenue (Million), by Country 2024 & 2032
- Figure 100: South America Hemostats Industry Volume (K Unit), by Country 2024 & 2032
- Figure 101: South America Hemostats Industry Revenue Share (%), by Country 2024 & 2032
- Figure 102: South America Hemostats Industry Volume Share (%), by Country 2024 & 2032
List of Tables
- Table 1: Global Hemostats Industry Revenue Million Forecast, by Region 2019 & 2032
- Table 2: Global Hemostats Industry Volume K Unit Forecast, by Region 2019 & 2032
- Table 3: Global Hemostats Industry Revenue Million Forecast, by Product 2019 & 2032
- Table 4: Global Hemostats Industry Volume K Unit Forecast, by Product 2019 & 2032
- Table 5: Global Hemostats Industry Revenue Million Forecast, by Application 2019 & 2032
- Table 6: Global Hemostats Industry Volume K Unit Forecast, by Application 2019 & 2032
- Table 7: Global Hemostats Industry Revenue Million Forecast, by End User 2019 & 2032
- Table 8: Global Hemostats Industry Volume K Unit Forecast, by End User 2019 & 2032
- Table 9: Global Hemostats Industry Revenue Million Forecast, by Region 2019 & 2032
- Table 10: Global Hemostats Industry Volume K Unit Forecast, by Region 2019 & 2032
- Table 11: Global Hemostats Industry Revenue Million Forecast, by Country 2019 & 2032
- Table 12: Global Hemostats Industry Volume K Unit Forecast, by Country 2019 & 2032
- Table 13: United States Hemostats Industry Revenue (Million) Forecast, by Application 2019 & 2032
- Table 14: United States Hemostats Industry Volume (K Unit) Forecast, by Application 2019 & 2032
- Table 15: Canada Hemostats Industry Revenue (Million) Forecast, by Application 2019 & 2032
- Table 16: Canada Hemostats Industry Volume (K Unit) Forecast, by Application 2019 & 2032
- Table 17: Mexico Hemostats Industry Revenue (Million) Forecast, by Application 2019 & 2032
- Table 18: Mexico Hemostats Industry Volume (K Unit) Forecast, by Application 2019 & 2032
- Table 19: Global Hemostats Industry Revenue Million Forecast, by Country 2019 & 2032
- Table 20: Global Hemostats Industry Volume K Unit Forecast, by Country 2019 & 2032
- Table 21: Brazil Hemostats Industry Revenue (Million) Forecast, by Application 2019 & 2032
- Table 22: Brazil Hemostats Industry Volume (K Unit) Forecast, by Application 2019 & 2032
- Table 23: Mexico Hemostats Industry Revenue (Million) Forecast, by Application 2019 & 2032
- Table 24: Mexico Hemostats Industry Volume (K Unit) Forecast, by Application 2019 & 2032
- Table 25: Rest of South America Hemostats Industry Revenue (Million) Forecast, by Application 2019 & 2032
- Table 26: Rest of South America Hemostats Industry Volume (K Unit) Forecast, by Application 2019 & 2032
- Table 27: Global Hemostats Industry Revenue Million Forecast, by Country 2019 & 2032
- Table 28: Global Hemostats Industry Volume K Unit Forecast, by Country 2019 & 2032
- Table 29: Germany Hemostats Industry Revenue (Million) Forecast, by Application 2019 & 2032
- Table 30: Germany Hemostats Industry Volume (K Unit) Forecast, by Application 2019 & 2032
- Table 31: United Kingdom Hemostats Industry Revenue (Million) Forecast, by Application 2019 & 2032
- Table 32: United Kingdom Hemostats Industry Volume (K Unit) Forecast, by Application 2019 & 2032
- Table 33: France Hemostats Industry Revenue (Million) Forecast, by Application 2019 & 2032
- Table 34: France Hemostats Industry Volume (K Unit) Forecast, by Application 2019 & 2032
- Table 35: Italy Hemostats Industry Revenue (Million) Forecast, by Application 2019 & 2032
- Table 36: Italy Hemostats Industry Volume (K Unit) Forecast, by Application 2019 & 2032
- Table 37: Spain Hemostats Industry Revenue (Million) Forecast, by Application 2019 & 2032
- Table 38: Spain Hemostats Industry Volume (K Unit) Forecast, by Application 2019 & 2032
- Table 39: Rest of Europe Hemostats Industry Revenue (Million) Forecast, by Application 2019 & 2032
- Table 40: Rest of Europe Hemostats Industry Volume (K Unit) Forecast, by Application 2019 & 2032
- Table 41: Global Hemostats Industry Revenue Million Forecast, by Country 2019 & 2032
- Table 42: Global Hemostats Industry Volume K Unit Forecast, by Country 2019 & 2032
- Table 43: China Hemostats Industry Revenue (Million) Forecast, by Application 2019 & 2032
- Table 44: China Hemostats Industry Volume (K Unit) Forecast, by Application 2019 & 2032
- Table 45: Japan Hemostats Industry Revenue (Million) Forecast, by Application 2019 & 2032
- Table 46: Japan Hemostats Industry Volume (K Unit) Forecast, by Application 2019 & 2032
- Table 47: India Hemostats Industry Revenue (Million) Forecast, by Application 2019 & 2032
- Table 48: India Hemostats Industry Volume (K Unit) Forecast, by Application 2019 & 2032
- Table 49: South Korea Hemostats Industry Revenue (Million) Forecast, by Application 2019 & 2032
- Table 50: South Korea Hemostats Industry Volume (K Unit) Forecast, by Application 2019 & 2032
- Table 51: Taiwan Hemostats Industry Revenue (Million) Forecast, by Application 2019 & 2032
- Table 52: Taiwan Hemostats Industry Volume (K Unit) Forecast, by Application 2019 & 2032
- Table 53: Australia Hemostats Industry Revenue (Million) Forecast, by Application 2019 & 2032
- Table 54: Australia Hemostats Industry Volume (K Unit) Forecast, by Application 2019 & 2032
- Table 55: Rest of Asia-Pacific Hemostats Industry Revenue (Million) Forecast, by Application 2019 & 2032
- Table 56: Rest of Asia-Pacific Hemostats Industry Volume (K Unit) Forecast, by Application 2019 & 2032
- Table 57: Global Hemostats Industry Revenue Million Forecast, by Country 2019 & 2032
- Table 58: Global Hemostats Industry Volume K Unit Forecast, by Country 2019 & 2032
- Table 59: Middle East Hemostats Industry Revenue (Million) Forecast, by Application 2019 & 2032
- Table 60: Middle East Hemostats Industry Volume (K Unit) Forecast, by Application 2019 & 2032
- Table 61: Africa Hemostats Industry Revenue (Million) Forecast, by Application 2019 & 2032
- Table 62: Africa Hemostats Industry Volume (K Unit) Forecast, by Application 2019 & 2032
- Table 63: Global Hemostats Industry Revenue Million Forecast, by Product 2019 & 2032
- Table 64: Global Hemostats Industry Volume K Unit Forecast, by Product 2019 & 2032
- Table 65: Global Hemostats Industry Revenue Million Forecast, by Application 2019 & 2032
- Table 66: Global Hemostats Industry Volume K Unit Forecast, by Application 2019 & 2032
- Table 67: Global Hemostats Industry Revenue Million Forecast, by End User 2019 & 2032
- Table 68: Global Hemostats Industry Volume K Unit Forecast, by End User 2019 & 2032
- Table 69: Global Hemostats Industry Revenue Million Forecast, by Country 2019 & 2032
- Table 70: Global Hemostats Industry Volume K Unit Forecast, by Country 2019 & 2032
- Table 71: United States Hemostats Industry Revenue (Million) Forecast, by Application 2019 & 2032
- Table 72: United States Hemostats Industry Volume (K Unit) Forecast, by Application 2019 & 2032
- Table 73: Canada Hemostats Industry Revenue (Million) Forecast, by Application 2019 & 2032
- Table 74: Canada Hemostats Industry Volume (K Unit) Forecast, by Application 2019 & 2032
- Table 75: Mexico Hemostats Industry Revenue (Million) Forecast, by Application 2019 & 2032
- Table 76: Mexico Hemostats Industry Volume (K Unit) Forecast, by Application 2019 & 2032
- Table 77: Global Hemostats Industry Revenue Million Forecast, by Product 2019 & 2032
- Table 78: Global Hemostats Industry Volume K Unit Forecast, by Product 2019 & 2032
- Table 79: Global Hemostats Industry Revenue Million Forecast, by Application 2019 & 2032
- Table 80: Global Hemostats Industry Volume K Unit Forecast, by Application 2019 & 2032
- Table 81: Global Hemostats Industry Revenue Million Forecast, by End User 2019 & 2032
- Table 82: Global Hemostats Industry Volume K Unit Forecast, by End User 2019 & 2032
- Table 83: Global Hemostats Industry Revenue Million Forecast, by Country 2019 & 2032
- Table 84: Global Hemostats Industry Volume K Unit Forecast, by Country 2019 & 2032
- Table 85: Germany Hemostats Industry Revenue (Million) Forecast, by Application 2019 & 2032
- Table 86: Germany Hemostats Industry Volume (K Unit) Forecast, by Application 2019 & 2032
- Table 87: United Kingdom Hemostats Industry Revenue (Million) Forecast, by Application 2019 & 2032
- Table 88: United Kingdom Hemostats Industry Volume (K Unit) Forecast, by Application 2019 & 2032
- Table 89: France Hemostats Industry Revenue (Million) Forecast, by Application 2019 & 2032
- Table 90: France Hemostats Industry Volume (K Unit) Forecast, by Application 2019 & 2032
- Table 91: Italy Hemostats Industry Revenue (Million) Forecast, by Application 2019 & 2032
- Table 92: Italy Hemostats Industry Volume (K Unit) Forecast, by Application 2019 & 2032
- Table 93: Spain Hemostats Industry Revenue (Million) Forecast, by Application 2019 & 2032
- Table 94: Spain Hemostats Industry Volume (K Unit) Forecast, by Application 2019 & 2032
- Table 95: Rest of Europe Hemostats Industry Revenue (Million) Forecast, by Application 2019 & 2032
- Table 96: Rest of Europe Hemostats Industry Volume (K Unit) Forecast, by Application 2019 & 2032
- Table 97: Global Hemostats Industry Revenue Million Forecast, by Product 2019 & 2032
- Table 98: Global Hemostats Industry Volume K Unit Forecast, by Product 2019 & 2032
- Table 99: Global Hemostats Industry Revenue Million Forecast, by Application 2019 & 2032
- Table 100: Global Hemostats Industry Volume K Unit Forecast, by Application 2019 & 2032
- Table 101: Global Hemostats Industry Revenue Million Forecast, by End User 2019 & 2032
- Table 102: Global Hemostats Industry Volume K Unit Forecast, by End User 2019 & 2032
- Table 103: Global Hemostats Industry Revenue Million Forecast, by Country 2019 & 2032
- Table 104: Global Hemostats Industry Volume K Unit Forecast, by Country 2019 & 2032
- Table 105: China Hemostats Industry Revenue (Million) Forecast, by Application 2019 & 2032
- Table 106: China Hemostats Industry Volume (K Unit) Forecast, by Application 2019 & 2032
- Table 107: Japan Hemostats Industry Revenue (Million) Forecast, by Application 2019 & 2032
- Table 108: Japan Hemostats Industry Volume (K Unit) Forecast, by Application 2019 & 2032
- Table 109: India Hemostats Industry Revenue (Million) Forecast, by Application 2019 & 2032
- Table 110: India Hemostats Industry Volume (K Unit) Forecast, by Application 2019 & 2032
- Table 111: Australia Hemostats Industry Revenue (Million) Forecast, by Application 2019 & 2032
- Table 112: Australia Hemostats Industry Volume (K Unit) Forecast, by Application 2019 & 2032
- Table 113: South Korea Hemostats Industry Revenue (Million) Forecast, by Application 2019 & 2032
- Table 114: South Korea Hemostats Industry Volume (K Unit) Forecast, by Application 2019 & 2032
- Table 115: Rest of Asia Pacific Hemostats Industry Revenue (Million) Forecast, by Application 2019 & 2032
- Table 116: Rest of Asia Pacific Hemostats Industry Volume (K Unit) Forecast, by Application 2019 & 2032
- Table 117: Global Hemostats Industry Revenue Million Forecast, by Product 2019 & 2032
- Table 118: Global Hemostats Industry Volume K Unit Forecast, by Product 2019 & 2032
- Table 119: Global Hemostats Industry Revenue Million Forecast, by Application 2019 & 2032
- Table 120: Global Hemostats Industry Volume K Unit Forecast, by Application 2019 & 2032
- Table 121: Global Hemostats Industry Revenue Million Forecast, by End User 2019 & 2032
- Table 122: Global Hemostats Industry Volume K Unit Forecast, by End User 2019 & 2032
- Table 123: Global Hemostats Industry Revenue Million Forecast, by Country 2019 & 2032
- Table 124: Global Hemostats Industry Volume K Unit Forecast, by Country 2019 & 2032
- Table 125: GCC Hemostats Industry Revenue (Million) Forecast, by Application 2019 & 2032
- Table 126: GCC Hemostats Industry Volume (K Unit) Forecast, by Application 2019 & 2032
- Table 127: South Africa Hemostats Industry Revenue (Million) Forecast, by Application 2019 & 2032
- Table 128: South Africa Hemostats Industry Volume (K Unit) Forecast, by Application 2019 & 2032
- Table 129: Rest of Middle East and Africa Hemostats Industry Revenue (Million) Forecast, by Application 2019 & 2032
- Table 130: Rest of Middle East and Africa Hemostats Industry Volume (K Unit) Forecast, by Application 2019 & 2032
- Table 131: Global Hemostats Industry Revenue Million Forecast, by Product 2019 & 2032
- Table 132: Global Hemostats Industry Volume K Unit Forecast, by Product 2019 & 2032
- Table 133: Global Hemostats Industry Revenue Million Forecast, by Application 2019 & 2032
- Table 134: Global Hemostats Industry Volume K Unit Forecast, by Application 2019 & 2032
- Table 135: Global Hemostats Industry Revenue Million Forecast, by End User 2019 & 2032
- Table 136: Global Hemostats Industry Volume K Unit Forecast, by End User 2019 & 2032
- Table 137: Global Hemostats Industry Revenue Million Forecast, by Country 2019 & 2032
- Table 138: Global Hemostats Industry Volume K Unit Forecast, by Country 2019 & 2032
- Table 139: Brazil Hemostats Industry Revenue (Million) Forecast, by Application 2019 & 2032
- Table 140: Brazil Hemostats Industry Volume (K Unit) Forecast, by Application 2019 & 2032
- Table 141: Argentina Hemostats Industry Revenue (Million) Forecast, by Application 2019 & 2032
- Table 142: Argentina Hemostats Industry Volume (K Unit) Forecast, by Application 2019 & 2032
- Table 143: Rest of South America Hemostats Industry Revenue (Million) Forecast, by Application 2019 & 2032
- Table 144: Rest of South America Hemostats Industry Volume (K Unit) Forecast, by Application 2019 & 2032
Frequently Asked Questions
1. What is the projected Compound Annual Growth Rate (CAGR) of the Hemostats Industry?
The projected CAGR is approximately 5.20%.
2. Which companies are prominent players in the Hemostats Industry?
Key companies in the market include C R Bard Inc (BD), Abbott Laboratories, CSL Behring LLC, Grifols S A, Dexur, Johnson & Johnson, Tricol Biomedical, Baxter International Inc, Medtronic plc, Pfizer Inc.
3. What are the main segments of the Hemostats Industry?
The market segments include Product, Application, End User.
4. Can you provide details about the market size?
The market size is estimated to be USD XX Million as of 2022.
5. What are some drivers contributing to market growth?
Increasing Number Of Trauma And Surgical Cases; Technological Advancements.
6. What are the notable trends driving market growth?
Surgery Segment is Expected to Hold a Significant Market Share.
7. Are there any restraints impacting market growth?
Stringent Regulatory Policies and Increasing Use of Off-Label Products.
8. Can you provide examples of recent developments in the market?
In May 2022, Precision BioLogic Inc., a developer of hemostasis diagnostic products, reported the launch of its new cryocheck Chromogenic Factor IX assay in Canada, the European Union, and the United Kingdom, Australia, and New Zealand.
9. What pricing options are available for accessing the report?
Pricing options include single-user, multi-user, and enterprise licenses priced at USD 4750, USD 5250, and USD 8750 respectively.
10. Is the market size provided in terms of value or volume?
The market size is provided in terms of value, measured in Million and volume, measured in K Unit.
11. Are there any specific market keywords associated with the report?
Yes, the market keyword associated with the report is "Hemostats Industry," which aids in identifying and referencing the specific market segment covered.
12. How do I determine which pricing option suits my needs best?
The pricing options vary based on user requirements and access needs. Individual users may opt for single-user licenses, while businesses requiring broader access may choose multi-user or enterprise licenses for cost-effective access to the report.
13. Are there any additional resources or data provided in the Hemostats Industry report?
While the report offers comprehensive insights, it's advisable to review the specific contents or supplementary materials provided to ascertain if additional resources or data are available.
14. How can I stay updated on further developments or reports in the Hemostats Industry?
To stay informed about further developments, trends, and reports in the Hemostats Industry, consider subscribing to industry newsletters, following relevant companies and organizations, or regularly checking reputable industry news sources and publications.
Methodology
Step 1 - Identification of Relevant Samples Size from Population Database


Step 2 - Approaches for Defining Global Market Size (Value, Volume* & Price*)

Note*: In applicable scenarios
Step 3 - Data Sources
Primary Research
- Web Analytics
- Survey Reports
- Research Institute
- Latest Research Reports
- Opinion Leaders
Secondary Research
- Annual Reports
- White Paper
- Latest Press Release
- Industry Association
- Paid Database
- Investor Presentations

Step 4 - Data Triangulation
Involves using different sources of information in order to increase the validity of a study
These sources are likely to be stakeholders in a program - participants, other researchers, program staff, other community members, and so on.
Then we put all data in single framework & apply various statistical tools to find out the dynamic on the market.
During the analysis stage, feedback from the stakeholder groups would be compared to determine areas of agreement as well as areas of divergence


